-
Paper Information
- Next Paper
- Paper Submission
-
Journal Information
- About This Journal
- Editorial Board
- Current Issue
- Archive
- Author Guidelines
- Contact Us
Marine Science
p-ISSN: 2163-2421 e-ISSN: 2163-243X
2013; 3(1): 1-8
doi:10.5923/j.ms.20130301.01
High Sensitive Seawater Resistant SERS Substrates Based on GoldIsland Film Produced by Electroless Plating
Hossam Ahmad , Heinz-Detlef Kronfeldt
Technische Universität Berlin, Institut für Optik und Atomare Physik, Hardenbergstraße, 36, 10623, Berlin, Germany
Correspondence to: Hossam Ahmad , Technische Universität Berlin, Institut für Optik und Atomare Physik, Hardenbergstraße, 36, 10623, Berlin, Germany.
| Email: |  |
Copyright © 2012 Scientific & Academic Publishing. All Rights Reserved.
High sensitive seawater resistant SERS (surface-enhanced Raman scattering) substrates based on gold island film were designed by electroless plating solution of chloroauric acid (HAuCl4) and hydrogen peroxide (H2O2) in order to detect pollutions such as Polycyclic Aromatic Hydrocarbons (PAHs) at low concentrations (nmol/l) in the marine environment.By controlling the electroless plating time the SERS substrates were optimized due to their SERS sensitivity for pyrene as a representative PAH.Additionally, shifted excitation Raman difference spectroscopy (SERDS) was applied to suppress the fluorescence background and improve dramaticallythe Raman signals, which yields to a limit of detection (LOD) for pyrene of 1.0(1) nmol/l. Long-term stability tests werecarried out over 12 weeks and show that the SERS activity is only slightly reduced within the first two weeks storage in sea water, after 4 weeks about 50 % and after 8 weeks about 15 % of the activity is still present. The reproducibility of fabricating the substrates is better 8 % and the variance of a single substrate around 2.4 %. The designed SERS substrates are highly sensitive, seawater resistant, reproducible, and can be easily manufactured even during a cruise. Therefore, they are best suited for in-situ detection of PAHs in the marine environment.
Keywords: Seawaterresistant SERS Surfaces, Gold Island Film, Electroless Plating, SERS/SERDS, PAH
Cite this paper: Hossam Ahmad , Heinz-Detlef Kronfeldt , High Sensitive Seawater Resistant SERS Substrates Based on GoldIsland Film Produced by Electroless Plating, Marine Science, Vol. 3 No. 1, 2013, pp. 1-8. doi: 10.5923/j.ms.20130301.01.
Article Outline
1. Introduction
- In the last decades, considerable attention has been given to Raman spectroscopy, which is a non-invasive and non-destructive method, as analytical technique for the identification and quantification of substances. This is due to the fingerprint nature of the spectra. The inherently low cross-section of the Raman scattering limits its application in trace analysis of pollutants. Surface enhanced Raman scattering (SERS) has been recognized as a powerful analytical tool for environmental analysis since its discovery by Fleischmann[1]. In principle, SERS is based on the Raman signal amplification of analyte adsorbed to the noble metal nanoparticle which induces the extremely high localized electromagnetic field around the metal surface. It has already been demonstrated that SERS activity depends on two factors: the electromagnetic enhancement in the vicinity of metal nanoparticle and the chemical enhancement due to the increase of Raman scattering cross-section of analyte in contact with metal nanoparticle[2]. SERS provides an enhancement factor for the Raman signal up to 1015[3-5] whichbring this analytic technique into the region of trace investigation. Recently, polycyclic aromatic hydrocarbons (PAHs) have been gained increasing attention because they are known to be toxic to biota[6]. For this reason, it has been attempted to develop several types of SERS substrate suitable for the trace detection of PAHs in aqueous solution. They include Ag colloid based sol gel-film[7-9], dimercaptoacetic acid (DMCX) functionalized Ag colloid based sol-gel film[10,11], self-assembly metal colloid film[12-14], calixarene functionalized Ag colloid[15-17], cyclodextrin modified Ag nanoparticles[18],naturally grown Ag nanoparticles on quartz substrates[19,20]and partition layer-modified Ag film over nanosphere[21]. A worldwide important application of SERS is the detection of pollutants in the oceans. However, the concentration of chemicals dissolved in seawater is extremely low, e.g. the concentrations of PAHs are in the nmol/l region or less varying spatially and temporally[22]. High sensitive seawater resistant SERS substrate is needed with a high reproducibility, i.e. suited for in-situ measurements over days and weeks. We introduced a gold island film as SERS substrate based on electroless plating from a solution of HAuCl4/H2O2 mixture. This is a low-cost method and easy to implement on any on-board laboratory during a cruise, i.e. there is no need for extensive preparation facilities. The characteristics of the substrates, such as surface plasmon resonance and SEM image, were presented in respect to the long-term stability in the artificial sea water and the reproducibility of the substrates. Additionally, SERS/SERDS spectra were applied to reduce the fluorescence [background[23].
2. Experimental Section
2.1. Chemicals and Materials
- (3-aminopropyl)trimethoxysilane (APTMS, 97%), HauCl4 (99.999%), trisodium citrate (99.5%), methanol, H2O2 (30%),HNO3 (69%) and HCl (37%) were obtained from Sigma-Aldrich, H2SO4 (95% - 98%) was from Merck. Circular quartz substrates were purchased from Yixing Jingke Optical Instrument Company (China). Pyrene as a selected PAHs sample was obtained from Fluka. To prepare artificial sea water 30 g of a commercial salt mixture (Instant Ocean) was dissolved in 1 l of distilled water. By dissolving pyrene in the artificial sea water different concentrations ranging from 400 nmol/l down to 0.5 nmol/l were under investigation.
2.2. SERS Substrate Preparation
- All glassware used in this work were cleaned by using freshly aqua regia (three parts of HCl and one part of HNO3) and then rinsed with distilled water. Colloidal gold nanoparticles were preparedby reduction of HAuCl4 with citrate following the method proposed by Frens[24]. 20 ml of 3 mmol/l HAuCl4 was brought to boil with continuous stirring, and then 20 ml of 8 mmol/l trisodium citrate was added. The mixture solution was boiled on a hot plate for 1 h under reflux and magnetic stirring. After that the hot plate was removed and the mixture was cooled down to room temperature while stirring. To enhance the gold adhesion on the substrate, the quartz plate was silanized by using APTMS as a silanizing reagent. The silanization procedure was done as follows. First, the substrate was cleaned with acetone and methanol, then treated for 20 min in piranha solution (70% H2SO4, and 30%H2O2) at 70℃ and subsequently rinsed with methanol. Piranha solution was used to remove organic impurities andproduce hydroxyl groups at the surface of the substrate. After that, the cleaned substrates were immersed in a 10% (V/V) methanol solution of APTMS for 2 h. After immersion the substrate was vigorously rinsed with methanol for several times to remove the surplus APTMS which could cause the aggregation of gold nanoparticles. Next, the substrate was baked into an oven for 1 h at 100℃. The silanized substrate was then immersed into the gold colloid solution for 1 h and subsequently rinsed with distilled water. Electroless gold plating was performed by using a mixture solution from HAuCl4 and H2O2 as mentioned in[25]. The gold-coated substrate was dipped in 0.01% HAuCl4 solution and then 0.5 ml of 30% H2O2 was added with continuous shaking for different plating times from 1 min up to 6 min. H2O2 served as a reducing agent to reduce AuCl-4 to the Au atom. The substrate was then washed with distilled water and stored in distilled water until use. Figure 1 shows a scheme of the preparation process of the electroless plating substrate.
2.3. Experimental Setup
- The measurements were performed with a SERS optode, which was already developed by our group and tested up to a pressure of 20 MPa[26,27]. The scheme of the experimental setup is shown in Figure2. As a light source a 1.5 W BA-DFB diode laser emitting at 785 nm (1) is applied[28]. The laser light is collimated by an aspheric lens (2) with f = 8 mm (all lenses were purchased from ThorLabs, Germany) and coupled into a 50 μm optical fiber (6) by a lens (5) with f = 16 mm. To prevent back-reflection from re-entering the laser an optical isolator (Gsänger DLI-1, 60 dB) (3) is used. The laser power is reduced to 70 mW at the sample by a grey filter (4). The output laser beam from the optical fiber is collimated by a lens (7) with f = 6 mm and then passes through a band pass filter (Quarterwave, Germany) (8). The laser light is guided by a dielectric mirror (ThorLabs, Germany) (9) and one of the two Raman edge filters (Quarterwave, Germany) (10) to an achromatic lens (11) with f = 16 mm. By this lens, the laser beam is focused on the top of a SERS substrate which isfixed in the front of the quartz window (12). The back-scattered radiation is collected by the lens (11) and only Raman Stokes radiation passes through the two Raman edge filters (10), i.e. they eliminate the laser light and the Anti-Stokes signal. The Raman Stokes signal is coupled into a 100 μm optical fiber (14) by means of an achromatic lens (13) with f = 16 mm and then transferred into the spectrometer (Princeton Instrument PI 320) (15). The spectra were recorded with a back-illuminated deep-depletion CCD (DU420-BR-DD, Andor) (16) TE-cooled and operated at -60℃and at last analyzed by a computer (17). The optical components (7 – 13) were integrated in the pressure housing (18) suitable to work in the water depth down to 2000 m[26, 27].
 | Figure 1. Scheme of the preparation procedure of the SERS substrate |
3. Results and Discussion
3.1. Characterization of the SERS Substrates
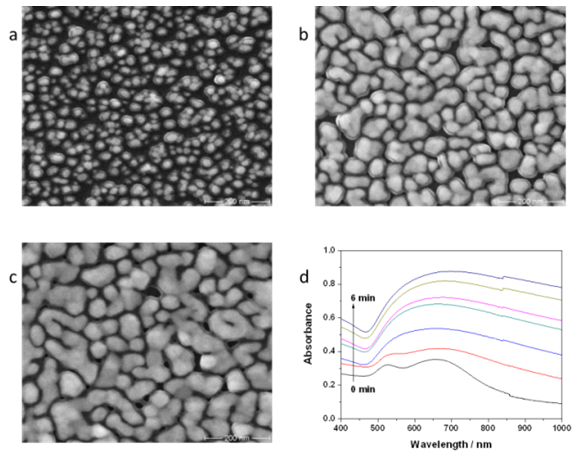
- The morphologies of the substrates were investigated by scanning electron microscope (SEM) images. Figure 3 shows the SEM images for the initial gold substrate (Figure 3 a), after 3 min plating time (Figure 3 b), and after 6 min plating time (Figure 3 c), respectively. For the initial gold substrate, the size of nanoparticles is between 15 and 30 nm. After using the electroless plating solution the nanoparticles size increases and the separation between nanoparticles decreases and the formation of gold islands begins. Island size in the Figure3b is about 80 nm and about 150 nm in Figure3c.The optical properties of the electroless plating gold substrates were studied by VIS-NIR absorption measurements (Perkin-Elmer, lambda 19). Figure 3d shows the extinction spectra for these substrates for different electroless plating times up to 6 min (0 min indicates the initial gold film without any plating). For initial gold colloid substrate and for electroless plating time of 1 min two small absorption bands are observed. A first band is at 525 nm due to isolated gold nanoparticles and another at 660 nm from the aggregate plasmon resonance. Increasing the plating time from 2 min up to 6 min broad absorption bands can be observed, which is shifted to higher wavelengths from 665 nm for 2 min to 695 nm for 6 min.The absorption intensity increases with increasing the plating time.
3.2. Optimization of the SERS Substrate for High Sensitivity
- To determine the optimal electroless plating time, SERS spectra of 400 nmol/l of pyrene in artificial sea water were measured using SERS substrates with different plating times. The laser power in these measurements was 70 mW, the integration time 10 s. For each of the 3 positions of the substrates 10 spectra were averaged. The dependence of the normalized SERS intensity of pyrene at 589 cm-1 with that at 994 cm-1 from the silane layer is presented in Figure4. The error bars represent the standard deviation of 6 positions from two substrates for each electroless plating time. Figure 4 shows that the SERS signals increase with increasing the plating time up to a maximum intensity for 3 min. After that, the SERS signals decrease. This behavior is explained by García-Vidal and Pendry in[29]. They have theoretically demonstrated that the dipole-dipole interaction between nanoparticles is increased with decreasing the distance between metal features causing rising in SERS enhancement maximum, which is also red shifted. Their results showed that the enhancement maximum is blue shifted and reduced when the touching nanoparticles is increased which decrease the degree of surface roughness.
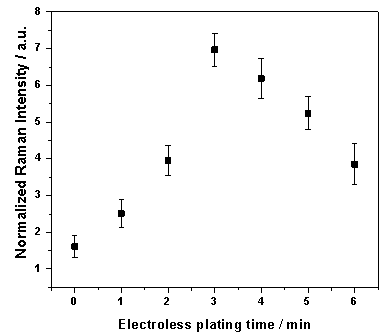 | Figure 4. SERS signal of 400 nmol/l pyrene in artificial sea water at 589 cm-1 versus plating time of initial gold nanoparticles in the electroless plating solution |
3.3. Application of SERS/SERDS for Pyrene
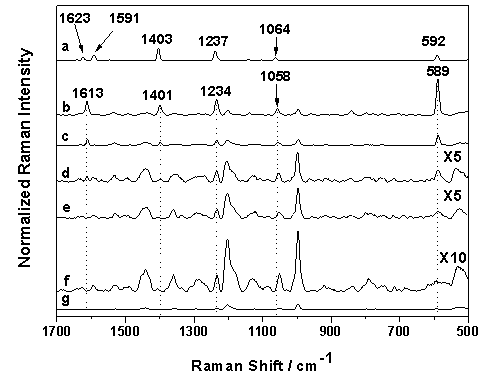
- SERS spectra can contain high fluorescence backgrounds, which can mask weak Raman signals, especially in the case of low concentrations. To overcome this problem, shifted excitation Raman difference spectroscopy (SERDS) was performed. To obtain SERDS, two laser wavelengths (785.0 nm and 784.5 nm) were applied to record two slightly shifted SERS spectra. E.g. in our measurements the spectral difference is 0.5 nm (8 cm-1). While the Raman spectra are shifted the broad fluorescence is nearly stationary[30]. After calculating the difference spectrum from the two shifted spectra the fluorescence background is widely removed and only the Raman bands appear. Using a self-developed algorithm[31] the SERS/SERDS spectra can be evaluated. In order to illustrate the advantage of SERDS, a SERS spectrum (black) and a SERS/SERDS spectrum (red) of 10 nmol/l pyrene in artificial sea water are plotted in Figure5. The measurements were done with 10 s integration time and 10 single spectra were recorded with a laser power of 70 mW. As shown in Figure5 the high fluorescence background in the SERS spectrum is efficiently removed in the SERS/SERDS spectrum and the weak Raman bands at 589 cm-1, 1234 cm-1, 1400 cm-1 and 1613 cm-1 become clearly visible. The unsigned signals are resulting from the substrate.
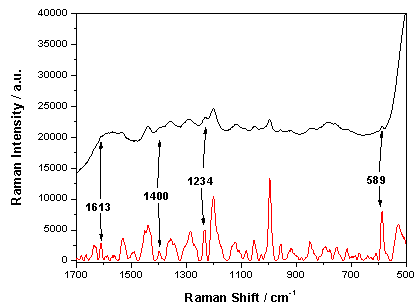 | Figure 5. Comparison between the SERS spectrum (black) and the SERS/SERDS spectrum (red) of 10 nmol/l pyrene, 10 x 10 s integration time and 70 mW laser power |
3.4. Long term Stability of the SERS Substrates
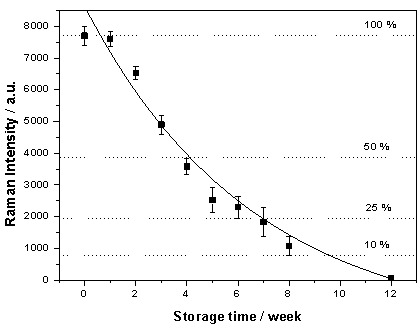 | Figure 7. SERS/SERDS Intensity of 400 nmol/l pyrene versus storage time in artificial sea water |
- In order to test the long-term stability of the SERS substrates for sea-water applications 4 substrates were stored for 12 weeks in artificial seawater. The SERS/SERDS spectra of 400 nmol/l pyrene at 589 cm-1 versus the storage time are plotted in Figure7. The error bars in Figure7 represent the standard deviation for 120 spectra (four substrates, three different positions from each substrate and ten spectra each) – the exposure time was 10 s for each spectra. In the first week there is no significant change in the substrate activity intensity, then the SERS intensity starts to decrease approximately exponentially. The activity is decreased to about 50 % within four weeks of storage. After 8 weeks the SERS activity was decreased to about 15 %, which means that the exposure time has to be enlarged from 10 s up to 1 min, i.e. almost an acceptable measuring time. After 12 weeks of storage of the substrates in sea-water the Raman signals were no longer recognizable.
3.5. Reproducibility of the SERS Substrates
- In order to test the reproducibility of the SERS substrates, SERS/SERDS spectra were recorded for 14 substrates, which were fabricated at three different days. Three different positions for each substrate were randomly chosen for the measurements of 10 spectra each with 10 s integration time. As target spectra 400 nmol/l pyrene in artificial seawater was used and the average intensity of the 589 cm-1 Raman band of 30 spectra for each substrate was calculated and the statistical results from 420 single spectra evaluated. The variance of the substrates ranges between 0.8 % and 3.8 %- this is due to the fact that the surface is not completely equal covered and the measuring points are randomly chosen. Nevertheless, a mean reproducibility variance of 2.4 % is a quite good result. The reproducibility between the substrates is better than 8 %.This shows that the electroless plating substrates are well suited for routine SERS-sensor applications, e.g. to detect chemicals in sea-water.
3.6. Concentration Dependency of the Raman Intensity
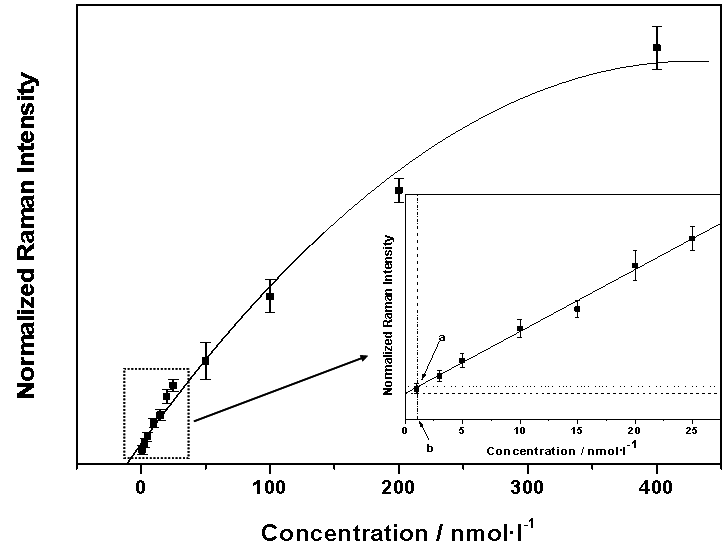
- The SERS/SERDS spectra of pyrene in the artificial sea water were obtained at different concentration ranging from 0.5 nmol/l to 400 nmol/l, using laser power of 70 mW and 10 s as integration time. The Raman intensity of the pyrene peak at 589 cm-1 was normalized due to the 994 cm-1 signal from the silane layer. The concentration dependency of that normalized Raman intensity of pyrene in artificial sea water was shown in Figure8. The calibration curve can be fitted with a Langmuir isotherm.By means of 3σ criterion the limit of detection (LOD) of pyrene was calculated. A standard approach of LOD calculation is as follows: at the lowest concentrations, ranging from 1 nmol/l to 25 nmol/l, a linear fit can be approximated (solid line in the inset Figure8). After that, the main blank signal (dashed line in the inset Figure8) was plotted. By computing the standard deviation σ from the blank sample and adding the value of 3σ to the main blank signal value, the blank signal standard deviation line can be drawn (dotted line in the inset Figure8). As shown in Figure8 there is an interception point a (in the inset Figure8) between the fitting line of the lowest concentration and the blank signal standard deviation line. This point was projected to the x-axis at a point b (the inset in Figure8). The point b determines the LOD of pyrene in artificial sea water, which is 1.0(1) nmol/l.
4. Conclusions
- In this work, electroless plating solution containing HAuCl4/H2O2 mixture was applied to design gold island films as SERS substrates, which aresuitable for highsensitive PAHs detection in seawater. TheseSERS substrateshave ahigh sensitivity, a good reproducibility and a long-term stability in seawater over weeks. Additionally SERDS was applying to remove the fluorescence background from the SERS spectrum – shown in the case of pyrene in sea water with extremely low concentrations (nmol/l) since even weak Raman signals of the analytewere optically resolved in the SERS/SERDS spectrum. The detection limit from the substrates are 1.0(1) nmol/l for pyrene. The substrates are reproducible with the SERS intensities variability of about 8 %. The long-term stability investigations show that the substrates have about 50 % of their activity after four weeks of storage in sea water and more than 15 % after 2 months. The sensitivity of the substrates for other PAHs and further chemicals in seawater should be tested in order to enlarge applicability. Furthermore, the substrates should be tested under real seawater conditions in a sea-going Raman instrument on a mooring or a ROV.
ACKNOWLEDGMENTS
- The authors thank to Dr. Dirk Berger and Mr. Ulrich Gernert for SEM image measurements and to Chris Scharfenorth for extinction spectra of gold film.
 Abstract
 Reference
 Full-Text PDF
 Full-text HTML
