-
Paper Information
- Previous Paper
- Paper Submission
-
Journal Information
- About This Journal
- Editorial Board
- Current Issue
- Archive
- Author Guidelines
- Contact Us
Marine Science
p-ISSN: 2163-2421 e-ISSN: 2163-243X
2012; 2(6): 139-148
doi: 10.5923/j.ms.20120206.05
Study of Macrobenthos in Relation to Eutrophication at Chilika Lagoon, East Coast of India
 Abstract
 Reference
 Full-Text PDF
 Full-Text HTML
Debasish Mahapatro 1, R. K. Mishra 1, 2, R. N. Samal 1, A. K. Patanaik 1
1Chilika Development Authority, C-11 BJB Nagar, Bhubaneswar
2National Centre for Antarctic and Ocean Research, MoES, Vasco-da-Gama, Goa
Correspondence to: R. K. Mishra , Chilika Development Authority, C-11 BJB Nagar, Bhubaneswar.
| Email: |  |
Copyright © 2012 Scientific & Academic Publishing. All Rights Reserved.
In order to find out hydrographical parameters influences over macrobenthic density and diversity, fifteen stations were sampled in Chilika lagoon. They were grouped into macrophytes dominated areas from Station 1 to Station 10 (St1 to St10) and Phragmites karka dominated areas from Station 11 to Station 15 (St 11 to St 15).The value of Pearson’s correlation matrix in the macrobenthic density was found to be positive significant relationship with transparency (r=0.548, p<0.05), depth (r=0.8006, p<0.01) and pH (r=0.72, p<0.01). Whereas macrobenthic biomass was significant positive relationship with transparency (r=0.656, p<0.01), depth (r=0.8006, p<0.01), pH (r=0.516, p<0.05) and dissolved oxygen (r=0.671, p<0.01). The diversity index values were found highest in between St1 to St10 and decreased sharply in between St11 to St15. The Non-metric Multidimensional Scaling (NMDS) resulted three clusters of stations in the study area which were characterized as live macrophyte, live and dead macrophyte and Phargmites karka in Cluster I, Cluster II and Cluster III respectively. Progressive decreasing trend was observed in macrobentic density and diversity with the hydrographical parameters of depth, transparency and dissolved oxygen from cluster I to Cluster III. The total numbers and biomass of wet weight of macrobenthic were observed 26075 no m-2 (1738 ± 3341) and 277 gm m-2 (18.47±38.83) in the sampling stations. Bivalves followed by Polychaets were dominated in the first group of stations where as Polychaet and Chronomid was dominated in the second group of stations.
Keywords: Macrobenthos, Macrophytes, Biomass, Diversity, Cluster, NMDS
Cite this paper: Debasish Mahapatro , R. K. Mishra , R. N. Samal , A. K. Patanaik , "Study of Macrobenthos in Relation to Eutrophication at Chilika Lagoon, East Coast of India", Marine Science, Vol. 2 No. 6, 2012, pp. 139-148. doi: 10.5923/j.ms.20120206.05.
Article Outline
1. Introduction
- Coastal lagoons covers 13% of the total coastline of the world, and generally characterized as shallow depth, brackish water mass, strong seasonal variation in salinity thermal stratification, elevated tidal amplitude, wind and tide generated waves. These are known as transitional water mass and formed between fresh and marine water habitat. These “ecotones” are found to be highly productive to the enrichment of nutrients by receiving silt bone and nutrient rich fresh water inputs from rivers and rivulets, catchment area and from marine zone[1] and poses limited exchange with the adjacent sea[2,3]. The definition of coastal lagoon was proposed by[4] as “a shallow coastal water body separated from the ocean by a barrier, connected at least intermittently to the ocean by one or more restricted inlets, and usually oriented shore-parallel. Thus the characteristics of coastal lagoon were more or less controlled by the riverine and marine influenced followed by natural and anthropogenic inputs. In recent years occurrence of eutrophication is getting momentum in coastal shallow waters due to excess nutrient load that further helped for higher primary productivity[5, 6, 7].The coastal water hypoxia on physiological responses and survival for benthic organisms can be very complex depending on the structure of food webs and life history of affected species. Larval stages are often more sensitive than adult individuals to low oxygen concentrations and hence less tolerant to hypoxia[22].Chilika lagoon is the largest brackish water lagoon in Asia located at east coast of India. It is regarded as Ramsar Site due to it’s vast biodiversity and enriched fishery resources. This lagoon is connected with Bay of Bengal through two inlets. Due to its shallow nature, it often serves as good nursery breeding and feeding ground for birds, fishes and shellfishes. The north-western part of Chilka lagoon showed infestations macrophytic weeds in general and Phragmites Karka in particular which restricted for navigation and fishery. Less attention has been paid to understand the hydrography and biological characterization of such weed infested areas. Hence present study was observed to find out some basic information pertaining to the hydrography and distribution of macrobenthic organisms on spatial scale.
2. Material and Methods
2.1. Study Site
- The lagoon Chilika is the world's second largest brackish water wetland ecosystem where different marine brackish and freshwater habitat coexists. It is located between 19o 28' and 190 54' N and 850 05' and 850 38' E covering three districts like Khurda, Puri and Ganjam of Orissa State in India. This lagoon looks like pear-shaped measured length about 64.5 km long and its width varies from 5 km to 18 km. The water spread area varies seasonally from 906 to 1165 sq. km. It bears a wide range of sub ecosystems like such as marshes, mudflats, freshwater zone, sand bars Islands etc. Different vegetation types are commonly seen which include submergent, emergent, mixed, reed bed and grassland, sea grass beds, sea weed areas. Hydrographically, the lagoon is broadly divided into northern sector (fresh water zone), central sector (brackish water zone), southern sector (brackish water cum marine zone) and outer channel area (marine zone).there is 32 kilometre long sand spit that run parallel to the bay of Bengal and opened to it through two openings such as “Gobakunda” inlet and “Shipakuda” inlet.
2.2. Sampling Stations
- This study was carried out in 15 stations located in and around the macrophyte belts from central and northern sector of lagoon (Fig 1). The sampling stations were broadly grouped into two such as the first group contains stations numbered from St1 to St10 ranged from “Chandraput” to “Sorana” village (Central sector) covering massive submerging and surface floating macrophytes and the second group ranged as St11-St15 (Northern sector) covering “Kalupadaghat” to “Bhusandapur” village. The locations were marked by using a standard GPS device (Fig 1).
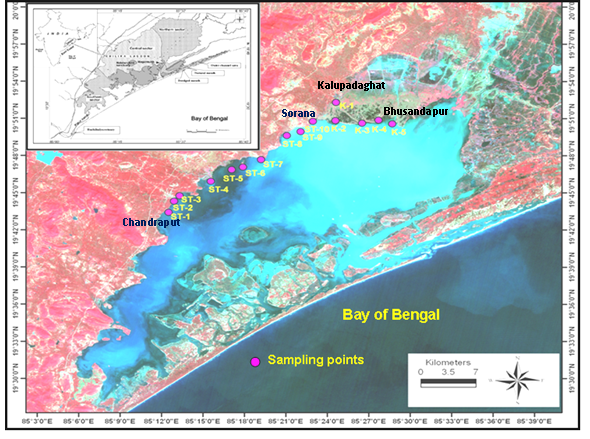 | Figure 1. Map showing sampling station locations |
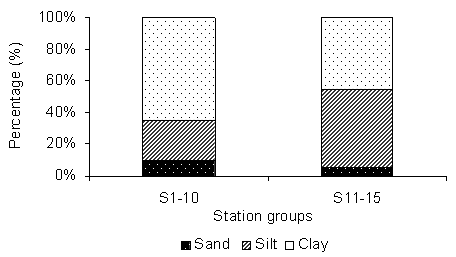 | Figure 2. Represents sand, silt and clay percentage (mean) in the two groups of stations |
2.3. Sampling Methodology
- Water and sediment samples were collected during the post monsoon season from 15 pre-fixed stations for the analysis of different physico-chemical parameters like Depth (cm), Transparency (cm) and Salinity (psu), Conductivity (s/m), temperature (℃) pH, Turbidity (NTU), Dissolved Oxygen (mg/l). In biological parameters the macrobenthic density and biomass samples were collected for analysis. Sediment samples were collected by using garb sampler of known surface area (0.04 m2) in triplicate, one is kept for texture analysis and other samples were wet sieved through 0.5 mm mesh size to collect the macrobenthic organisms and the collected samples were preserved with 5 % neutralised formalin-Rose Bengal solution. The macrobenthic organisms were identified up to their possible lowest taxonomic level and grouped in four major groups such as Polychaeta of Oligochaeta, Crustacea of Mysids, Bivalve of Gastropod and Misc. The Miscellaneous group contains nematodes, Chironomids, etc. The population density was expressed in number per sq. meter area (no m-2) while the biomass is expressed in gram per sq. meter area (gm m-2).
3. Results
3.1. Sediment Texture
- The analysis of sediment texture showed two types in two different regions of the lagoon. In first group of region between St1 to St10, the clay content was dominated, whereas in other group between St11 to St15 Silt was dominated.In the first group the sand, silt and clay percentage was 10 %, 25 % and 65 % and in second group it was 5%, 50% and 45 % respectively. There is a visible spatial heterogeneity was observed in the sampling location (Fig 2)
3.2. Hydrography
- During the study period the water depth was ranged from 20 to 121 cm (76±20). The transparency of light in the water column was ranged from 8 to 117 cm (50.6±28). There was a progressive decrease of depth and transparency values from St1 to St15 and similar spatial variation among the station were recorded and found to be the significant at 95% (ANOVA; P<0.05). Turbidity value was ranged from 3.7-289 NTU (49±72). There was a progressive increase of turbidity value from station St1 to St15. The salinity was ranged from 0 to 5.7 (2±2). Progressive decrease trend was observed on spatial scale and the variation between the stations was observed significant (ANOVA; p<0.05). Dissolved oxygen was varied from 3.2 to 12.7 mg/l (7±3) with large fluctuations between St1 to St10; whereas the last five stations have showed decreasing trend between St11 to St15. Water temperature was not found to be fluctuated too much except few difference in spatial scale with range from 26.1 to32 0C (29.3±2). The pH value of the sampling location was found alkaline in nature and was ranged from 6.8 to 8.81(8±1).The population density and biomass in St 8 was comparatively good; ranged from 20 to 11475 no m-2 and 0.01 to 141 gm m-2 respectively, and (mean ± standard deviation) was (1743±3339 no.m-2 and 18.4±38 gm m-2) as shown in Table-1. The ANOVA test revealed strong spatial variation in hydro-biological parameters (P<0.05).
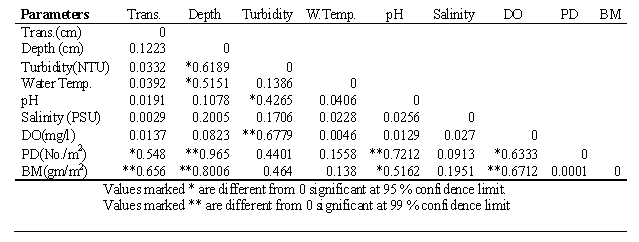
3.3. Correlation Matrix
- The Table-2 showed the result of Pearson’s correlation matrix between physicochemical parameters with macrobenthic population density and biomass. The results revealed that macrobenthic population density was positive significant relationship with transparency (r=0.548, p<0.05, N=15), depth (r=0.8006, p<0.01, N=15) and pH (r=0.72, p<0.01,N=15). Similarly macrobenthic biomass showed significant relationship with transparency (r=0.656, p<0.01, N=15), depth (r=0.8006, p<0.01, N=15), pH (r=0.516, p<0.05, N=15) and dissolved oxygen (r=0.671, p<0.01, N=15). Turbidity showed moderate influence to population density and biomass. Other parameters were insignificant with macrobanthic population as shown in Table-2.
|
3.4. Population Density and Biomass
- All total 26075 no m-2 (1738 ± 3341) of numbers and 277 gm m-2 (18.47 ± 38.83) of biomass (wet weight) number of macrobenthic organisms were encountered during the study. Among the first group of stations from St1 to St10, the highest population 11475 no/m2 density was observed at St8 followed by 7350 no/m2 at St3 and minimum 150 no/m2 was observed at St4. In second group from St11 to St15, the highest value of population density was in St14 and the lowest value of density was marked in St13. However the St11, St12, and St13 were no contribution to the total macrobenthic bulk (Fig 2). So far the biomass values were concerned among first group of stations, St8 was the highest of 142 gm/m2 and lowest in St7 of 4 gm/m2. Among the second group of stations St14 was highest of 1 gm/m2. The average biomass was found (18.7 ±38.8) gm/sq m (Fig 2).
3.5. Group and Species Composition
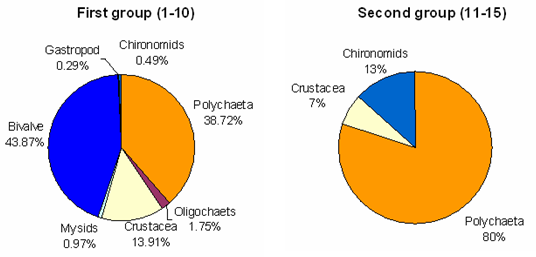
- All total seven macrobenthic groups were encountered during the study period. In the first group Bivalves were the most dominant group represented by Modiolus striatulus, Theora opalina etc. Polychaets were recorded as the second most dominant group of representing the species like Nereis, Nepthys, Capitella, Heteromastus etc. Crustaceansrepresented 13.91% with contributing amphipod and isopoda. The dominate genus of amphipoda were, Orchestia, Ampelisca, Gammarus, while the isopoda group contributed Apseudes chilkensis, Cirolana, Tanais, etc. Oligochaets contributed 1.75%. However less contribution was represented by gastropoda of Nassarious, Indoplanorbis Hydrobia, and Lymnea. Mysids chironomids contributed 0.97 % and 0.49 % respectively. In contrast to first group, the second group only contributed polychaeta which was dominated mostly and represented by 80 % with Capitella capitata, Heteromasts sp. Followed by second dominated group Chironomid and third dominated group with Crustacean represented by Gammarus and Isopoda represented with Apseudes chilkensis.
3.6. Macrophytes
- Common macrophytes observed in the first group of stations were Hydrilla verticillata, Vallisneria spiralis, Ceratophyllum demersum, Utricularia Scirpus littoralis, Ipomea, Nymphaea and Cyperus sp. Potamogeton pectinatus, Potamogeton, Ruppia maritima, Najas sp., Najas graminea etc. In the second group of stations were emerged macrophytes such as Phragmites Karka which was the most dominant emergent species followed by the Eichornia and Hydrilla.
3.7. Univariate, Multivariate analysis and Diversity Indices
- The diversity indices of the two sampling groups of stations are represented in the figure-6. The Simpson’s species dominance of the two groups of stations showed sharp variations representing the fact that none of the group of stations exhibits any dominant of species. Species diversity which often reflects the status of the sampling site was exhibited higher value in the first group as compared to the second group of stations which was dominated with Phragmites karka. Species evenness was also found to be more in the first group. There was a consistently decrease in diversity indices from first group of stations to second group of stations (Fig 6)
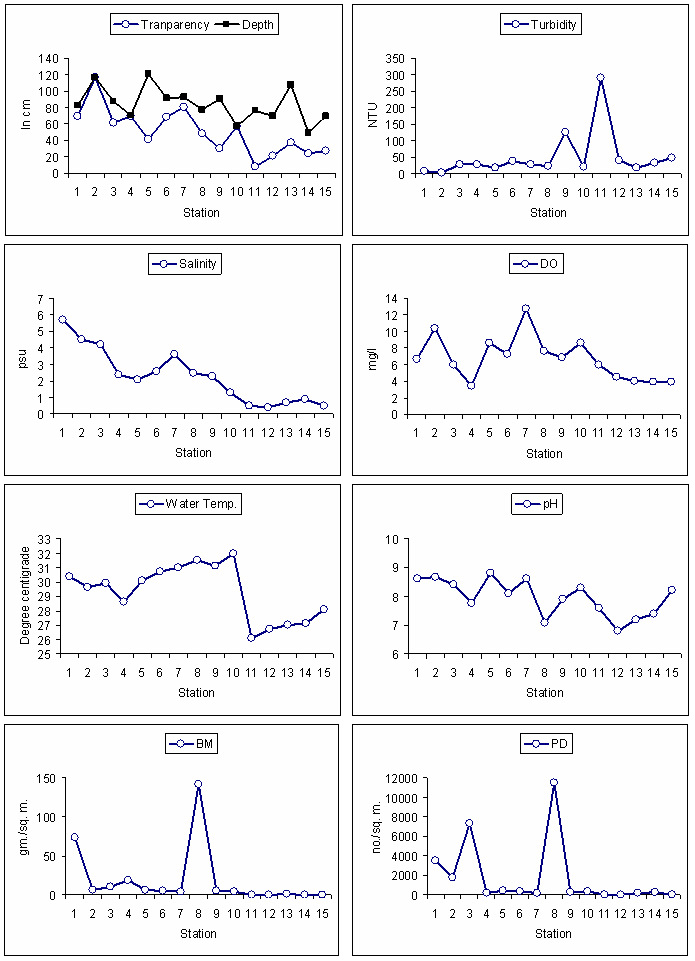 | Figure 3. Environmental and biological parameters of study area |
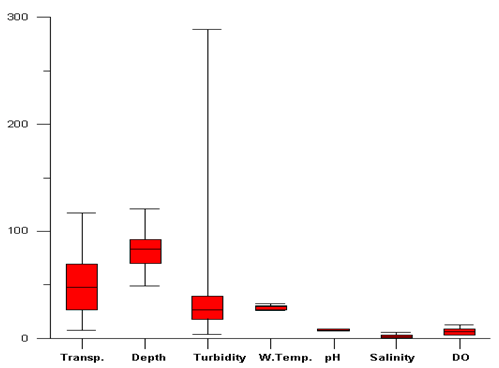 | Figure 4. Box whiskers plot of hydrographical parameters of sampling stations |
 | Figure 5. Relative abundance of macrobenthic groups |
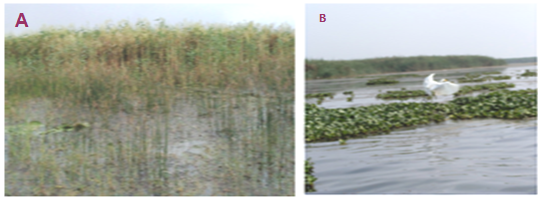 | Figure 6. A: Invading weed Phragmites karka and B: Other macrophytes from the sampling stations |
|
3.8. Non-metric Multi Dimensional Scaling (NMDS)
- To explore the similarity between the stations a NMDS was carried out and the results were superimposed over on clusters with the similarity level of 62. The finding of non-metric Multi Dimensional Scaling (NMDS) revealed that there was a strong spatial heterogeneity in the water quality parameters in general and the macrobenthic density and biomass in particular. Three main clusters appeared from NMDS were grouped as Cluster -I, Cluster II and Cluster III. The mean values of hydrographical parameters along with macrobenthic density and biomass were reported (Table 3) which was pooled out from NMDS and cluster analysis.
4. Discussion
- Shallow water coastal lagoons are more susceptible to eutrophication condition due to high influx of nutrient rich fresh water runoff from catchment and recycling of nutrient by the decomposition of organic matter. Again frequent sediment-water coupling due to wind mediated wave and tidal action effect the trophic status of the lagoon habitat[8].The variation in dissolved oxygen concentration in trophic enriched lagoon is a major concerned. Being a life supporting parameters the dissolved oxygen plays an important role on sustainability of wide range of organisms and their lower values due to the decay and decomposition in macrophytes dominated areas shows adverse impact on other living organisms[9]. However long-term hypoxia causes anoxic condition[10]. The present study which was made at north-western region of Chilika lagoon revealed that there was instances of less depth, low values of transparency and high turbidity. Turbidity of the water column is a main factor which determines the light availability for primary production, and high turbidity in the water column interrupts the light availability to the bottom environment which facilitates more decomposition than production of organic matter[10]. In the present study, turbidity value was found higher in the Phragmites Karka infested areas St11 to St 15 as compared to other (Fig.3).From correlation matrix population density and biomass of macrobenthic organisms showed good correlation with transparency and depth which implies that good photic property of water favours good macro benthic density and biomass. Turbidity showed good correlation with dissolved oxygen might be due to the presence of surface floating macrophyte or microalgae in the water column. Both pH and dissolved oxygen imparted strong relationship over macrobenthic density and biomass (p<0.01). This can be believed as the macrobenthic organisms prefer little alkaline condition of ambient water and high values of dissolved oxygen for better growth and proliferation (Table-2).The diversity index values were found high in first group of stations as compared to the second group. Non-metric Multi Dimensional Scaling and cluster analysis (Fig 8A and 8B) described that high macrobenthic density and standing crop were observed in those areas where turbidity was found low with increased dissolved oxygen value but reverse trend was marked when the Cluster I was compared with Cluster III which was characterized by high turbidity, low transparency and dissolved oxygen value which further concomitantly followed by decreased values of macrobenthic density and biomass. Our finding could be highly corroborated with the observations made at other lagoons which are reported elsewhere[11, 12, 13, 14]. Increase in the organic input has adverse influence on community structure, composition and distribution of macrobenthos in the trophicated aquatic ecosystems, is well documented[15, 16, 17] where the larger and long lived organisms were replaced with short lived and smaller sized organisms[18]. Other parameters to access the trophic status of the sampling site are the estimation of population density and biomass of macrobenthos due to which it is used as bio indicators of environmental stress[19]. A sharp reduction in species diversity with less species richness, evenness and abundance of benthic macroinvertebrates towards Phragmites Karka invade station indicated an adverse condition to frequent colonization of macrobenthos. But our study revealed that few organisms were observed in Phargmites Karka dominated areas. These were Capitella Capitata (Polychaeta), Chirnomids (Dipteran larvae), Gammarus sp. (Gammarid amphipod) and Apseudes chilkensis (isopoda). The Polychaeta of Capitella Capitella is commonly observed in the organically enriched sediment due to of its opportunistic nature[20]. Similarly the appearance of chironomids in the nutrient enriched water was also reported elsewhere. Thus they can be used as the important organisms for the study of eutrophication in the shallow water coastal aquatic ecosystem[21].
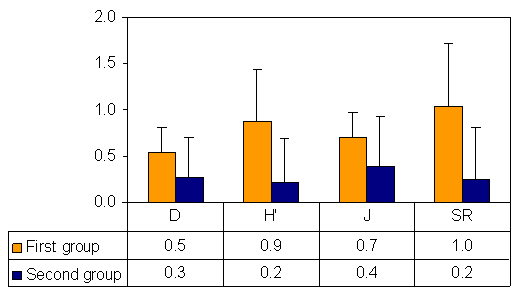 | Figure 7. Mean and ± values of different species diversity indices of sampling station Legends- D = Simpson’s species dominance, H’=Shannon’s species diversity index, J = Pielou's species evenness and SR= Margalef’s species richness |
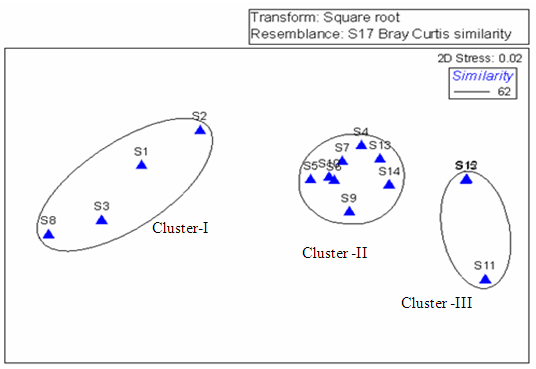 | Figure 8A. Non- Metric Multi-Dimensional Scaling showing three different groups |
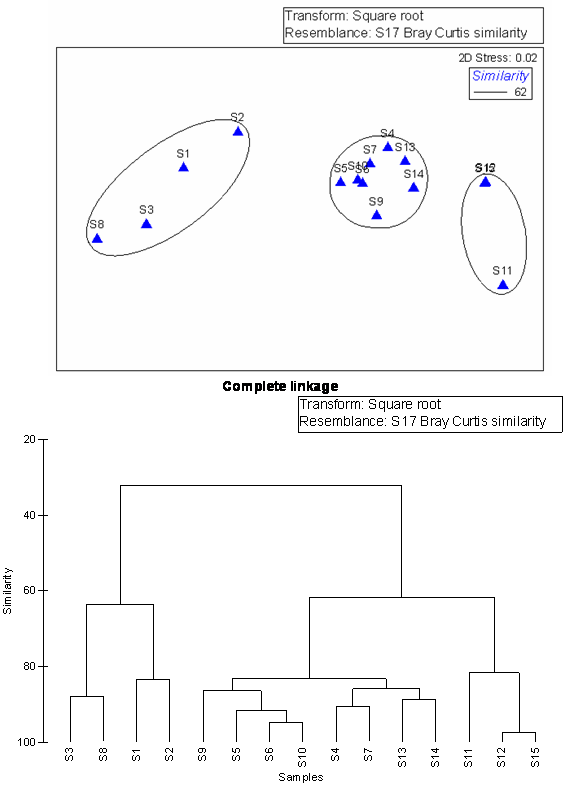 | Figure 8B. Cluster analysis of sampling stations (complete linkage) |
5. Conclusions
- Chilika lagoon normally influences by nutrient enrichment due to influx of large fresh water and anthropogenic activity. Hence results the large variation of macrobenthic diversity and biomass in the lagoon. Dissolved oxygen played a crucial role in the region. The higher values of dissolved oxygen resulted in sampling stations as mesotrophic than eutrophic in the region. The Non-metric Multidimensional Scaling resulted as live saprophyte, live and dead macrophyte and Phragmites Karka dominated stations in Cluster I, Cluster II and Cluster III respectively in the lagoon. Progressive decreasing trend was observed in depth, transparency, dissolved oxygen, macrobenthic density and diversity from cluster I to Cluster III. Therefore cluster represented the region of dominance of macrobenthic population. Bivalves followed by Polychaets were dominated in the first group of stations where as Polychaeta and Chronomid dominated in the second group of stations. The study also showed the macrobenthic presence of Capitella in the region. However the study is required to get more valuable information on macrobenthic relation with macrophytes understanding better food web and ecosystem modelling. Further proper management practice should be developed to reduce the instances of eutrophication in the lagoon and maintain the healthy macro benthic population in sustainable ecosystem.
ACKNOWLEDGEMENTS
- The authors wish to thank the Director, Chilika Development Authority, Government of Orissa, for the infrastructural facility and support during the study period. One of the author’s RKM would like to acknowledge the Director NCAOR, MoES, Government of India, Goa for encouraging the preparation of manuscript.
References
| [1] | Nixon, S. W. 1982. Nutrient dynamics, primary production and fisheries yields of lagoons. Pages 357-371 in Oceanologica Acta, Proceedings of the International Symposium on Coastal Lagoons (Bordeaux, France, 1981). SCOR/IABO/UNESCO. |
| [2] | Tagliapietra D, Volpi Ghirardini A, 2006. Notes on coastal lagoon typology in the light of the EU Water Framework Directive: Italy as a case study. Aquatic Conservation: Marine and Freshwater Ecosystems 16: 457-467. |
| [3] | McLusky, D.S. and Elliott, M. 2007. Transitional waters: A new approach, semantics or just muddying the waters? Estuarine, Coastal and Shelf Science 71: 359-363. |
| [4] | Kjerfve, B., 1994. Coastal Lagoon Processes. Elsevier Science Publishers, Amsterdam, xx + 577 pp. |
| [5] | Fisher TR, Melack JM, Grobbelaar JU, Howarth RW (1995) Nutrient limitation of phytoplankton and eutrophication of inland, estuarine, and marine waters. In: Tiessen H (ed) Phosphorus in the global environment. Wiley, Chichester, pp 301–322. |
| [6] | Kinney EH, Roman CT (1998) Response of primary producers to nutrient enrichment in a shallow estuary. Mar Ecol Prog Ser 163:89–98. |
| [7] | Cloern JE (2001) Our evolving conceptual model of the coastal eutrophication problem. Mar Ecol Prog Ser 210:223–253. |
| [8] | Castel J., Caumette P., Herbert R.A. 1996. Eutrophication gradients in coastal lagoons as exemplified by the Bassin d’Arcachon and Etang du Prévost. Hydrobiologia 329:ix–xxviii. |
| [9] | Breitburg, D., 2002. Effects of hypoxia, and the balance between hypoxia and enrichment, on coastal fishes and fisheries. Estuaries 25:767-781. |
| [10] | Diaz, R.J., Rosenberg, R., 1995. Marine benthic hypoxia: A review of its ecological effects and the behavioural responses of benthic macrofauna. Oceanography and Marine Biology: an annual review 33:245-303. |
| [11] | Ibáñez, C., Rodrigues-Capítulo, A. and Prat, N. 1995. The combined impacts of river regulation and eutrophication on the dynamics of the salt wedge and the ecology of the lower Ebro River, In: The Ecological Basis for River Management, D. Harper and A. Ferguson Ed., John Wiley & Sons Ltd., Chichester, UK. |
| [12] | Viaroli, P., Naldi, M., Bondavalli, C., Bencivelli, S., 1996. Growth of the seaweed Ulva rigida C. Agardh in relation to biomass densities, internal nutrient pools and external nutrient supply in the Sacca di Goro lagoon (Northern Italy). Hydrobiologia 329, 93-103. |
| [13] | Koutsoubas, D., Dounas, C., Arvanitidis, C.S., Kornilios, S., Petihakis, G., Triantafyllou, G., Eleftheriou, A., 2000. Macrobenthic community structure and disturbance assessment in Gialova Lagoon, Ionian Sea. International Committee for Exploration of the Seas: Journal of Marine Sciences 57:1472-1480. |
| [14] | Reizopoulou S., Nicolaidou A., 2004. Benthic diversity of coastal brackish-water lagoons in western Greece. Aquatic conservation: Marine and freshwater ecosystems 14, S93-102. |
| [15] | Lardicci, C., Rossi, F., Castelli, A., 1997. Analysis of macrozoobenthic community structure after severe dystrophic crises in a Mediterranean coastal lagoon. Marine Pollution Bulletin 34:536-547. |
| [16] | Tagliapietra D., Pavan M., Wagner C., 1998. Macrobenthic community changes related to eutrophication in Pallude della Rosa (Venetian lagoon, Italy). Estuarine, Coastal and Shelf Science 47: 217-226. |
| [17] | Dolbeth M., Pardal M.A., Lillebo A.I., Azeiteiro U. and Marques J.C., 2003. Short- and long-term effects of eutrophication on the secondary production of an intertidal macrobenthic community. Marine Biology 143:1229-1238. |
| [18] | Pearson T. H. and Rosenberg R. 1978. Macrobenthic succession in relation to organic enrichment and pollution of the marine environment. Oceanography and Marine Biology: An Annual Review 16: 229-311. |
| [19] | Dauer D. M., 1993. Biological criteria, environmental health and estuarine macrobenthic community structure. Mar. Poll. Bull. 26: 249-257. |
| [20] | Grizzle R. E. (1984). Pollution indicator species of macrobenthos in a coastal lagoon Mar. Ecol. Prog. Ser. Vol. 18: 191-200, |
| [21] | Bazzanti Marcello and Seminara Marco (1985). Seasonal changes of the profundal macrobenthic community in a polluted lake Aquatic Sciences - Research Across Boundaries Volume 47, Number 1 / March, 1985. |
| [22] | Rabalais, N.N.,D’iaz,R.J.,Levin,L.A.,Turner, R.E., Gilbert,D.,and Zhang,j.: Dynamics and distribution of natural and human cause hypoxia,Biogeoscience, 7,585-619,2010. |