-
Paper Information
- Next Paper
- Previous Paper
- Paper Submission
-
Journal Information
- About This Journal
- Editorial Board
- Current Issue
- Archive
- Author Guidelines
- Contact Us
Marine Science
p-ISSN: 2163-2421 e-ISSN: 2163-243X
2012; 2(6): 132-138
doi: 10.5923/j.ms.20120206.04
Insitu Raman Setup for Deep Ocean Investigations Applying Two 1000 m Optical Fiber Cables and a 785 nm High Power Diode Laser
 Abstract
 Reference
 Full-Text PDF
 Full-Text HTML
Hossam Ahmad 1, Bernd Sumpf 2, Kay Sowoidnich 1, Andreas Klehr 2, Heinz-Detlef Kronfeldt 1
1Technische Universität Berlin, Institut für Optik und Atomare Physik, Sekr. EW 0-1, Hardenbergstraße, 36, 10623, Berlin, Germany
2Ferdinand-Braun-Institut, Leibniz-Institut für Höchstfrequenztechnik, Optoelectronics Department, Gustav-Kirchhoff-Str. 4, 12489, Berlin, Germany
Correspondence to: Hossam Ahmad , Technische Universität Berlin, Institut für Optik und Atomare Physik, Sekr. EW 0-1, Hardenbergstraße, 36, 10623, Berlin, Germany.
| Email: |  |
Copyright © 2012 Scientific & Academic Publishing. All Rights Reserved.
A laboratory Raman-set-up is used to demonstrate the feasibility of deep ocean measurements using 1000 m long low OH optical fibres for the excitation of the substances under study and the collection of the Raman photons. As excitation laser a 785 nm broad area distributed feedback (DFB-BA) high-power diode laser with an optical power of 1.25 W and a spectral emission width below 0.6 nm suitable for Raman spectroscopy was used.After passing beam shaping and focusing optics, a 1000 m long fiber, and a pressure-resistant optode275 mW of optical power were available at the sample. The optode also collects the Raman photons and focuses the light into the second 1000 m long fibre, which transfers the light into a spectrometer. To determine the reachable signal-to-noise ratio, Raman spectra were taken from natural minerals (sulfates, carbonates, sulfur). Even for weak Raman-signal and short integration times of 0.5 s per spectrum, the signal-to-noise ratio of 60 would be suitable for the in-situ Raman spectroscopy in deep ocean applications. Even longer optical fibres would increase to integration time up to 60 s. The shown set-up offers the opportunity to used different laser sources and spectrometers on board of a ship, only the fibres and the optode had to be suitable for deep sea conditions.
Keywords: In-Situ Raman Spectroscopy, High Power Broad Area DFB Diode Laser, Long Low OH Optical Fiber, Deep Ocean, Natural Minerals
Cite this paper: Hossam Ahmad , Bernd Sumpf , Kay Sowoidnich , Andreas Klehr , Heinz-Detlef Kronfeldt , "Insitu Raman Setup for Deep Ocean Investigations Applying Two 1000 m Optical Fiber Cables and a 785 nm High Power Diode Laser", Marine Science, Vol. 2 No. 6, 2012, pp. 132-138. doi: 10.5923/j.ms.20120206.04.
Article Outline
1. Introduction
- Since decades considerable attention has been given to Raman spectroscopy as a reliable and effective tool for remote sensing and in-situ applications in various fields e.g. ocean science. Vital to this process are continous developments in laser sources (compact diode lasers) and high performance CCDs. Due to its non-invasive and non-destructive character and the fact that water produces only weak Raman signals in the fingerprinting range,Raman spectroscopy is introduced as an important technique for potential investigation of geochemical materials on the sea floor.Due to the special environmental conditions in the deep sea, comprisinghigh pressures and extreme temperatures, measurements are often restricted in taking samples followed by laboratory analyses.However, insitu investigations are desirable in order to monitor the specimensin their ambient surroundings. For that purpose, a pressure-compensatedspe- ctrometer system for deep-ocean investigations has been tested successfully on a remotely operated vehicle ROV for measurements of gas hydrates[1],[2] and at hydrothermal andcold seep systems[3]. Furthermore, hydrothermal and cold seep minerals have been averifiedusing a laboratory setup[4] and a deep sea Raman probe for measurements of pore water geochemistry was developed recently[5]. Nevertheless, immersion of the whole Raman equipment in the deep sea has some limitations. In that way, it is difficult to use large laser system and spectrometers with higher sensitivity improving the spectral qualitydue to the space-limited pressure-resistant housings.In earlier worksit has been demonstrated that fiber optic probing for remote Raman spectrometry over a few meters has several advantages for many application areas[6-8]. In that context, Myrick and Angel[9] showed that it was possible to perform Raman measurements using a 100 m optical fiber for conventional Raman spectroscopy and a 250 m fiber for surface enhanced Raman scattering. Additionally, a long fiber-optic remote Raman probe with a length of 100 m for the detection and identification of weak Raman scatterers was discussed by Schoen et al.[10]. All of these studies applied Kr+ and Ar+ lasers as excitation light sources using emission lines in the visible spectral region. This choice offers a limitation, due to the increased fluorescence interference, e.g. by impurities in natural substances, which can completely obscure the Raman signals of the sample. To reduce this undesired fluorescence,the excitation wavelength can be shifted to the near-infrared region, e.g. at 785 nm. Furthermore, this excitation wavelength offers the advantage of being outside of the water absorption band which limits the application of Fourier transform IR instruments operating at 1064 nm[11]. After successfully realizing a 785 nm distributed feedback diode laser[12] with 200 mW of optical output power, a 1.5 W high power broad area (BA) distributed feedback (DFB) diode laser emitting at 785 nm[13] was developedrecently. Due to its small spectral bandwidth below 0.6 nm (10 cm-1), this laser is well suited as excitation source for Raman spectroscopy. In this work,we present a combination of the high power BA DFB and two 1000 m optical fibers in order to realizea laboratory Raman setup suitable for insitu experiments over long distances. This approach provides the possibility to separate the marinized optical sensor head from the on-board component containing laser and spectrometer. Hence, different laser sources and high-resolution spectrometers on board of the ship can be applied and different kinds of targets like minerals, fluids, and gases can be probed by exchanging the optical sensor head according to the measurement task. In addition, investigations in space limited areas like drilled holes are possible by mounting the optical sensor head on a flexible arm. Beside deep ocean usage,the presented experimental configuration might be also of interest forfurther applications where a spatial separation of spectrometer and laser from the target is necessary. This comprises harsh (high pressure, high or low temperatures, aggressive or explosive targets) or space-limited (e.g. boreholes)measurement conditions.
 | Figure 1. Optical power-current and voltage-current characteristic of the BA DFB diode laser at 25℃ |
2. Materials and Methods
2.1. Laser Source
- For Raman measurements under deep sea conditions using long excitation and collection fibers,the light sources must fulfill two preconditions. On the one hand, the spectral line width of the laser source has to be adapted to the typical bandwidth of the substances under study as well as to the spectral resolution of the spectrometer. In our case, the targets are sub-marine minerals present in the deep sea environment typically having a spectral width of characteristic Raman bands of 10 cm-1[14]. In combination with the spectrometer resolution of 10 cm-1this requires a laser emission width of 10 cm-1or below, corresponding to a spectral width of Δλ = 0.6 nm at a wavelength of λ = 785 nm. On the other hand, the output power from the diode laser has to be largeenough to ensurean excitation power ex fiber of at least 50 mW to enable reasonable measurement times. For this reason, standard ridge waveguide (RW) DFB lasers cannot be used asthey have typical maximal output powers of about 200 mW as reported by Wenzel et al.[12]. Taking into account the typical attenuation of fibers in this spectral range, a minimum output power of 1 W is required for deep sea applications. Hence, the capabilities of a broad area (BA) DFB diode laser offer the potential to meet these requirements. The laser devicehas a stripe width of 50 µm and a length of 1.5 mm. It was grown with a two-step metal organic vapor phase epitaxy and the internal grating for frequency stabilization was manufactured by holographic exposure. More details about the device structure and the manufacturing processcan be found in Maiwald et al.[13]. The diode laser is mounted p-side down on a C-mount. The power-voltage-current characteristic at an operational temperature of T= 25℃ is shown in Figure 1 exhibiting a threshold current ofIth = 290 mA and a slope efficiency of S = 0.85 W/A. The maximum optical output power at an injection current of I = 2 A amounts to P = 1370 mW.
 | Figure 2. Optical spectra versus injection current of the BA DFB diode laser at T = 25℃ |
 | Figure 3. Lateral near field (top) and far field (bottom) profiles at T = 25℃ and optical output powers of 1000 mW and 1250 mW |
 | Figure 4. Raman signal of the 1000 m optical fiber cable without using a bandpass filter (BPF) (a) and with using a BPF (b |
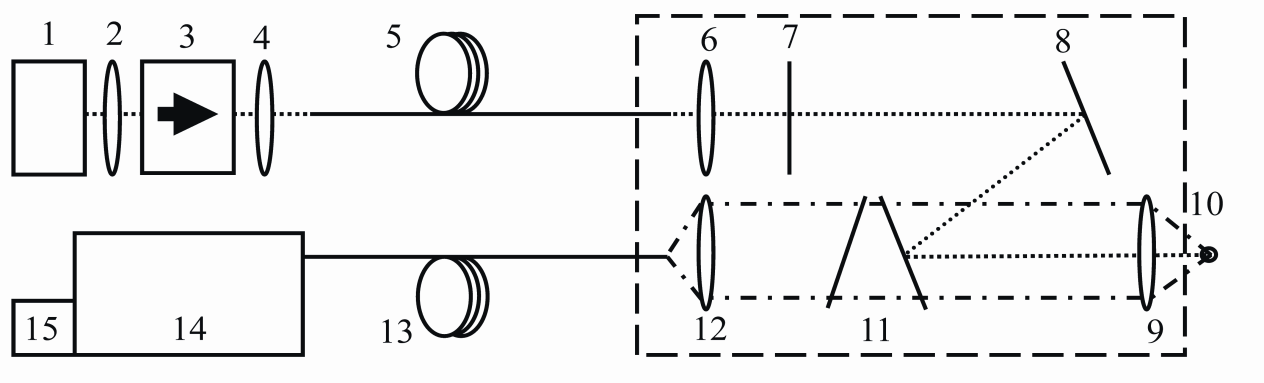 | Figure 5. Scheme of the experimental setup suitable for Raman investigation in the deep sea; (1) 1.25 W BA DFB diode laser emitting at 785 nm, (2) aspheric lens, (3) optical isolator, (4) lens, (5) 1000 m optical fiber, (6) lens, (7) band pass filter, (8) dielectric mirror, (9) achromatic lens, (10) sample, (11) Raman edge filters, (12) achromatic lens, (13) 1000 m optical fiber, (14) spectrometer and (15) CCD |
- In order to measure the Raman signal originating from the fiber itself, the laser beam was coupled into the fiber using the configuration mentioned above and the output radiation from the fiber was collimated by a lens with f = 16 mm. Subsequent application of two Raman edge filters rejects the laser light and only transmits the Raman Stokes radiation which was then focused into the spectrometer by another lens with f = 16 mm. The recorded Raman spectrum of the optical fiber is presented in Figure 4 (a). Here, prominent silica bands are dominant in the range up to 800 cm-1 and could overlap with sample Raman signals, thus disturbingthe measurement. Therefore, a 785 nm band pass filter with a transmission of 91 % at 785 nm and a bandwidth of 8 nm at FWHM was placed after the excitation fiber to efficiently reject the Raman scattering radiation arising from the quartz fiber (see Figure 4 (b)).
2.2. Experimental Raman Setup
- In order to transfer the excitation laser radiation to the target and the backscattered Raman signal to the detector,two low OH fiber optic cables (AS 105/125) with a length of 1000 m each, provided by FiberTech GmbH, Germany, were used.The laboratory setup, which should prove the capability for deep sea Raman investigations, is schematically shown in Figure 5. The output beam of the 785 nm diode laser (1) with an optical power of1250 mWis collimated by an aspherical lens (all lenses were purchased from ThorLabs, Germany) (2) and then passes through an optical isolator (Gsänger DLI-1, 60 dB) (3) to prevent back-reflections into the laser diode. Using a lens with f = 16 mm (4), the laser beam is coupled into the1000 m excitation fiber (5). A lens (6) with f = 16 mm serves for collimation of the output beam from this excitation fiber. A band pass filter (Quarterwave, Germany) (7) was used to spectrally clean the laser radiation and to eliminate the frequency shifted radiation arising from Raman scattering inside the 1000 m quartz fiber. The laser beam is reflected by a dielectric mirror (ThorLabs, Germany) (8) to a Raman edge filter (Quarterwave, Germany) (11) which guides the radiation to an achromatic lens (9) with f = 8 mm. This lens serves for focusing the laser beam onto the sample (10) as well as for collecting the backscattered radiation. In this case, the focused beam has a spot diameter of 50 μm and the convergence angle is equal to 28°. Only the Raman Stokes radiation passes through the two Raman edge filters, while the Rayleigh and anti-Stokes componentsare blocked. By means of an achromatic lens (12) with f = 16 mm, the Raman Stokes radiation is coupled into the 1000 m collection fiber (13) with a spot width of 100 μm and a convergence angle of 14° resulting in a high efficientcoupling. By means ofthis fiber, the Raman scattered radiation of the sample is transferred into the spectrometer (Princeton Instrument PI 320) (14) and the spectra were recorded with a back-illuminated deep-depletion CCD (DU420-BR-DD, Andor) (15) thermo-electricalycooled down to an operation temperature of -60℃. The optical components which have to be integrated into a pressure-resistant optode for deep ocean measurements are included in the dashed rectangle in Figure 5. A prototype of such a device was already developed by our group and tested up to a pressure of 20 MPawhich is equivalent to a water depth of 2000 m[17].As mentioned above, we obtained a laser power of 345 mW before the optodeusing the BA DFB diode laser and a low OH fiber as excitation fiber.In that way, the optical power at sample position amounts to 275 mW which was sufficient large to realize short measuring times of 0.5 s for one Raman spectrum. For the investigationsof the minerals, 10 spectra were averaged each for 5 different points on the sample.
2.3. Materials
- To test the capability of our setup for deep sea investigation, selected natural mineral samples as sulfates which are produced by hydrothermal vents, carbonates which can be found in shells, and sulfur which is produced by bacteria[18], were used (see Tab. 1). The samples are provided by the geoscientific collection of the Department of Geological Sciences, University of Bremen.
3. Results and Discussion
3.1. Data Treatment
- To obtain Raman spectra suitable for the identification and to study the minerals, the fluorescence background from all Raman spectra has to be removed. For this purpose, we used SOLIS software (Andor), which records the data and subtracts the backgroundof the spectra usinga cubic spline fitting. Characteristic points of the signal background were selected to obtain a continuous baseline curve which was then subtracted from the Raman data resulting in an essentially fluorescence-freeRaman spectrum.
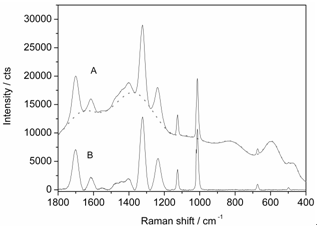 | Figure 6. Anhydrite Raman spectra: (A) raw data and baseline correction curve (dotted line), (B) baseline corrected spectrum |
3.2. Sulfates
- Anhydrite (CaSO4), gypsum (CaSO4·2H2O), and barite (BaSO4) which include the sulfate ion (SO42-) within their structure (see Table 1) were used for our investigations. The Raman spectraof these minerals are characterized by specific vibrations of the sulfate ion. Due to structural differences of these materials, slight energy shifts of the peak position can be recognized in their Raman spectral signature. Figure 7 exhibits the Raman spectra of anhydrite, gypsum, and barite. According to these spectra, the minerals can be identified with data from the literature[20]. The Raman signals of these three sulfate minerals are reproducible and the signal positions as well as their vibrational assignments are indicated in Figure 7. Here, the minor Raman bands can be recognized with signal-to-noise ratios ranging from 20 to 60. Hence, applying a 1000 m optical fiber,measurement times of only0.5 s enablesufficient signal-to-noise ratiosof the Raman signals suitable for detection and identification purposes of these mineral species. To compare our study with the previous study from White 2009[4], the relative intensities of minor Raman bands with respect to the major Raman signals were calculated. In that way, the relative intensity values were in the range from 0.03 to 0.33 which is in good agreement with White`s study.
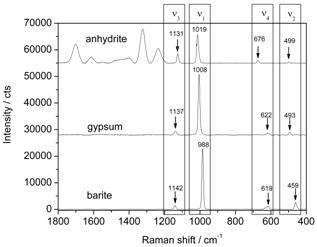 | Figure 7. Raman spectra of anhydrite (top), gypsum (center) and barite (bottom), 275 mW optical power at the sample, 0.5 s integration time, average of 10 spectra each, the anhydrite sample shows several luminescence bands above 1200 cm-1; gypsum spectrum shifted by 28000 counts and anhydrite spectrum shifted by 55000 counts for clarity |
3.3. Carbonates
- As examples of carbonates, we selected aragonite and calcite, which are two polymorphs of calcium carbonate. Despite oftheir identical chemical composition (CaCO3), both minerals have different crystal structures (see Table 1), which cause slight differences in their Raman spectra. Figure 8 presents the Raman spectra of both carbonates together with the corresponding assignment of their vibrational modes[21]. The signal-to-noise ratios of the minor Raman bands vary from 20 to 44, i.e. these small signals can be clearly detected after transmission through the 1000 m optical fiber. The relative intensities of the minor Raman signals range from 0.01 to 0.1 which is in good conformance with the data presented in the literature[4].
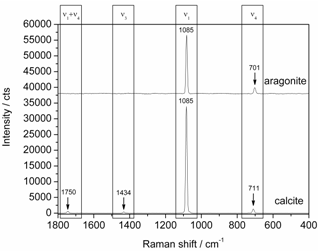 | Figure 8. Raman spectra of aragonite (top) and calcite (bottom), 275 mW optical power at the sample, 0.5 s integration time, average of 10 spectra each, aragonite spectrum shifted by 38000 counts for clarity |
3.4. Sulfur
- Elemental sulfur in the S8 configuration is also a molecule of great interest which can be found in the deep ocean. Filamentous sulfur is produced by sulfur-oxidizing bacteria[18] which provide a base for the chemosynthetic food web in the deep sea. Due to the transmission characteristics of our Raman edge filter with a cut-on wavelength at 400 cm-1 from the laser line, only two Raman signals of sulfur in the region between 400 cm-1 and 500 cm-1 can be observed whereas the signals located in the 20 - 300 cm-1 region are blocked. Hence, in Figure 9 two Raman signals due to S–S stretching can be identified at 434 cm-1 and 472 cm-1. The minor Raman band (434 cm-1) can be detected with a signal-to-noise ratio of 35 and its relative intensity amounts to 0.04. The results of our study using the low OH optical fiber for Raman signal collection are in good accordance with the literature data[3],[4].
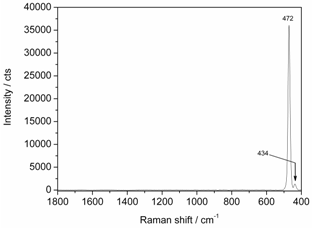 | Figure 9. Raman spectrum of sulfur, 275 mW optical power at the sample, 0.5 s integration time, average of 10 spectra |
3.5. Estimation for Deep Sea Experiments
- Based on our investigations using 1000 m optical fibers, we can estimate the experimental conditions for deep sea measurements requiring longer optical paths. Appling e.g. a 4 times longer optical path the integration time necessary to record spectra of comparable quality increases to about 16 s.Regarding connection losses, integration times of less than 1 min would occur, still enabling in-situ deep-sea measurements in the presented configuration.
4. Conclusions
- We presented a Raman setup combining a 1.25 W high power BA DFB diode laser and two 1000 m low OH fiber optical cables (AS 105/125)suitable for insitu experiments over long distances. One optical fiber was used to transfer the excitation laser light to the sub-marine mineral sample, whereas the second fiber serves to transfer the back-scattered Raman Stokes radiation from the sample to the spectrometer. Both fibers are connected to a specially designed optoderealizing optical powers of 275 mW at the sample position and enabling efficient spectral filtering. With this setup, Raman spectra of selected sulfates, carbonates, and sulfur can be detected and identified with extreme short measurement times of 0.5 s only which are well suited for in-situ deep sea investigations. Even small Raman bands of the minerals can be recognized with signal-to-noise ratio up to 60 showing the capability of the configuration with two 1000 m optical fibers and a BA DFB diode laser for in-situ deep sea investigations. For a further improvementof the signal-to-noise ratio,it would be interesting to incorporate other Raman techniques like shifted excitation Raman difference spectroscopy. For such experiments diode laser with high optical power within two slightly shifted excitation lines are required.
References
| [1] | P.Brewer, G.Malby, J.Pasteris, S.White, E.Peltzer, B.Wopenka, J.Freemann, M. Brown, "Development of a Laser Raman Spectrometer for Deep-Ocean Science", Elsevier, Deep Sea Research Part I: Oceanographic Research Papers, vol.51, no.5, pp.739-753, 2004. |
| [2] | K. C.Hester, R. M. Dunk, S. N. White, P. G. Brewer, E. T. Peltzer, E. D.Sloan, "Gas Hydrate Measurements at Hydrate Ridge Using Raman Spectroscopy", Elsevier, Geochimica et CosmochimicaActa, vol.71, no.12, pp.2947-2959, 2007. |
| [3] | S.N. White, R.M. Dunk, E.T. Peltzer, J.J. Freeman, and P.G.Brewer, "In Situ Raman Analyses of Deep-Sea Hydrothermal and Cold Seep Systems(Gorda Ridge and Hydrate Ridge)", American Geophysical Union, Geochemistry, Geophysics, Geosystems, vol.7, Q05023, doi:10.1029/2005GC001204, 2006. |
| [4] | S. N. White, "Laser Raman Spectroscopy as a Technique for Identification of Seafloor Hydrothermal and Cold Seep Minerals", Elsevier, Chemical Geology, vol.259, no.3-4, pp.240-252, 2009. |
| [5] | X. Zhang, P.M. Walz, W.J. Kirkwood, K.C. Hester, W. Ussler, E.T. Peltzer, P.G.Brewer, "Development and Deployment of a Deep-Sea Raman Probe for Measurement of Pore Water Geochemistry",Elsevier,Deep Sea Research Part I:Oceanographic Research Papers, vol.57, no.2, pp.297-306, 2010. |
| [6] | R. L. McCreery, M.Fleischmann, P. Hendra, "Fiber Optic Probe for Remote Raman Spectrometry",American Chemical Society,Analytical Chemistry, vol.55,no.1, pp.146-148, 1983. |
| [7] | S. D. Schwab, R. L. McCreery, "Versatile, Efficient Raman Sampling with Fiber Optics", American Chemical Society, Analytical Chemistry, vol.56, no.12, pp.2199-2204, 1984. |
| [8] | C. K. Chong, C. Shen, Y. Fong, J. Zhu, F.X. Yan, S. Brush, C. K. Mann, T. J.Vickers, "Raman Spectroscopy with a Fiber-Optic Probe",Elsevier, Vibrational Spectroscopy, vol.3, no.1, pp.35-45, 1992. |
| [9] | M. L. Myrick, S. M. Angel, "Elimination of Background in Fiber-Optic Raman Measurements",Society for Applied Spectroscopy, Applied Spectroscopy, vol.44, no.4, pp.565-570, 1990. |
| [10] | C. L. Schoen, T. F. Cooney, S. K. Sharma, D. M.Carey, "Long Fiber-Optic Remote Raman Probe for Detection and Identification of Weak Scatterers",Optical Society of America,Applied Optics, vol.31,no.36, pp.7707-7715, 1992. |
| [11] | B. Schrader, A.Hoffman, S.Keller, "Near-Infrared Fourier transform Raman Spectroscopy: Facing Absorption and Background",Elsevier, SpectrochimicaActa Part A: Molecular Spectroscopy, vol.47, no.9-10, pp.1135-1148, 1991. |
| [12] | H. Wenzel, A. Klehr, M. Braun, F. Bugge, G. Erbert, J. Fricke, A. Knauer, M.Weyers, G.Tränkle, "High-Power 783 nm Distributed-Feedback Laser",Institution of Engineering and Technology,Electronics Letters, vol.40, no.2, pp.123-124, 2004. |
| [13] | M. Maiwald, A. Klehr, B. Sumpf, H. Wenzel, T. Laurent, J. Wiedmann, H.Schmidt and H. D.Kronfeldt, "Reliable Operation of 785 nm DFB Diode Lasers for Rapid Raman Spectroscopy",in Proceedings of 2007 SPIE Conference on High-Power Diode Laser Technology and Applications V, pp.64560W-1-64560W-6, 2007. |
| [14] | R. L. McCreery, Raman Spectroscopy for Chemica1 Analysis, 1st ed.,John Wiley & Sons, USA, 2000. |
| [15] | Online Available:http://www.leoni-fiber-optics.com/Transmission-Tool.11883.0.html |
| [16] | B.Eppich, "Optical Design of Beam Delivery and Beamforming System"John Wiley & Sons, Optik&Photonik, vol.3, no.2, pp.48-51, 2008. |
| [17] | H. Schmidt, T. Murphy, S. Lucht and H. D.Kronfeldt, "Development of a SERS optode for the in-situ detection of chemicals in sea water", inProceedings of 1999 SPIE Conference on Environmental Monitoring and Remediation Technologies II, pp. 356-363, 1999. |
| [18] | C. D. Taylor, C. O.Wirsen, "Microbiology and Ecology of Filamentous Sulfur Formation",American Association for the Advancement of Science,Science, vol.277, no.5331, pp.1483-1485, 1997. |
| [19] | A. S. Marfunin, Spectroscopy, Luminescence and Radiation Centers in Minerals, 1st ed., Springer, Germany, 1979. |
| [20] | J. D. Stopar, P. G. Lucey, S. K. Sharma, A. K. Misra, G. J. Taylor, H. W.Hubble, "Raman Efficiencies of Natural Rocks and Minerals: Performance of a Remote Raman System for Planetary Exploration at a Distance of 10 Meters",Elsevier, SpectrochimicaActa Part A: Molecular and Biomolecular Spectroscopy, vol.61, no.10, pp.2315-2323, 2005. |
| [21] | J. S. Urmos, K. Sharma, F. T. Mackenzie, "Characterization of Some Biogenic Carbonates with Raman Spectroscopy", Mineralogical Society of America, American Mineralogist, vol.76,no.3-4, pp.641-646, 1991. |