-
Paper Information
- Next Paper
- Previous Paper
- Paper Submission
-
Journal Information
- About This Journal
- Editorial Board
- Current Issue
- Archive
- Author Guidelines
- Contact Us
Marine Science
p-ISSN: 2163-2421 e-ISSN: 2163-243X
2012; 2(5): 94-100
doi: 10.5923/j.ms.20120205.08
The Human Perception of Land Degradation in a Section of Niger Delta, Nigeria
 Abstract
 Reference
 Full-Text PDF
 Full-Text HTML
Idowu Innocent Abbas 1, Mayowa Johnson Fasona 2
1Department of Geography, Ahmadu Bello University, Zaria, Nigeria
2Department of Geography, University of Lagos, Nigeria
Correspondence to: Idowu Innocent Abbas , Department of Geography, Ahmadu Bello University, Zaria, Nigeria.
| Email: |  |
Copyright © 2012 Scientific & Academic Publishing. All Rights Reserved.
This study looked at the perception of the people of the Niger Delta on the issue of land use-land cover changes and degradation that has been reported by several scholars to be wide spread in the study area as a result of anthropogenic factors and climate change. As a result of this, the study therefore used questionnaire and personal observation to investigate what the people thought about the land use-land cover changes, degradation, its causes, implications and how they are coping with it. It was found out that degradation such as erosion, flooding, saline water intrusion, devegetation, toxicity, subsidence, badlands, oil spillage and oil pollution were prevalent in the area. It was also discovered that the people were highly vulnerable as a result of poor coping strategies to the degradation and little or no assistance from the concerned authorities and multi nationals.
Keywords: Perception, Degradation, Land use-Land Cover, Implications
Article Outline
1. Introduction
- The increasing concern for the management of natural resources has been necessitated by the increasing demand for wealth and demographic pressures resulting in serious environmental stress and ecological instability. In the last 300 years, the impacts of land use-land cover changes (LULCC) have assumed dimension of significant proportions[1]. These impacts and changes have been found to be more profound in the developing countries, due to the high population growth rate and the subsequent resource over-exploitation. As a result of poverty, people are forced to overexploit resources such as fisheries, forests and water in other to survive. The impacts of these environmental problems are serious both in the short and in the long term. In the short term food security, human vulnerability to hazards, health and safety are adversely affected; in the longer term the viability of the earth as a whole is being threatened[1]. The environment is so valuable and the inhabitants so precious that the future needs not be left to chance hence the need for regular auditing. LULCC is driven by set of proximate and underlying factor elements central to environmental processes, change and management through their influence on biodiversity, heat and moisture budgets, trace gas emissions, carbon cycling, livelihoods and a wide range of socio-economic and ecological processes[2]. The proximate causes of land use- land cover changes (LULCC) explain how and why local land cover and ecosystem processes are modified directly by anthropogenic factors, while underlying causes explain the broader context and fundamental forces underpinning these local actions. In general, proximate causes operate at the local level (individual farms, households, or communities) and underlying causes originate from regional (districts, provinces, or country) or even global levels, though complex interplays between these levels of organization are common. Studying land use dynamics is essential for the understanding of various ecological and developmental consequences of LULCC over a space of time. This makes land use mapping and change detection relevant inputs into decision-making for implementing appropriate policy responses[2].LULCC detection allows for the identification of major processes of change and, by inference, the characterization of land use dynamics. The reason for such consequence is as a result of over-dependence on primary resources with direct effect on biodiversity; land use and land cover dynamics, terrestrial ecosystem and climate (atmospheric composition, vegetation, temperature changes and occurrence of extreme climatic events). With rapid urbanization and a finite land area, the available land per individual is shrinking on a daily basis. This calls for an urgent need for proper geo- management of land that is dependent upon the availability of a detailed, accurate and up-to-date data.LULCC is central to environmental processes, environmental change and environmental management through its influence on biodiversity, water budget, trace gas emissions, carbon cycling, livelihoods[3], and on a wide range of socio-economic and ecological processes[4] which on the aggregate affect global environmental change and the biosphere. LULCC also plays important role in detecting emerging spatial patterns and the direction of land degradation, land fragmentation, decline of agricultural productivity, rural poverty and depopulation and environmentally-induced migration of people[3].Land degradation is an integral part of environmental change process on land which leads to loss of valuable land resources. It also indicates a reduction in the resource potential of a land through the actions of those processes that may force the conditions of the land to become unpleasant and less useful to man. Such processes include water erosion, wind erosion, flood hazard, drought and desertification, devegetation, salinization, alkalization, loss of fertility, long term reduction in diversity of natural vegetation, reservoir sedimentation, toxicity hazards, moisture stress, pollution, saline intrusion, subsidence, and permanent inundation of land among others[5]. These processes cause degradation of ecosystems services, reduction in the stability and resilience of the ecosystems, reduction in biological productivity potentials and ability of the land to withstand further disturbances, and impairment of ability to support human population and biodiversity. Land degradation resulting from unsustainable land use practices increases the disaster susceptibility of an area, and by implication the risk of the people living in such vulnerable areas[6].Several scholars have established the fact that land use-land cover changes and degradation are widespread in the study area. Such scholars include[7; 8; 9; 10; 11; 12; 13; 14; 15; 16; and 17]. As a result, the researcher decided to investigate the perception of the inhabitants of the Niger Delta to this serious issue of land use-land cover changes and degradation using questionnaire and field observation. This will in turn help planners in solving the problem in such a way that the inhabitants will be carried along.
1.1. The Study Area
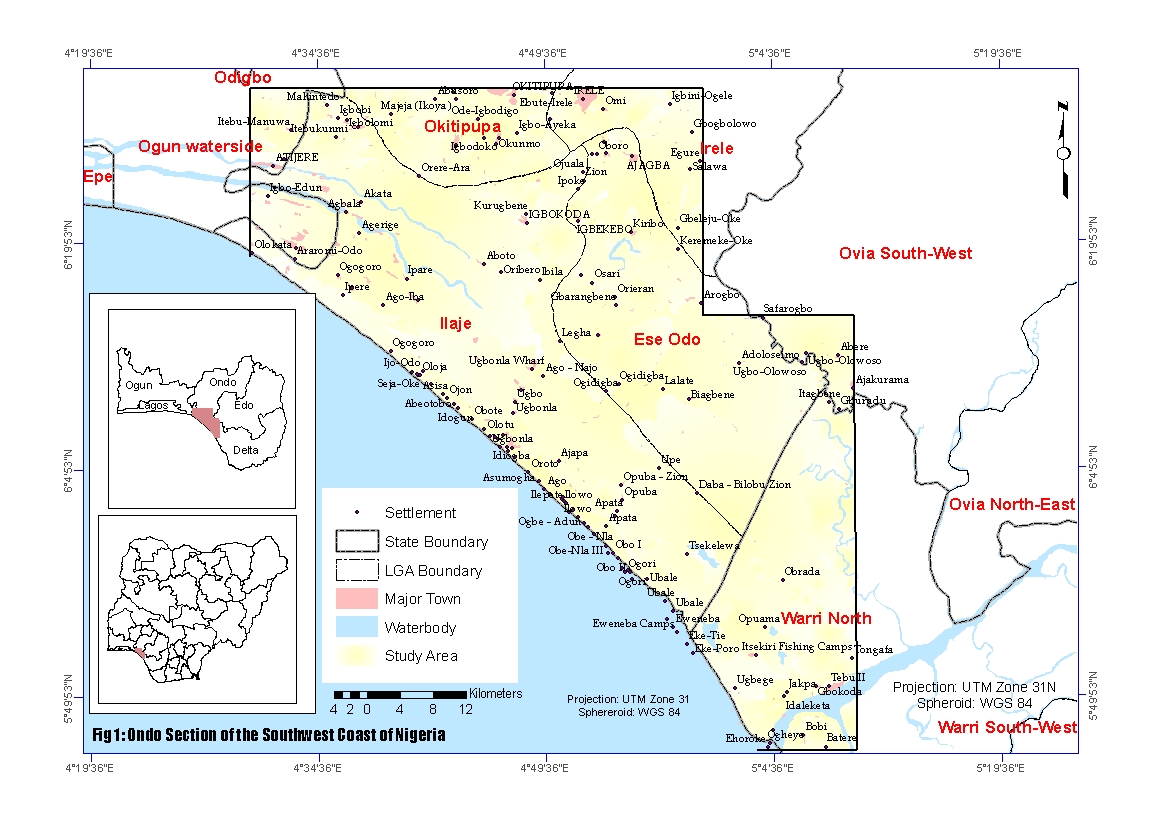 | Figure 1. Transgressive Mahin Coast |
2. Materials and Method
- Data on the perspective of the inhabitants of the Mahin coastal area on the implications of LULCC (land degradation and vulnerability) was sourced through the use of questionnaire. The questionnaire contains fifteen (15) open and close ended questions that asked about thesocio-economic characteristics of the population, the impacts of LULCC (hazards) on livelihood; and the peoples’ vulnerability and coping strategies to these hazards. However, only the relevant questions to the study were analyzed. One thousand five hundred and sixty (1560) questionnaires were administered to the inhabitants of the area. Firstly, Stratified sampling technique was used to divide the study area into three strata. The first stratum (Stratum A) involved settlements within 0 to 15km from the coast that is densely populated with high rate of LULCC. The second stratum (Stratum B) consists of settlements within 15 to 30km from the coast that is sparsely populated due to the forest reserves and also of less LULCC. The third and the last stratum (Stratum C) contained settlements within 30 to 50km from the coast because the population is equally high due to availability of land for farming activities and also of high LULCC. 725 questionnaires were given to people in stratum A and 700 returned, 315 questionnaires were administered to people in stratum B with 300 returned while 520 questionnaires were administered to people in stratum C and 500 returned. In all, a total of one thousand five hundred (1500) questionnaires constituting 0.003% of the population of the area were returned and analyzed.The settlements selected from each stratum were selected by purposive sampling technique while the respondents were selected by accidental sampling technique. The justification for the use of 0.003% of the population and the use of the different sampling techniques was based on the nature of the terrain (creeks and lagoons); dispersed settlement pattern; inaccessibility of a large part of the study area by road and most importantly availability and the need to capture as much data as possible. The collected questionnaires were analyzed using descriptive statistics.
3. Results and Discussion
- The perception of respondents to the questionnaire administered to them and the observation of the researcher in the field is as presented. Descriptive analysis is the basis for the questionnaire analysis.
|
|
|
|
|
|
|
|
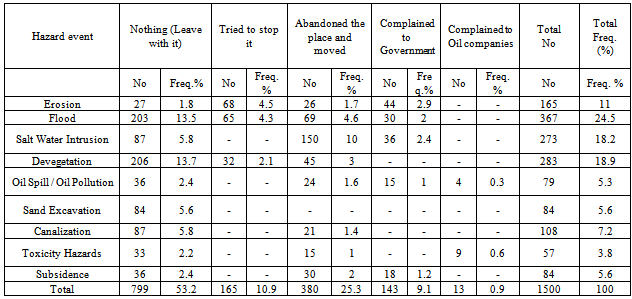
3.1. Coping Strategies to Hazards
- The response to coping strategies to the hazards by the people of the study area is as shown in table 9.Table 9 reveals that for erosion, 1.8% of the respondents reported that they did nothing since they were not empowered, 4.5% said they tried to stop it in their own way,1.7% said they abandoned the place and moved to new land while 2.9% complained to the government. In the case of flood, 13.5% did nothing, 4.3% tried to stop it, 4.6% abandoned the place and moved to new area and 2% complained to the government. For saltwater intrusion, 5.8% did nothing while 10% abandoned the place and moved to new lands while 10% complained to the government.When devegetation happened, 13.7% did nothing, 2.1% tried to stop while 3%, abandoned the place and moved to new lands. For oil spill / oil pollution, 2.4% did nothing, 1.6% abandoned the place and moved to new lands while 1% complained to the government. In respect of sand excavation for oil drilling, 5.6% did nothing. In the case of canalization, 5.8% did nothing while 1.4% said they reported the incidence to the government. For toxicity hazards, 2.2% did nothing, 2% abandoned the place for new lands while 1.2% reported to the government. During subsidence, 4.4% did nothing. From the above it is very obvious that the adaptive and coping capacity of the inhabitants of the study area to the various hazards was very low.In summary, from the questionnaire analysis, it is obvious that the inhabitants were exposed to several land degradation hazards as a result of land use land cover changesnecessitated mainly by the activities of the oilexploration/exploitation in the study area, developmental projects and climate change effects. It is also worth noting that as a result of the numerous types of land degradation the inhabitants faced grave challenges of threat to their means of livelihood especially with very low adaptive/coping capacity.
3.2. External Assistance
- The source of assistance to the people of the study area as contained in their responses is as shown in table 10.
| |||||||||||||||||||||||||||||||||||||||||||||||
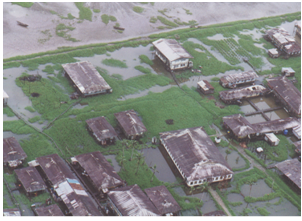 | Figure 2. Flooding of Aiyetoro community along the Transgressive Mahincoast |
4. Conclusions
- The problem of LULCC leading to land degradation and human vulnerability were as a result of anthropogenic factors especially oil exploration and exploitation activities in the study area. It is also observed that the various developmental projects by the Niger Delta development Commission and other agencies such as Ondo State Oil Producing Area development Commission had also contributed to the degradation witnessed in the study area as a result of poor planning and non-completion of projects. It is also note stating that the effects of climate change were visible in the study area. The implications of the degradation as expressed by the people were really biting hard and there is an urgent need by the government and all concerned to do something to stem the conditions of the people before a serious disaster is witnessed in the study area.
References
| [1] | Briassoullis, H,Analysis of Land Use Change: Perspectives, Theoretical and Modeling Approaches, Earths- Can Publication Ltd, London www.idosi.org/aejsr/1 (1)06/7, 1999 |
| [2] | Fasona, M. J and Omojola A.S, Climate Change, Human Security AndCommunal Clashes in Nigeria,Proceedings of the InternationalWorkshop on Human Security and Climate Change, Holmen Fjord Hotel, Asker, near Oslo, 22-23 June 2005,www.cicero.uio.no/humsec/papers/Fasona&Omojola.pdf |
| [3] | Verburg, P.H; Chen, Y; Soepboer, W and Veldkamp, T.A, GIS-based modeling of human- environment interactions for natural resource management Applications in Asia, Proceedings of the 4th International Conference on Integrating GIS and Environmental Modeling: Problems, Prospect and Research Needs, Banff, Alberta, Canada, 2000 |
| [4] | Desanker, P.V; Frost, P.G.I; Justice, C.O and Scholes, R.J,TheMiombo Network: Frameworks for a terrestrial transect study of land use and land Cover change in the Miombo ecosystems of Central Africa. IGBP Report41, pp109. www.geo.ucl.ac.be/LUCC/data/miombo, 1997 |
| [5] | Abdukadir, A, Remote Sensing and Land Degradation. Nigerian Journal of Remote Sensing, Vol. 1(1), pp 65-72, 1993 |
| [6] | Verstappen, H.T, Environmental Hazards and the Use of Satellite Remote Sensing for Sustainable Development, Adeniyi, P.O (ed): Geo-informalion Technology Applications for Resource & Environmental Management in Africa, AARSE, 57-64p, 1999 |
| [7] | Fasona, M.J, Coastal Flooding Risk and Community Adaptive Strategies in the Western Niger Delta, Journal of Environment and Behavior, Vol 1 pp56-62, 2003 |
| [8] | Fasona, M.J, Land Degradation and Environmental Change in Ondo State, South-West, Nigeria, An (unpl) PhD thesis, University of Lagos, 2007 |
| [9] | Abbas, I.I, An assessment of land use-land cover changes and their Implications on land resources and livelihood in the Mahin area of the Niger Delta region Nigeria, An (unpl) PhD thesis, Ahmadu Bello University, Zaria, 2011 |
| [10] | UNDP, Niger Delta Human Development Report, pp 229, 2006 |
| [11] | Spiff, A.I and Horsfall, M. Jnr, Trace Metal Concentration in Inter-Tidal flat Sediments of the Upper New Calabar River in the Niger Delta area of Nigeria, Sciential Africana, 3, 19-28, 2004 |
| [12] | Otukunefor, T.V and Biukwu, C.O, Impact of Refinery Influent on Physico-Chemical Properties of a water body on The Niger-Delta, Journal of Applied Ecology and Environmental Research 3(1), pp61-72, 2005 |
| [13] | Orubu, C.O, Petroleum-Induced Environmental Diseconomies and Sustainable Development, In: The Petroleum Industry, the economy and the Niger-Delta Environment, (eds), Orubu, C.O; Ogisi, D.O and Okoh, R.N, pp 17-31, 2002a |
| [14] | Omo- Irabor, O.O and Oduyemi, K, A hybrid Image Classification Approach for the systematic analysis of landcover (LC) changes in the Niger Delta region, Department of Built and Natural Environment, School of Contemporary sciences, University of Abertay, Scotland, 2007 |
| [15] | Oluwole, A.F; Olaniyi, H.B; Akeredolu, F.A; Ogunsola, O. J and Obioh, I.B, Impact of the Petroleum Industry on Air Quality in Nigeria, Paper Presented at the 8th Biennial International seminar on the Petroleum Industry and the Environment, Portharcourt, pp 17-21, November, 1996 |
| [16] | Nwokedi, M,Environmental Sensitivity Index Mapping of Areas around the ForcadosRiver, AnM.Sc thesis (unpl), Department of Geography, University of Lagos, 1999 |
| [17] | Olobaniyi, S.B and Efe, S.I, Comparative Assessment of rainwater and ground water quality in an oil producing area of Nigeria: Environmental and Health Implications, Journal of Environmental Health and Research, (6)2: 111- 118, 2007 |
| [18] | Awosika, L.F., Osuntogun, N.C., Oyewo, E.O. and Awobamise, A, Development and Protection of the Coastal and Marine Environment in Sub sahara Africa: Report of the Nigerian Integrated Problem Analysis on Development and Protection of the Coastal and Marine Environment in Sub-Saharan Africa 15, 16 pp, 2001. |