-
Paper Information
- Next Paper
- Previous Paper
- Paper Submission
-
Journal Information
- About This Journal
- Editorial Board
- Current Issue
- Archive
- Author Guidelines
- Contact Us
Marine Science
p-ISSN: 2163-2421 e-ISSN: 2163-243X
2012; 2(5): 77-84
doi: 10.5923/j.ms.20120205.06
Aerosol, Ozone and Water Vapour Distributions Observed over Land and Sea Regions during INDOEX Field Phases
 Abstract
 Reference
 Full-Text PDF
 Full-Text HTML
P. C. S. Devara , Y. Jaya Rao , K. K. Dani , R. S. Maheskumar , S. K. Saha , P. E. Raj , S. M. Sonbawne
Indian Institute of Tropical Meteorology, Dr. Homi Bhabha Road, Pune, 411 008, India
Correspondence to: P. C. S. Devara , Indian Institute of Tropical Meteorology, Dr. Homi Bhabha Road, Pune, 411 008, India.
| Email: |  |
Copyright © 2012 Scientific & Academic Publishing. All Rights Reserved.
Extensive land- and ocean-based experiments involving active and passive remote sensing of aerosols and minor constituents have been conducted simultaneously over Pune and over the Indian Ocean and Arabian Sea during the INDian Ocean EXperiment (INDOEX) field phases with an aim to study the interface between the polluted continental air-mass and pristine marine air-mass, and the underlying circulation and Inter Tropical Convergence Zone (ITCZ) phenomena, which mixes the polluted air mass from Northern hemisphere with the pristine air mass from the Southern hemisphere. In this communication, we report some important findings of the special observational programs which were carried out during the First Field Phase (FFP) i.e. from 17 February to 31 March 1998 and Intense Field Phase (IFP) i.e. from 1 January to 31 March 1999 of the INDOEX. These programs involve synchronous measurements of aerosol, ozone and precipitable water vapor using ground-based lidar, sunphotometer / spectroradiometer and ozone / water vapor monitor at the Indian Institute of Tropical Meteorology (IITM), Pune, India, and aerosol characterization over the Indian Ocean and Arabian Sea utilizing a multi-channel solar radiometer installed onboard Ocean Research Vessel (ORV) Sagar Kanya ship. Besides significant deviations between aerosol features over the land and oceanic regions, the lidar derived aerosol column content (ACC) in the boundary layer, and radiometer derived height-integrated aerosol optical depth (AOD) show significant trend and characteristic changes in aerosol size distribution over land during both FFP and IFP. Moreover, the IFP measurements indicate higher aerosol extinction (particularly in the initial period) as compared to those of FFP. On some experimental days, the land AODs appear to be of the magnitude similar to those of marine AODs observed close to the Indian subcontinent and adjoining South Asian regions. The variations in AOD over land also show an association with those observed over ocean, particularly near the coast. Besides an increasing trend in total column ozone throughout the IFP, it exhibits a specific relationship with those observed in AOD and water vapor over land. Comparison between the boundary layer and total column AODs reveals that the observed increasing trend in AOD is not confined to the boundary layer alone but extends to higher altitudes with significant contribution from the former to the latter.
Keywords: Indian Ocean Experiment, Aerosol Optical Depth, Indian Ocean and Arabian Sea
Article Outline
1. Introduction
- It is evident from the literature that marine aerosol characteristics undergo drastic changes when continental air advects over ocean water, particularly in the ITCZ region, and space-time gradients in aerosol parameters play significant roles in radiative forcing assessment[1]. The prediction estimates of aerosol forcing are highly uncertain because of many unknown properties of aerosols including their natural variability over the land and oceanic regions[2]. This is found to be largely due to incomplete knowledge onaerosol optical, physico-chemical properties, their transformation and transport processes[3]. Moreover, aerosols are expected to have larger effect in reducing the solar radiation over the tropical and sub-tropical oceans because of the proximity of these oceans to equatorial forests and arid regions[4]. The land aerosols, particularly in the boundary layer, are produced due to a variety of natural and anthropogenic processes. Although the precursor gases responsible for tropospheric aerosols are produced from the surface, they do not form aerosols within the boundary layer. Hence the boundary layer aerosol system is different from that of the troposphere, which implies that the processes responsible for changes in aerosol characteristics in these two regions are quite different. Advection of such continental aerosols over oceanic environment can cause large-scale climate perturbations[5] particularly due to the presence of ITCZ which mixes the polluted Northern hemispheric air-mass with pristine Southern hemispheric air-mass vigorously. With this main objective of assessing climate forcing due to aerosols and precursor gases of natural and anthropogenic origin, an integrated observational program, namely, INDOEX has been launched[6-7] and some pilot experiments have been conducted during 1996 and 1997. The FFP98 involving several coordinated scientific experiments from different platforms (ground-based, ship-borne, air-borne and satellite-borne) were conducted by the scientists from India, USA and Europe during February-April 1998[8]. By following the experience and outcome of this multi-institutional experiment, an intense field observational program (IFP) has been organized from the middle of winter 1998/99 till the beginning of pre-monsoon 1999 (IFP99). Some of the results obtained from the pre-, FFP and IFP-INDOEX have been published in three special issues[9-11]. The observations of aerosol distributions over land in conjunction with those over the oceanic regions are essential and such observations will greatly help in understanding the nature and extent of mixing of continental polluted air with pristine maritime air[12]. As part of these observational programs, aerosol optical and micro-physical measurements using land-based lidar and solar radiometers have been made at the Indian Institute of Tropical Meteorology (IITM), Pune (18o 32' N, 73o 51' E, 559 m AMSL), India in synchronization with such measurements made onboard ORV Sagar Kanya over the Arabian Sea and Indian Ocean during the above two filed phases. The present paper reports results of these measurements. The above special issues did not cover such studies.The continental site (Pune) is about 100 km inland from west coast of India and is located on the lee-side of the Western Ghats. The airflow in the lower troposphere over the station is predominantly westerly during the south-west monsoon season (June-September) but the westerlies become weak in September and easterly flow sets in from October onwards. Moreover, aerosols over Pune exhibit unique features during winter months (coincide with the observational periods of the present study) due to frequent low-level inversions caused close-to-ground haze formation and poor visibility. Rapid fall in daily temperature, light surface winds, low relative humidity and incursion of aerosol particles and precursor gases due to combustion activities at this station during these months make the study of aerosols more important and interesting from the point of view of their generation, growth and transport processes.The observations over the land region at Pune where low-level winds are predominantly from north-east direction and air-mass rich in nuclei of continental origin passes over the station during this period provided an additional opportunity to study the transport of aerosols and their precursor gases from continents to ocean surface. In this paper, we present the results obtained from the above measurements made simultaneously over land and oceanic environment, and discuss their inter-relationships during the FFP98 and IFP99 of the INDOEX.
2. Experimental Facilities Deployed
- A suit of instruments that were operated from different platforms in the study consists of a land-based lidar, high spectral resolution radiometer (HSRR) or spectroradiometer, and two hand-held solar radiometers (Microtops II), and a ship-based compact multi-channel solar radiometer (MSR). The experiments were performed during 17 February-31 March 1998 and 1 January-31 March 1999. The chief characteristics of the lidar system are presented in Table 1. The lidar system employed for obtaining vertical (surface to about 7 km above ground level) distributions of aerosol number density during late evening period, composed of a tunable Argon ion laser as transmitter and a 250-mm Newtonian telescope tailored with intermediate optics, detection and data acquisition systems as receiver. The transmitter and receiver are coaxially separated by a distance of about 60 m in order to operate the system in bi-static mode, the unique configuration that provides angular distribution of scattered intensity for obtaining aerosol size distribution. The on-line control and digital data logger provides real-time system parameters settings, data acquisition, analysis and display of lidar data. The main parameters of the land- and ship-based solar radiometers are presented in Table 2. Of the two land-based radiometers (Microtops II), first one provides height-integrated aerosol optical depth (AOD) at six discrete wavelengths covering from ultra-violet to near-infrared and hence size distribution, the second one determines total column ozone (TCO) and precipitable water content (PWC) simultaneously. The third one is High Spectral Resolution Radiometer (HSRR) which provides AOD throughout the photo-synthetically active region (PAR) of 0.4-0.7 μm. Multi-spectral AOD measurements have been performed onboard ORV Sagar Kanya using a filter-wheel based Multi-Spectral Radiometer (MSR) operating in 13 channels, covering narrow-band wavelengths from 0.31 to 1.63 μm. Calibration of these radiometers was performed by a transfer of calibration constants from reference instruments, which were calibrated by the Langley plot technique at a noise-free high-altitude site. Apart from this, continuous monitoring of radiometer output at zero air mass i.e. Y-axis intercept in the Langley plot (extra-terrestrial constant), which serves as calibration constant for each channel, and also inter-instrumental comparison of AOD has been carried out periodically to ensure the stability and reliability of AOD, TCO and PWC. Moreover, the AODs derived from the lidar and radiometers have been also inter- compared before the deployment of MSR for marine observations during the IFP99. More details about the lidar system[13-14] and solar radiometers used in the present study can be found in Devara[15]; Devara et al.[16-17]; Morys et al.[18]; Ichoku et al. [19]. These measurements were made along the cruise path which covered the latitude belt between 17oN and 20oS and longitude belt between 71oE and 59oE, encompassing the Indian Ocean and Arabian Sea within these spatial belts.
|
3. Analysis of Data
- The normalized scattered signal strength profiles obtained by operating the lidar system with its vertically transmitted laser beam (at λ = 0.5145 μm) and angular scattering of the receiver in vertical plane have been converted into aerosol number density profiles by following the inversion method described elsewhere[19-22]. The size and refractive indices of aerosols over the observing station have been estimated simultaneously by applying the inversion by iteration method to the bi-static lidar angular scattering measurements in the surface layer[23-24] and are utilized in the retrieval method for computing aerosol number density profiles from the scattered intensity profiles. Considering overall efficiency involved in system parameters and assumptions made in the inversion technique, the net error in the estimation of aerosol concentration at each altitude is found to be less than 10 per cent. The lidar observations were obtained on 25 days during the FFP98 and on 55 days during the IFP99. Concurrent HSRR and MSR observations have been obtained on 21 clear-sky days during FFP98, and HSRR and sunphotometer-ozone / water vapour observations have been obtained on 46 clear-sky days during the IFP99. During this period of IFP, the MSR has been operated onboard ORV Sagar Kanya and AOD data over the Arabian Sea and Indian Ocean were collected on 20 days. The radiometers used in the present observational program basically measure the spectral variation of solar irradiance at different solar zenith angles (air-mass). The analysis procedure for such data to derive AOD has been published elsewhere[16]. The overall error in the AOD can be due to (i) diffuse radiation entering the optical channel, (ii) computation of relative air mass, (iii) deviation of calibration of constant with time and (iv) uncertainty in AOD due to Rayleigh scattering and absorption by O3 and NO2. It has been shown[25] that for moderately turbid atmosphere the diffuse radiation entering into the optics would be less than 3% of the direct radiation for a FOV of 2.5o. The combined error in the estimated AOD due to all the above errors varies from 2 to 10 per cent. The TCO was estimated from the measurement of optical depth at two wavelengths in the UV region (0.3000 and 0.3500 μm). The measurement at additional wavelength (0.3125 μm) provides correction for particulate scattering and stray light. The PWC was determined from the measurements made at 0.940 μm (H2O absorption peak) and at 1.020 μm (no absorption by water vapor) by following the Differential Optical Absorption and Scattering (DOAS) methods[18]. The aerosol number density profile obtained with lidar on each experimental day between 50 m and about 3000 m (in height steps of 12 and resolution of 10 m to 100 m) altitudes, and the aerosol concentration up to the boundary layer altitude has been converted into boundary layer AOD (LAOD) by using Mie aerosol extinction cross-section values computed at the Argon ion laser wavelength of 0.5145 μm and for the size and refractive indices of aerosols[19,26-28] present over the experimental station. The corresponding radiometer derived AOD at 0.5 μm wavelength observed on each experimental day is denoted by RAOD. The difference and ratio between RAOD and LAOD have also been evaluated on each day of observation to estimate the free-tropospheric AOD (assuming negligible contribution from stratospheric aerosols during quiescent conditions at the experimental site) and also to examine the contribution of boundary layer AOD to total column AOD.
4. Discussion of Results
- The possible aerosol type present over Pune is a mixture of water-soluble, dust-like and soot-like aerosols[29]. The major source of aerosols over Pune is soil-dust carried by winds. Aerosols in the accumulation-mode are formed by gas-to-particle conversion processes from the land surface whereas coarse-mode aerosols are attributed mainly to wind-blown dust[30-33]. Normally the land-sea breeze effects are not seen on aerosol conditions over Pune as it is more than 100 km away from the sea coast. However, such effects can possibly influence the long-range transport of aerosols between land and oceanic regions. The main features of land-based lidar derived ACC and LAOD (up to 1100 m) and radiometer observed AOD (total column up to 50 km) during the FFP are presented in the following sections. The features of ACC and AOD over land and their association with those measured during the same period over Arabian Sea and Indian Ocean during the IFP together with co-variations between AOD, TCO and PWC observed over land during this period are also presented and discussed in the sections to follow.
4.1. Day-to-day Variations in ACC and AOD
- Figure 1 (a & b) displays the daily variations in lidar-derived ACC and radiometer estimated AOD at common wavelength of 0.5 μm during FFP and IFP. The variations are found to be significant and they exhibit an increasing short-term trend in both field phases which may mainly arise from meteorological conditions prevailing over the station. The increase in observed aerosol loading is expected as the air-mass undergoes considerable changes from winter to pre-monsoon months in addition to the frequent haze layer formations over the station during winter[24] and hence it is consistent. An interesting and important feature is that although the variations in ACC and AOD are more or less similar, their magnitudes during IFP appear to be higher (particularly in the initial period) as compared to those observed during FFP, which is attributed to relatively more convection noticed during the study period over the station. The decreasing trend in ACC, which has direct bearing on air-mass characteristics in the lower altitude region, could be due to less frequency of occurrence of haze layer formations during the study period.The daily variation of lidar-estimated boundary layer and total column AODs and the contribution of the former to the latter are shown plotted in Figure 2 (a & b) for FFP and in Figure 3 (a & b) for IFP. The panel ‘a’ depicts essentially the variations in lidar-derived boundary layer aerosol optical depth (LAOD) and radiometer-observed total column aerosol optical depth (RAOD) while the panel ‘b’ displays such variations in difference and ratio between these optical depths which represent fairly the free tropospheric optical depth and contribution of boundary layer aerosols (indicator of surface generated precursor gases due to human activities) to the total optical depth. These figures clearly show a close correspondence between the variations in LAOD and RAOD during both FFP and IFP. They also indicate that the trend of variation in AOD is not confined only to the boundary layer but also to the air layer aloft up to stratospheric altitudes. In addition, the contribution of LAOD to RAOD is found to be about 20 per cent in both field phases.
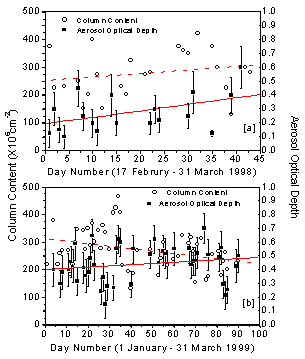 | Figure 1. Day-to-day variations in ACC and AOD during (a) FFP98 and (b) IFP99. Dashed and continuous lines represent short-term trends in ACC and AOD, respectively. Vertical bars indicate standard deviation from mean in RAOD . Trend line slope 1.27(± 1.27) and intercept 255.42(±31.88) in ACC; slope 0.005(±0.003) and intercept 0.18(±0.05) in RAOD during the FFP-1998. Trend line slope -0.91(±0.35) and intercept 312.43(±18.2) in ACC; slope 0.0008(±0.0007) and intercept 0.406(±0.036) in RAOD during IFP-1999 |
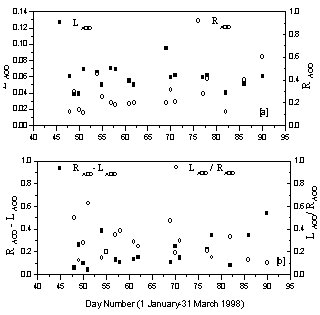 | Figure 2. Variations in boundary layer optical depth (LAOD) and total column optical depth (RAOD) and their relative contributions observed during 17 February through 31 March 1998 |
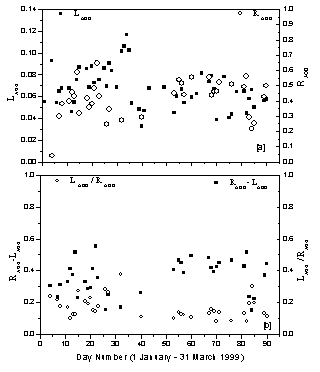 | Figure 3. Variations in boundary layer optical depth (LAOD) and total column optical depth (RAOD) and their relative contributions observed during 1 January through 31 March 1999 |
4.2. Air Mass Back-trajectories
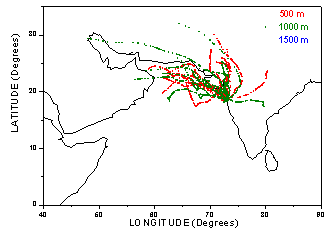 | Figure 4. Three-day back trajectories at three height levels (500, 1000, 1500 m) for the period from 17 February to 31 March 1998 |
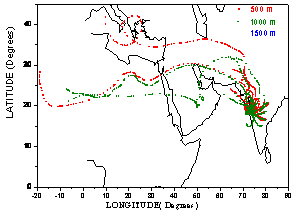 | Figure 5. Three-day back trajectories at three height levels (500, 1000, 1500 m) for the period from 1 January to 31 March 1999 |
4.3. Association Amongst AOD, TCO and PWC during IFP
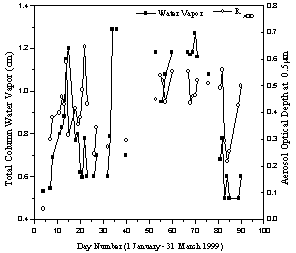 | Figure 6. Correspondence between total column aerosol optical depth and precipitable water content observed during 1 January through 31 March 1999 |
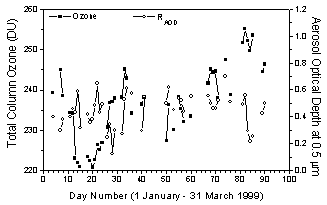 | Figure 7. Correspondence between total column aerosol optical depth and Ozone observed during 01 January through 31 March 1999 |
4.4. Interface between Marine and Land AODs
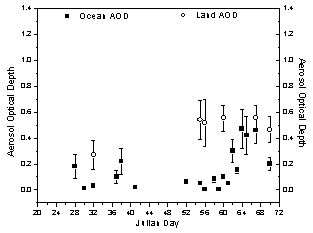 | Figure 8. Correspondence between the AODs observed over land and ocean during the study period |
5. Summary and Conclusions
- The results of the analysis of aerosol optical properties measured, concurrently over Pune (land) and Indian Ocean and Arabian Sea (ocean), as part of the INDOEX field phases (both FFP and IFP) during 1998 and 1999 have suggested the following.• The IFP99 measurements indicate greater aerosol extinction (optical depth) as compared to those of FFP98. • On some specific experimental days, the land AODs seem to be of the magnitude, more or less, similar to that of marine AODs.• The variations in AOD over land also showed association with those observed over ocean, especially near the coast.• Apart from an increasing trend in total column ozone throughout the IFP99, it exhibits almost an opposite relationship with those observed in AOD over land.• Comparison between the boundary-layer AODs and total column AODs reveals that observed increasing trend is not only confined to the boundary-layer but extends up to higher altitudes with significant contribution from the former to the latter.• AODs exhibited increasing trend during both the phases while the ACC showed opposite trend during the FFP98 and IFP99 over land, which is ascribed to be due to prevailing meteorological conditions and associated long-range transport of pollutants over the experimental site.• Considering the air mass trajectories, type and residence time of aerosols, the present results may consequently be important in determining climate changes in the land-ocean-atmosphere coupled system.
ACKNOWLEDGEMENTS
- The authors are highly grateful to the anonymous Reviewers for their valuable comments/suggestions on the original paper. The work reported here is a part of the INDOEX-India program supported by Department of Space (DOS), Council of Scientific and Industrial Research (CSIR), Department of Ocean Development (DOD), Department of Science and Technology (DST) and Department of Electronics (DOE), with DOS as the nodal agency. The experiments performed with Sagar Kanya were possible essentially because of the support in terms of providing the ship and necessary help by the Antarctic Study Centre of DOD. In this context, efforts put in by National Institute of Oceanography (NIO) are also thankfully acknowledged. Thanks are also due to Director, IITM for infrastructural support.
References
| [1] | Charlson, R.J., Heigeintzenberg, J. (Eds.), “Dahlem Workshop report on Aerosol Forcing of Climate”, John Wiley, New York, pp. 416, 1995. |
| [2] | Mischenko, M.I., A.A. Lacis, B.E. Charlson, L.D. Travis, “Non-sphericity of dust-like tropospheric aerosols: Implications for aerosol remote sensing and climate modeling”, Geophysical Research Letters, 22, 1077-1080, 1995. |
| [3] | Welton, E.J., K.J. Voss, P.K. Quinn, P.J. Flatau, K. Markowicz, J.R. Campbell, J.D. Spinhirne, H.R. Gordon, J.E. Johnson, “Measurements of aerosol vertical profiles and optical properties during INDOEX 1999 using micro-pulse lidars”, Journal Geophysical Research, 107, 8019-8039, doi:10.1029/2000JD000038, 2002. |
| [4] | Prospero, J.M., “Mineral and sea salt aerosol concentrations in various ocean regions”, Journal of Geophysical Research, 84, 725-731, 1978. |
| [5] | Charlson, R.J., S.E. Schwartz, J.M. Hales, R.D. Cess, J.A. Coakley Jr. J.E. Hansen, D.J. Hoffmann, “Climate forcing by anthropogenic aerosol”, Science, 255, 423-430, 1992. |
| [6] | Ramanathan, V., and Co-authors, “Indian Ocean Experiment (INDOEX), A multi-agency proposal for a field experiment in the Indian Ocean”, C4 Publication # 162, Scripps Institution of Oceanography, UCSD, California, pp. 1-83, 1996. |
| [7] | Mitra, A.P., “INDOEX (India): Introductory Notes”. Current Science, 76, 886-889, 1999. |
| [8] | Jayaraman, A., D. Lubin, S. Ramachandran, V. Ramanathan, E. Woodbridge, W.D. Collins, K.S. Zalpuri, “Direct observations of aerosol radiative forcing over tropical Indian Ocean during the January-February 1996 pre-INDOEX cruise”, Journal of Geophysical Research, 103 (D12), 13827-13836, 1998. |
| [9] | Journal of Geophysical Research (JGR), “Indian Ocean Experiment (INDOEX), Part I”, Special Issue, 106, D22, 2001. |
| [10] | Journal of Geophysical Research (JGR), “Indian Ocean Experiment (INDOEX), Part II”, Special Issue, 107, D19, 2002. |
| [11] | Current Science (Supplement), “Indian Ocean Experiment (INDOEX)”, 80, 2001. |
| [12] | Le´on, J.-F., P. Chazette, J. Pelon, F. Dulac, H. Ramdriamiarisoa, “Aerosol direct radiative impact over the INDOEX area based on passive and active remote sensing”, Journal of Geophysical Research, 107(D19), 8006, doi:10.1029/ 2000JD000116, 2002. |
| [13] | Devara, P.C.S., P.E. Raj, “A bistatic lidar for aerosol studies”, Institution of Electronics and Telecommunication Engineers (IETE) Technical Review, 4, 412-415, 1987. |
| [14] | Devara, P.C.S., P.E. Raj, S. Sharma, G. Pandithurai, “Real-time monitoring of atmospheric aerosols using a computer-controlled lidar”, Atmospheric Environment, 29, 2205-2215, 1995a. |
| [15] | Devara, P.C.S., “Remote sensing of atmospheric aerosols from active and passive optical techniques”, International Journal of Remote Sensing, 19, 3271-3288, 1998. |
| [16] | Devara, P.C.S., G. Pandithurai, P.E. Raj, S. Sharma, “Investigations of aerosol optical depth variations using spectroradiometer at an urban station, Pune, India”, Journal of Aerosol Science, 27, 621-632, 1996. |
| [17] | Devara, P.C.S., R.S. Maheskumar, P.E. Raj, K.K. Dani, S.M. Sonbawne, “Some features of aerosol optical depth, ozone and precipitable water content observed over land during the INDOEX-IFP99”, Meteorologische Zeirschrift, 10, 901-908, 2001. |
| [18] | Morys, M., F.M. Mims, S. Hagerup, S.E. Anderson, A. Baker, J. Kia, T. Walkup, “Design, calibration, and performance of MICROTOPS-II handheld ozone monitor and sun photometer”, Journal of Geophysical Research, 106, 14573-14582, 2001. |
| [19] | Ichoku, I., R. Levy, Y.J. Kaufman, L.A. Remer, R.R. Li, V.J. Martins, B.N. Holben, N. Abuhassan, I. Slutsker, T.F. Eck, C. Pietras, “Analysis of the performance characteristics of the five-channel Microtops II Sun photometer for measuring aerosol optical thickness and precipitable water vapor”, Journal of Geophysical Research, 107 (D13), 4179, doi:10.1029/2001JD001302, 2002. |
| [20] | Devara, P.C.S., P.E. Raj, B.S. Murthy, G. Pandithurai, S. Sharma, K.G. Vernekar, “Inter-comparison of nocturnal lower atmospheric structure observed with lidar and sodar techniques at Pune, India”, Journal of Applied Meteorology, 34, No. 6, 1375-1383, 1995b. |
| [21] | Devara, P.C.S., P.E. Raj, G. Pandithurai, “Aerosol profile measurements in the lower troposphere using four-wavelength bistatic Argon-ion lidar”, Applied Optics, 34, 4416-4425, 1995c. |
| [22] | Devara, P.C.S., R.S. Maheskumar, P.E. Raj, G. Pandithurai, K.K. Dani, “Recent trends in aerosol climatology and air pollution as inferred from multi-year lidar observations over a tropical urban station”, International Journal of Climatology, 22, 435-449, 2002. |
| [23] | Raj, P.E., P.C.S. Devara, “Scattering angle distribution of laser-return signal strength in the lower atmosphere”, Journal of Aerosol Science, 26, 51-59, 1995. |
| [24] | Pandithurai, G., R.T. Pinker, P.C.S. Devara, T. Takamura K.K. Dani, “Seasonal Asymmetry in Diurnal Variation of Aerosol Optical Characteristics over Pune, Western India”, Journal of Geophysical Research, 112, doi:10.1029/2006JD007803, 2007. |
| [25] | Box, M.A. A. Deepak, “Atmospheric scattering corrections to solar radiometry”, Applied Optics, 18, 1941-1949, doi: 10.1364/AO.18.001941, 1979. |
| [26] | Raj, P.E., P.C.S. Devara, “On the stable stratification of the nocturnal lower atmosphere inferred from lidar observations over Pune, India”, Boundary-Layer Meteorology., 65, 197-205, 1993. |
| [27] | Pandithurai, G., P.C.S. Devara, P.E. Raj, S. Sharma, “Aerosol size distribution and refractive index from bistatic lidar angular scattering measurements in the surface layer”, Remote Sensing of Environment, 56, 87-96, 1996. |
| [28] | Pandithurai, G., P.C.S. Devara, P.E. Raj, S. Sharma, “Retrieval of aerosol size index from high-resolution spectroradiometer observations”, Aerosol Science and Technology, 26, 154-162, 1997. |
| [29] | Khemani, L.T., G.A. Momin, M.S. Naik, R. Vijayakumar, B.V. Ramana Murty, “Chemical composition and size distribution of atmospheric aerosols over the Deccan Plateau, India”, Tellus, 34, 151-158, 1982. |
| [30] | Khemani, L.T., “Physical and chemical characteristics of atmospheric aerosol”, In: Air Pollution Control, Vol. 2 (Edited by P.N. CHERIMISINOFF) Encyclopedia of Environmental Control Techniques, Gulf Publishing Co., USA, pp 401-452, 1989. |
| [31] | Devara, P.C.S., “Study of physico-chemical and optical properties of atmospheric constituents under different environmental and meteorological conditions in India - Part II: Trace Gases”, Indian Journal of Environmental Protection, 20, 15-22, 2000. |
| [32] | Devara, P.C.S., Pandithurai, G., Raj, P.E., Maheskumar, R.S. and Dani, K.K., “Atmospheric aerosol-cloud-stability relationship as observed with optical and radio remote sensing techniques”, Atmospheric Research, 49, 65-76, 1998. |
| [33] | Devara, P.C.S., and Raj, P.E., “Lidar measurements of aerosols in the tropical atmosphere”, Advances in Atmospheric Sciences, 10, 365-378, 1993. |