-
Paper Information
- Next Paper
- Previous Paper
- Paper Submission
-
Journal Information
- About This Journal
- Editorial Board
- Current Issue
- Archive
- Author Guidelines
- Contact Us
Marine Science
p-ISSN: 2163-2421 e-ISSN: 2163-243X
2012; 2(5): 66-76
doi: 10.5923/j.ms.20120205.05
Anthropogenic Impact on the Pulicat Lagoon Monitoring with Foraminifera, East coast of India
 Abstract
 Reference
 Full-Text PDF
 Full-Text HTML
Sundara Raja Reddy. B. C 1, Jayaraju. N. 2, Reddy. K. R 1
1Department of Geology, S.V. University, TIRUPATI, 517 502, India
2Department of Geology & Geoinformatics, Y. V. University, KADAPA, 516 003, India
Correspondence to: Sundara Raja Reddy. B. C , Department of Geology, S.V. University, TIRUPATI, 517 502, India.
| Email: |  |
Copyright © 2012 Scientific & Academic Publishing. All Rights Reserved.
Coastal lagoons are well investigated areas because of their economical and ecological importance. Pulicat Lagoon system which is a store house of all resources is under great threat following the anthropogenic pollution. This complex lagoon ecosystem’s surface area is about 500 sq.kms. In spite of the System’s conservation statutes its structure has been degenerating rapidly because of pressures fishing, tourism and agricultural activities. Fishing production of Pulicat Lagoon System is approximately 52 tons/ha/year. Although a serious fishery pressure has been determined in the area, according to mortality rate and age compositions, it has been found that the growth of marine life in the environment is in unhealthy condition. The date show that land based and atmospheric sources account about two-thirds of the total impact of contaminants in to the marine lagoon constituting 44 % and 33 % respectively. A total of 30 sediment samples were collected with in the depth zone of 5 fathoms from the lagoon. The study yielded 50 benthic foraminiferal species belongs to 24 genera, 16familys, 8 super families and 3 sub-orders. Variations are also reflected on the foraminiferal test morphology, diversity and distribution. A high percentage of foraminifers almost exclusively Ammonia have damaged shells with a few channels to entire whorl missing. The phenomenon is stress response to the anthropogenic pollution. The Ammonia-Elphidium assemblage is dominant in all stations followed by Spiroloculina –Bolivina assemblage.Suggestions for development of the lagoon management and maximum sustainable marine life production have been offered by determining the present lagoon management and some a biotic characteristics of this ecosystem. Many studies assume or conclude that foraminiferal assemblages and the frequency of deformed tests are proxy indicators of pollution, but others present confounding results. Under studying the complexity of anthropogenic pollution, coastal waters and sediment is critical to the design and interpretation of meaningful studies.
Keywords: Lake, Foraminifera, Ecology, Anthropogenic Pollution, Ecological Parameters
Article Outline
1.Introduction
- The study area, is located in the Survey of India toposheets nos: 66 B/2, 66 B/3, 66 C/2 respectively at the scale of 1: 50,000. The study area lies between longitudes 80o 02’ – 80o 20’ E and latitudes 13o22’-13o 45’ N (Fig.1). The total area of the lagoon is about 500 sq kms. The lake is marked by steeply rising ridges, having a height of about 17m from the mean sea level (MSL) and composed of Quartzites of Cuddapah Super group (Proterozoic)[1]. The steep and plain topography is due to the great difference in age between the Archean of the plain country and the Proterozoic of the high lands and also due to the greater resistance for erosionoffered by quartzites compared to gneisses. The important ephemeral rivers that join the lake include Arani and Kalangi (Fig.1)[2]. Enormous quantities of fresh water influx along with sediment loads are discharged in to the lagoon duringmonsoon. The Pulicat lake is particularly attractive small marine basin for studying the interaction between hydrography and the underlying sediment cover because of its proximity to the Bay of Bengal ,its wide water depth range its hydrography and its apparently homogenous fine grained modern sediment cover[3]. Coastal lagoons have been historically indispensable as sheltered sites of habitation providing entryway to both land and the sea. They also provide natural food resources rich in protein. Coastal lagoons are complex open systems with connection to terrestrial, atmospheric and oceanic realms. Changes in any of these adjacent systems can influence the formation and structure of the ecosystem of a lagoon[4]. Natural changes resulting from geological, physical and chemical factors influence the climatic changes which alter the character of the ecosystem. Heavy metals are elements that have an atomic weight between approximately 63 and 200. They are naturally occurring minerals that are found in some level, throughout our natural environment. Many of these metals are essential to our health and well being of the organisms that live on our planet, including our selves. However, if excess amounts of these metals are allowed to accumulate in our natural environment, the results can lead to a number of problems including sediment contamination, ecosystem contamination, a loss of aquatic life, and even severe human health effects[5]. Heavy metals can enter a water supply by industrial and consumer waste, or even from acidic rain breaking down sediment and realizing heavy metals into streams, lakes, rivers and ground water. Anthropogenic sources include surface runoff mining operations, combustion of fossil fuels that end up polluting the atmosphere with metal particulates that eventually settle to the land surface. Other sources include domestic waste water, effluent containing metals from metabolic wastes. Industrial effluents and waste sludge’s may substantially contribute to metal loadings in to the lake. Over the last few years, many studies of benthic foraminiferal assemblages have been carried out across the world in areas exposed to different kinds of marine pollution[4]. More over, because of increased knowledge of the biology of foraminifera have a great potential as indictors of pollution, there by proving one of the most sensitive and inexpensive markers of environmental stress in both in naturally and anthropogenically stressed locations[6]. Therefore it is first necessary to acquire knowledge about the anthropogenic impact on the lake system monitoring with benthic foraminifera
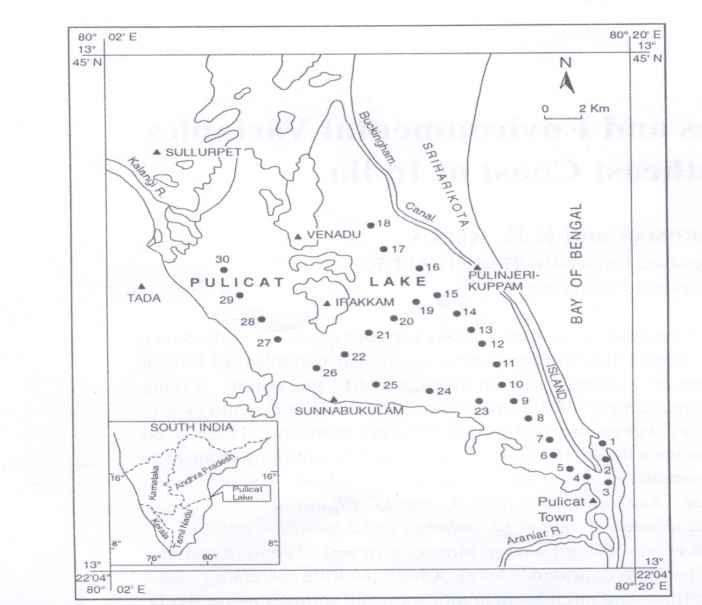 | Figure 1. Study area with sampling stations |
1.1. General Statement
- The relationship of organism with the ecosystem at and near-shore, off shore, shallower, deeper, warmer, colder, lagoonal, estuarine, backwater, tidal pools and back reef regions is a complex phenomenon for understanding the ecosystem of the individual source and its interpretation. Nevertheless, the interaction of organisms with the ecosystem can be conveniently and effectively interpreted provided the ecological factors are systematically studied.According to[7], the microfaunal crop in the Bay of Bengal is poor presumably because of low organic matter in the shelf sediments. He reasoned that the occurrence of mixed fauna by South-West monsoon drift and also the entry of Indo-Pacific fauna by North-East monsoon drift. An attempt is made to study the ecology of the area under investigation for, its variation in time and space. The variation in the water chemistry is obscured to some extent due to meteorological conditions and also the inflow of oceanic water in to the estuaries during high tides. The water transition is closely linked with tidal fluctuations in the estuaries.
2. Material and Methods
2.1. Sample Collection
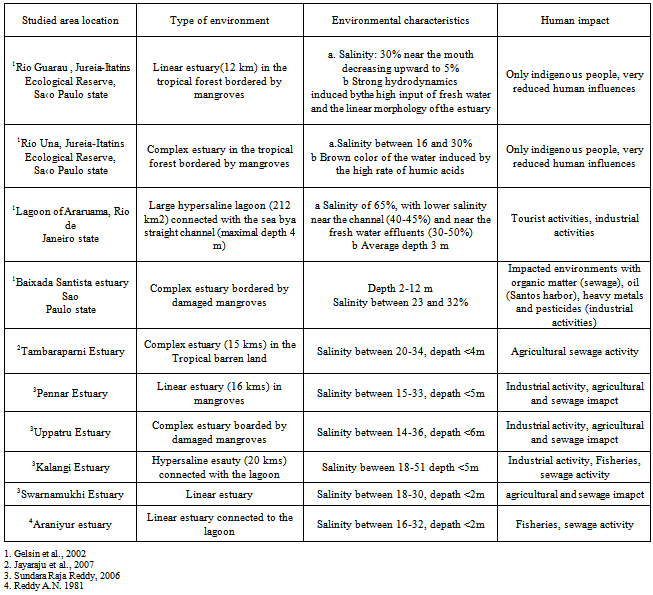
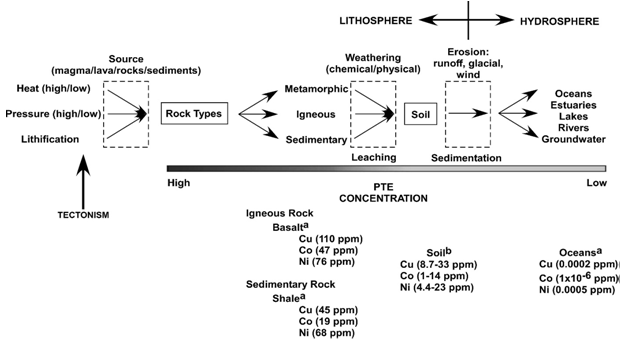
- Depending on the bottom material (sandy vs. muddy), the grabber has sampled a total of 30 samples to a depth of 1 to 4 cm into the sediment (Fig.1). Sediment samples were transferred into plastic bags and frozen until analyses were carried out. Sediment sample from this lake usually represents accumulation of the past one year, based on accumulation rates of 1 cm per year[8]. However, in regions where sediments are very thin, the age of the surface sediments is undetermined. In most of these stations the sediment cover is relatively thin, thickening near mangroves and along isolated mud banks. During collection of samples , dissolved oxygen, salinity, and temperature were recorded in situ using a Hydrolab Mini Sonde multi-probe instrument[9]. Sampling depths were estimated from a bathymetric chart based on GPS coordinates (Table 1). The bottom waters were collected by making use of shallow water sampler. The water samples were collected and stored in polyethylene bottles fitted with tight stoppers and screw caps and indexed accordingly[10]. Four paralic environment that exhibit contrasting environmental conditions of Brazilian coast and some estuaries of east coast of India have been selected for comparison ( Table.2).
|
|
2.2. Sample Processing for Foraminiferal Extraction
- All the 30 sediment samples were first washed over a sieve which is an average opening of 0.625mm. This process helps to wash the sample free of sea water, fixatives, and the fine silt and clay size sediment particles[11]. Then, the sample was air-dried and a suitable sample weighing about 100 grams was obtained by coning and quartering. Quantitatively, foraminifera could not be separated easily by using Carbon Tetra Chloride only, so a mixture of Bromoform (Specific gravity 2.8) and Acetone (Specific gravity 2.4) was used to obtain about 95% crop from the sediment[12]. The residue was examined under a stereo binocular microscope for any left out fauna. Such tests were hand- picked by a very fine pointed long haired wetted Windsor Newton Sable hair brush (“0”)[2]. The fauna, (stained and unstained) thus obtained was sorted, counted and identified under a stereo binocular microscope using medium to high magnifications (6.3×2.5: 6.3 ×4.0). The sampling procedures especially sieving and drying reduce the number of the most fragile arenaceous foraminifera. However, they are not directly comparable to studies using the >63m fraction, which is used commonly in investigations[13].
2.3. Analysis of Foraminiferal Assemblages
- The sand fractions (>63 μm) were analyzedmicroscopically for foraminiferal tests present as described by[14]. Each sample was poured into a clean petri dish and assorted thoroughly. A fine spatula was used to take a small scoop (approximately 0.1 grams) from the center of the mound, bottom up, to get an adequate representation of all grain sizes[4]. The scoop was weighed to the nearest milligram. Each sample was then examined under a conventional stereomicroscope and the foraminifers were removed using a fine artist's brush moistened with water (tip size 3/0 to 5/0). Individual specimens were placed onto a cardboard micropaleontological faunal slide, which was coated thinly with water-soluble glue[1]. This procedure was repeated until all the tests are recovered from the weighted sample and the total foraminifer assemblage was assessed. Foraminifera were identified up to generic level using characteristics defined by[15].However individuals that were largely broken (less than 50% of the test remaining) or obviously geologically reworked were not included in analyses. The composition of living assemblages solely reflects environmental conditions at that microhabitat at the time of sample collection, whereas the total assemblages integrate information about the general conditions over a longer time period[16]. Therefore, in this study, foraminifera is given weightage for comparisons between lake samples, and also to obtain correlations with ecological parameters.The raw weights for each grain-size class were converted to weight percents for each sample. Median grain size for each sample was also calculated and is represented in phi. Phi diameter is computed by taking the negative log of the diameter in millimeters.
2.4. Grain-Size Analysis
- After processing, the sediment fractions (>63 μm) were dry sieved according to methods described by[17]. The standard sieve set was secured on top of a shaker. The sub sample (3 to 20 grams) was gently disaggregated if necessary, and placed in the top, coarsest sieve. The shaker was then set to medium for a minimum of five minutes. The contents of each screen were poured onto tarred weighing paper and weighed to the nearest milligram. In determining the percent mud of each sediment sample, calculations were adjusted to account for the fraction removed in the washing step.
3. Results
3.1. Anthropogenic Pollution
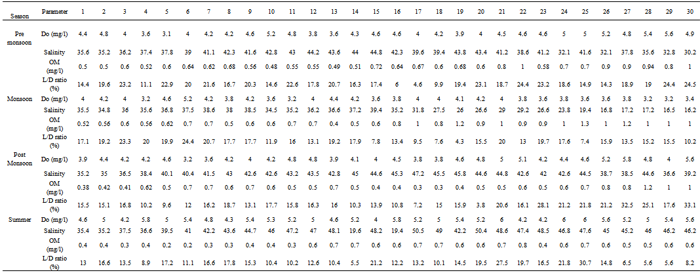
- Anthropogenic activities that change the natural flow of influx to lagoon, resulting in wiser salinity fluctuations. As a result, biological productivity increases in the surface waters and more organic matter settles on the substrate, increasing the potential for both hypoxic and anoxic zones with in a lagoon. Storms, boating activities, dredging, and any other natural or anthropogenic activities that disturb sediments can mix mobile heavy metals from hypoxic pore waters in to the water column, where the heavy metals have greater potential to impact the local biota[18]. This, monitoring and assessment of the risks to coastal ecosystems associated with heavy metal pollution are highly complex problems that require interdisciplinary teams with expertise in biology and ecology of lagoonal biotas[10]. With this contextual background on heavy metal behavior, toxicity, and measurement, we now examine the potential for using foraminifers in monitoring and risk assessment of coastal ecosystems. Foraminifers have been used in pollution studies in coastal environments for the past 50 years.The study area includes four environments viz. (1) Channel Part (sampling stations 1-9), (2) Central Part (sampling stations 10-15; 19-25), (3) Northern Part (sampling stations 16-18), and (4) Kalangi Estuary (sampling stations 26-30)[19]. Air and bottom water temperatures, Hydrogen ion concentration (pH), Dissolved Oxygen (DO), Specific Conductance (EC), Chloride and Calcium in the water samples were determined by using a field geochemical kit. Salinity was calculated[20]. The values of the salinity are expressed without units since it is “dimensionless”.
 | Figure 2. Diagram of potentially toxic elements, reservoirs and changes in concentrations from rocks in to water bodies (Colon et al., 2009) |
3.2. Temperature
- The temperature of bottom waters at substrate-water interface was recorded at the time of sample collection, which was made during day time only. The average temperature ranges from 24.0 to 33.0℃. Summer has recorded relatively higher temperatures in all parts of the study area. The comparatively higher bottom water temperatures in both the seasons in Kalangi estuary may be inferred due to shallow water depth[2].
3.3. Hydrogen –ion Concentration (Ph)
- The pH of the area is an important indicator of chemical conditions of the depositional environment. It is a critical environmental factor which influences the production of calcareous micro fauna[21]. He also indicated that the calcareous forms will not survive at a pH less than 7. The water of two seasons is alkaline with average pH ranging from minimum of 7.4 - 8.6. The minimum, maximum and average values of the four estuarine environments of the study area are given (Tab.1). The highest value (8.6) is recorded in the Northern part of the lake during summer. This may be due to evaporation which plays an important role during summer in the distribution of pH bringing in super saturation with respect to carbonate and bicarbonates [22]. Nevertheless, the average pH values are higher (8.0 and 8.3) in the Kalangi Estuary both in pre monsoon and summer respectively. This may be due to the alkaline-rich environment prevailed in the Kalangi Estuary.
3.4. Salinity
- The Salinity of water samples is defined in terms of the ratio K15 of the electrical conductivity of the marine water samples under a definite pressure and temperature to that of potassium chloride (KCl) solutions, in which the mass fraction of KCl is 32.4356×10⁻³ at the sample temperature and pressure[1]. The K15 value exactly equal to 1 corresponds, by definition, to salinity exactly to 35. The salinity is defined in terms of the ratio K15 by the following equationS = a0 + a1 k1/2 15 +a2K15 + a3K3/215 + a4K215Wherea0 =0.008 0a1 = -0.169 2a2 = 25.385 1a3 = 14.094 1a4 = - 7.026 1As the same factor 10-3 was distributed to all numerical values of salinity, it was decided, that for convenience sake this factor should purely and simply be eliminated. It is noticed that the ratio of two electrical conductivities is “dimensionless” and it may be expressed by the number 1. Salinity is a governing factor which plays a greater role in influencing the micro faunal production pattern and survival The highest average value (50) is recorded in the northern part of the lake. The lower values of salinities in other parts except in the channel part during monsoon is mainly dependent on the entry of fresh water in to the lake from river Kalangi. During monsoon considerable decrease in salinity from channel part towards other parts of lake is observed (Fig.3). During summer, the salinity increased from channel part towards interior of the lake. The modest higher values are noticed in pre monsoon in all the estuaries of the study area.[22] has observed that evaporation plays an important role in increasing the value of the salinity in both estuaries and lagoonal environments. Effects of salinity variations and hyper saline conditions on test morphology and the test abnormalities are also known[23]. In the present study Ammonia dentate is affected by the morphological abnormalities although, this species is known to be collected to hyper salinity[24]. High rates of abnormalities of A.denatate have been observed in a hyper saline in land pool, Dead Sea , Israel[25].[26], have classified the abnormalities obtained by experiments in four groups: 1) perturbation affected shape or size of the protocols or of the first chambers; 2) acidification of the coiling plane of the first chambers; 3) development of the two different whorls and 4) development of complex abnormal forms.[27], observed similar morphological abnormalities in hyper saline conditions in lagoon of Araruama, Brazil. Further, it is argued, the permanent hyper saline conditions may induce morphological abnormalities by complex process in the western part of the lagoon of Araruama and in the channel where the percentage of malformed tests is high, the saline varies due to the input of fresh water or of marine water respectively[27]. Pulicat lagoon salinity variations have not generated a strong environmental stress, which pertains the growth and the morphology of foraminiferal tests.
3.5. Dissolved Oxygen
- Dissolved oxygen shows no clear seasonal and spatial variations in the coastal environments and shows only distinct spatial and temporal variations within the estuaries. The fluctuations in the dissolved oxygen in estuaries may be due to photosynthetic process of photoplanktons[28].The average values of the dissolved oxygen are almost same in these parts with highest average value of 5.3 in Kalangi Estuary documented in summer. Summer having higher values than during other seasons (Fig.3). The higher value (5.6 ml l) of dissolved oxygen in summer are due to high photosynthetic activity[3]. The slightly lower values in monsoon are related to respiration process[2]. The DO shows slight decrease from Channel part towards other parts of the lake during monsoon. How ever, the waters in the central part show slightly higher values of dissolved oxygen during summer. It’s noticed that adjoining Bay waters have more DO than the lake waters which are ascribed to higher values of extinction coefficient recorded in the lake proper.
3.6. Organic Matter ( ml.l-1)
- The average organic matter values reaches maximum of 1.10 (ml.l-1) in monsoon at Kalangi and gradually decrease towards other parts (Fig. 4). It is found that organic matter increases as the sediment becomes finer and finer. This is an account of the absorption of the organic matter by finer sediments[28]. The main cause for the increase of organic matter in finer particulars of the sediment is the similarity in the settling velocity of the both organic constituents and fine sediment particles[29]. A similar relationship has been observed in Vembanad Asthamundi and Mahe Estuaries by[30, 31,32] respectively along the West Coast. A similar phenomenon has been documented along the East coast also, Viz. Chilka Lake[33]. Pennar estuary[34], Araniar estuary [2].The sediments at the control portion of the lake in the present study area are characterized by high rate of sedimentation and the decreased dissolved oxygen content of the estuarine water[19, 32]. The high percentage of organic matter may be due to cumulative effects of several factors. A good amount of organic matter was supplied by river run-off and a considerable volume of organic debris drains from the overlying column, relatively rapid rate of accumulation of fine grained inorganic matter and low oxygen content of the waters immediately, above the bottom sediments would favour high organic matter in the bottom sediments[35]. The fluctuations in the organic matter content of the sediment in the pre monsoon and post monsoon were studied. The higher valves may be due to the higher input of the sediment and vegetal matters during monsoon season by the flood water inflow[32, 36].The study area is of different significance because it caters the huge cultivation of marine life in and around. The total population is generally higher near the sea in the channel part and decreases towards the other parts of the lake. This pattern can be observed in all the four seasons. Similar pattern can be observed for living populations with their number being high near the sea in the channel part and decreases towards the other parts of the lake. However, the living populations show near a decrease during monsoon period near the Kalangi estuary while it shows higher values during the other seasons. The channel part shows the highest average number of total foraminifera in all the four seasons. This part shows the highest average of 1027 per sample in post monsoon period. The foraminifera also shows a maximum of 1479 per sample in this part at st 2 in the post monsoon period (Fig.4). The northern part shows a low average number of foraminifea in all the four seasons when compared to the other parts of the lake. Similar trend can also be observed in the case of living fauna as well. The channel part shows an highest average of living fauna for all seasons except in premonsoon while the Kalangi estuary shows highest average living foraminifera per sediment sample. The highest mean values of 694 is found in the post monsoon with CV (Cumulative Value) as 41%. The lowest mean value of 1340 is found at st 2 in the channel part with CV as 6%. The lowest mean value 385 is found at station 30 in Kalangi estuary with CV as 12%. An analysis of variance suggests that the low variability is found for the premonsoon period CV as 6% for the st 2. There is not much significant difference in variability for all the four seasons with CV ranging from 41-46%.
4. Discussion
|
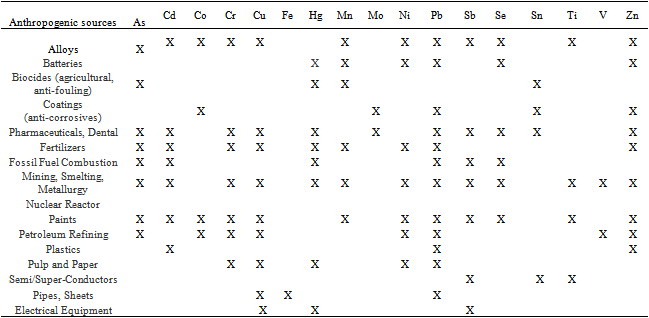
- The range of anthropogenic pollution sources examined include sewage out falls , organic wasters, thermal effluent, pesticides, oil, agriculture, drainage, and harbor[37] ( Table 3). Benthic foraminifers have proven useful in assessment and monitoring of coastal and shelf environments because of their taxonomic diversity , wide distribution , abundance, relatively small size and short reproductive cycles and because their shells are often well preserved in sediments[38]. Foraminifers have specific ecological niches and populations react quickly to environmental changes[39]. A character that makes foraminifers particularly useful as environmental indicators is their tendency to develop malformed testes in stressed environment (Table 3). Most studies that address the effects of pollution using foraminifers do so by examining assemblages of foraminifers in sediments. Presence or absence of key taxa, as well as their abundance and distribution , often can be statistically linked to contaminant sources. Response of foraminiferal assemblages to contaminant gradients have been described and such response can be represented by drastic assemblages changes[40], step wise faunal changes[41] or fluctuations in faunal assemblages and species abundance[42].
4.1. Foraminiferal Assemblages
- Comparisons with earlier study[23] identified Ammonia (which was called Streblus) was the twelfth most common foraminifera in all parts of the lagoon[23] described a near shore biotope affected by surface-water runoff from nearly land and drainage canals characterized by the presence of Ammonia.[2] reported that Ammonia dominated in Araniyar Estuary.[36] noticed Ammonia abundant in estuarine and costal sediments of Kovalam- Kanniyakumari- Tuticorin areas of South east coast of India. The Ammonia - Elphidium assemblage was predominant in all most all environments. The Spiroloculina – Bolivina assemblage was dominant at sites situated in unrestricted open marine central and mouths of estuaries the Bolivina assemblage occurred in the near central and near mouths of the estuaries. The mouth of the rivers as this coastal species transported in to this lake[43]. The assemblages of key foraminiferal taxa in the present study show a reasonably constant picture and collected data sets however, several taxa did fluctuate in their associations. In the overall analyses Amminia and Elphidium clustered with the smaller, heterotrophic taxa. Ammonia and Elphidium clustered with the stress tolerant genera. This is not surprising since Ammonia, Elphidium has been shown to withstand low-oxygen levels[44], marine pollution[38] and other stress. Ammonia, Elphidium, Nonion, Bolivina etc., have been showed to sea water sequester chloroplasts[45]. It is unknown whether the host benefits from Photosynthetic activity of the sequestered chloroplasts or form as yet unidentified biochemical pathway associated with the chloroplasts[45]. Regardless this relationship apparently gives Elphidium and other taxa an ecological advantage in low-oxygen and other stressed environments. Some agglutinated foraminifera such as Rephax[46] are pollution indicators. However, the most agglutinates identified in this study, Textularia and Ammonia Ammobaculites cluster with symbiont bearing foraminifers that are indicative of more environments[14] this two genera secrete calcite cements[15] and therefore likely require near-normal marine sediments. Nevertheless, other morphological abnormalities recorded on some species are marked indication of the polluted environment. Higher proportions of abnormal tests are recorded in the channel subjected to the direct exposure of the Bay water and the western part of the lagoon which is exposed to the fresh water inflow.In general, an increase in pollutants first leads to declining species diversity as the more sensitive species die off sparse resources. It is believed that pollutant concentrations in sediments tended to be negatively correlated with foraminiferal abundance and diversity, and positively correlated with incidences of deformed tests. Ultimately, even stress-tolerant taxa will decline in densities as the stress intensifies [9, 47,48,49]. More over , salinity and pH changes often further complicate interpretations. For example, in their multi-proxy study on inter tidal estuaries in New Zealand,[41] found that step wise shifts in dominance from calcareous to agglutinated forms were associated with the arrival and establishment of humans. Difference in pollutants between studied estuaries had little to no effect on the foraminiferal faunas, which might indicate that bioavailability were below thresholds for response. Anthropogenic pollution typically involves more than one potential stressor. Nevertheless, many studies have established that more faraminiferal taxa tend to be sensitive to environmental stress and only a few taxa tend to be relatively stress–tolerant. Thus changes in assemblages can be useful for low-cost bioindicators of environmental change, even though chemical analysis re required to determine exactly what stressors are present[49].Abnormal test morphology in benthic foraminifera are well known from the geological record[10] (Table 3). Here are some of the abnormalities noted in the study area (Plate.1)1. Reduced test Elphidium escavatum ( Fig.1,2)2. Reduced size of chambers Ammonia dentate ( Fig.3,4)3. Twisted chambers Pararoatalia nipponica ( Fig.5,6)4. Distorted chamber arrangement Quinqueloculina sp ( Fig.7)5. Reduction of Spine and Keel Elphidum advena ( Fig.8)6. Deepening of groves Ammonia sp ( Fig.9)7. Thinning effect Nonion sp ( Fig.10)8. Small size of specimen Elphidium norvangi ( Fig.11)9. Pyritised shells Textularia sp ( Fig.12)
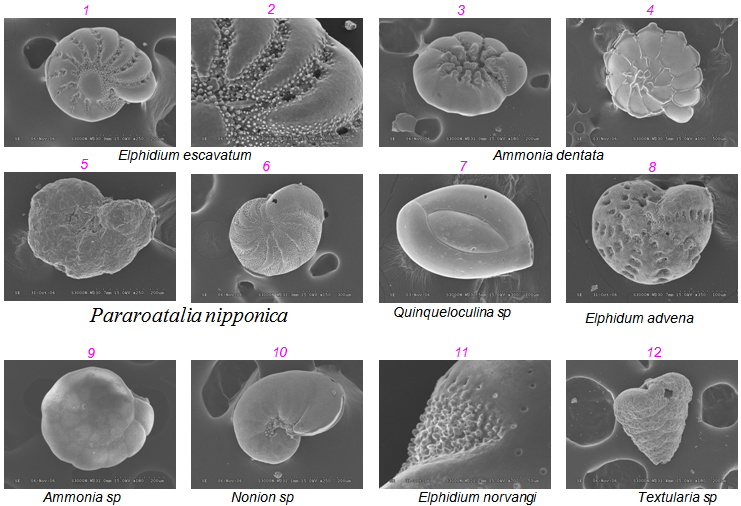 | Plate 1. Morphological Abnormalities on Foraminifera |
5. Conclusions
- • The bottom watermass characters of the lake environment show significant temporal and spatial variations. The wide variations of water mass characters in time and space in lagoon are due to the entry of the Bay water in to the lake during high tides and retreat of the Bay water during low tides.• A total of 50 foraminiferal taxa belonging to 24 genera,16 families, 8 super families, 3 suborders have been recognized. The fauna was present in almost all the sampling stations in all the seasons. The present data show different relationship between abnormal tests and anthropogenic pollution. Considering benthic foraminifera as good bioindicator of metal concentration in its environment, it may be concluded that Pulicat lagoon has been exposed to relatively high pollution. Since the mid nineties corresponds to the date of increasing developments, urbanization and maritime human activities in the area. Results from this study supported the usefulness of bioindicator for monitoring past environmental changes that affect the surface waters from the Pulicat lake of Nellore coast. • The important factors that controls the distribution of foraminifera include tropical subhumid, climate, temperature, salinity, wave and current actions, transport of dead shells in to the Lake from the Bay and occurrence of sub-fossils that lived in the lagoon in the recent past. An insignificant linear relationship between distribution of fauna and some of the environmental parameters was noticed. Distribution is controlled by complex interplay of physico chemical and biological factors. • Some vital ecological parameters viz., dissolved oxygen, organic matter and salinity show low positive correlation with living foraminifera in Pre monsoon and high positive correlation post monsoon. • It is said that sediment size is more important than sediment type in influencing faunal distribution. Grain size and organic matter are also responsible for the population and production. Sediment size could be a controlling factor in the distribution of certain foraminifera in the Lake. • Anthropogenic pollution has more deleterious effect upon the foraminiferal test morphology than agricultural and aquacultural.
ACKNOWLEDGEMENTS
- The project was funding by the Department of Science and Technology , New Delhi. We thank Prof Raymond L. Kepner Jr, USA for corrected the English.
References
| [1] | N. Jayaraju, I. Surya Kumr, and K.R.Reddi, Foraminiferal species densities and Environmental variables of Pulicat Lake, South East coast of India . Jour. Geol. Soc. India. 70, 829 – 836, 2007. |
| [2] | A.N.Reddy, Ecology and distribution of recent Foraminiferida, Araniyar River estuary, TN, India : Ph.D thesis submitted to S.V.University. Tirupati, India, 1981. |
| [3] | B.S.R.Narasimha Rao, Some aspects of the Geochemistry and Sedimentology of the Pulicat Lake, India. Unpubl Ph.D thesis submitted to S.V.University, Tirupati, India, 1971. |
| [4] | A.M. Samir, The response of benthic foraminifera and ostracods to various pollution sources: a study from two lagoons in Egypt: Journal of Foraminiferal Research. 30,83–98, 2000. |
| [5] | M.J.Kennish, Ecology of Estuaries: Anthropogenic Effects. CRC Press Inc, Boca Raton, FL.1992. |
| [6] | R. Coccioni, F. Frontalini, A. Marsili and D. Mana, “Benthic Foraminifera and Trace Element Distribution: A Case-Study from the Heavily Polluted Lagoon of Venice (Italy),” Marine Pollution Bulletin, Vol. 59, No. 8-12, pp. 257-267,2009. |
| [7] | S.N.Bhalla, Recent forminiera from Visakhapatnam beach sands and its relation to th known form gerographical provics in the Indian ocean, Bull. Nat. Inst. Sci. India, no. 38. Pt.1, pls. 1-2, pp.376-396, 1968 . |
| [8] | R.Coccioni, Benthic foraminifera as bioindicators of heavy metal pollution: A case study from the Goro Lagoon (Italy). In: Martin, R. (ed.), Environmental Micropaleontology. Kluwer Academic/Plenum Publishers, New York.,71-103, 2000. |
| [9] | N.Jayaraju, B.C.Sundara Raja Reddy, and K.R.Reddy, The response of benthic foraminifera to various pollution sources: A study from Nellore coast, East Coast of India. Envi Monit Assess 142 , 319-323, 2008. |
| [10] | R.Nigam, R. Saraswat and R. Panchang, Application of foraminifers in ecotoxicology: retrospect, perspect and prospect: Environment International 32, 273–283, 2006. |
| [11] | B.C.Sundara Raja Reddy, Estuarine pollution signatures on the Benthic foraminifera: A study from Nellore coast. Unpublished Ph.D thesis submitted S.V.University, Tiurpati, AP, India ,2006. |
| [12] | T.G.Gibson, and W.M. Walker, Floatation methods for obtaining the foraminifera from sediment samples. Jour .Paleo. vol.41.no.5 , pp1294-1297, 1967. |
| [13] | B.W.Hayward, and C.J. Hollis, Brackish Foraminifera in New Zealand: a taxonomic and ecologic review. Micropaleontology 40 , 185-222, 1964. |
| [14] | P.B. Hallock, E.M. Lidz, Cockey-Burhard, and K.B. Donnelly, Foraminifera as bioindicators in coral reef assessment and monitoring: The FORAM Index. Environmental Monitoring and Assessment, 81, 221-238, 2003. |
| [15] | A.R.Loeblich, A.R., and H. Tappan, Foraminiferal Genera and Their Classification. Van Nostrand-Reinhold, New York, 1987. |
| [16] | E.Alve, and J. Nagy, Estuarine foraminiferal distribution in Sandebukta, a branch of the Oslo fjord. Journal of Foraminiferal Research 16, 261-283, 1986. |
| [17] | R.L.Folk, Petrology of Sedimentary Rocks. Hemphill, Austin, TX, 1980. |
| [18] | F. Frontalini, and R. Coccioni, Benthic foraminifera for heavy metal pollution monitoring: A case study from the central Adriatic Sea coast of Italy: Estuarine Coastal and Shelf Science 74, 404–417, 2008. |
| [19] | I,.Suryakumar, Distribution and ecology of Benthic foraminifera, Pulicat lake, East coast , India . Un published Ph.D thesis submitted to S.V.University., Tirupati, India, 1990. |
| [20] | N. Jayaraju, Ecosystem and population dynamics of Benthic Foraminifera from coastal and estuarine sediments of Kovalam – Kanniyakumari – Tuticorn of South India ,India Ph.D thesis submitted to S.V.University., Tirupati, India, 1993. |
| [21] | F. Phleger, Ecology and distribution of recent foraminifera, Baltimore, John Hopkins Press, Pls. 1-11, 1-297, 1960. |
| [22] | M. Nagaraju, Lake Pulicat and its Environs, South India. Unpubl Ph.D thesis submitted to S.V.University., Tirupati, India, 1985. |
| [23] | K.R.Reddy, R. Jagadiswara Rao, and M.G. Chakrapani Naidu, Foraminifera – subtrate relationship in the Pennar estuary, Andhra Pradesh. Geol. Surv. India . Misc. Publn. 5, 243-248, 1979. |
| [24] | M.M.Colon, P. Hallock and C.R. Ruiz, Strategies for using shallow-water benthic foraminifers as Bioindicators of potentially toxic elements: a review Journal of Foraminiferal Research 39 ,4, 278–299, 2009. |
| [25] | A. Almogi-Labin, L. Perelis-Grossovicz, and M. Raab, Living Ammonia from a hypersaline inland pool, Dead Sea Area, Israel. J. Foraminifer. Res. 22 , 257-266, 1992. |
| [26] | V. Stouff, E. Geslin., J.P.Debenay, and M. Lesourd, Origin of morphological abnormalities in Ammonia (foraminifera): studies in laboratoryand natural environments. J. Foraminifer. Res. 29, 152-170, 1999b. |
| [27] | E.Gelsin, J.P.Debenay, W.Duleba., and C. Boneti, Morphological abnormalities of foraminifreal tests in Brazilian environments: a comparison between polluted and non –polluted areas. Marine Micropaleontology. 45,151-168, 2002. |
| [28] | J.R.Knenen, As quated by Erskian , M.G., And Lipps, J.H., 1977, 1950. |
| [29] | P.D.Trask, Recent marine sediments. Amer. Assoc. Petrol. Geol. pp.1-72, 1939. |
| [30] | P.S.N.Murthy, and M.Veerayya, Studies on the sediments of Venbanad Lake, Kerala State , Part I- Distribution of organic matter, Indian. Indian Journal of Marine Sciences 1, 45-51, 1972. |
| [31] | K.T.Damodaran, and K. Sanjan, Carbonate content of sediments in the Asthtamudi Lake , West coast of India. Indian Journal of Marine Sciences 1, 288-230, 1983. |
| [32] | S. Sebastian, T. Roy George, and K.T. Damodaran, Studies on the distribution of organic matter and carbonate content of sediments in Mahe estuary Northern Kerala. Journal Geological Society of India 36 (1990), 175-213. |
| [33] | K.Venkataratnam, Studies on some aspects of the Chilka Lake , a coastal lagoon , D.Sc thesis , Andhra University, Waktair, AP , India, 1967. |
| [34] | K.R.Reddy, Ecology of recent foraminifera in the Pennar estuary, AP, India: Ph.D thesis submitted to S.V.University, Tirupati, India, 1973. |
| [35] | H.V.Svendrup, M.W. Johnson, and R.H. Flemming, . The oceans - their Physics, Chemistry and general biology, Prentice Hall , New York, 1942. |
| [36] | N.Jayaraju, Ecosystem and population dynamics of Benthic Foraminifera from coastal and estuarine sediments of Kovalam – Kanniyakumari – Tuticorn of South India ,India Ph.D thesis submitted to S.V.University., Tirupati, India, 1993. |
| [37] | B.W.Hayward, H.R.Grenfell, K. Nicholson, R. Parker, J. Wilmhurst, M. Horrocks, A. Swales, and A.T. Sabaa, Foraminiferal record of human impact on intertidal estuarine environments in New Zealand's largest city. Marine Micropaleontology 53, 37–66, 2004a. |
| [38] | V.Yanko, V., J.Kronfeld, and A. Flexer, Response of benthic foraminifera to various pollution sources: Implications for pollution monitoring. Journal of Foraminiferal Research 24 , 1-17, 1994. |
| [39] | V.Yanko, A.J. Arnold, and W.C. Parker, Effects of marine pollution on benthic Foraminifera. In: Sen Gupta, B.K. (ed.), Modern Foraminifera. Kluwer Academic Publishers, Boston , 217-235, 1999. |
| [40] | B.Elberling, K.L.Knudsen, P.H.Kristensen, and G.Asmund, Applying foraminiferal stratigraphy as a biomarker for heavy metal contamination and mining impact in a fiord in West Greenland. Marine Environmental Research 55, 235-256, 2004. |
| [41] | Hayward, B.W., H.R.Grenfell, A.T Sabaa, & E. Sikes, 2006. Deep-sea benthic foraminiferal record of the mid-Pleistocene transition in the SW Pacific. In Head, M.J., and Gibbard, P.L. (Eds.), Early-Middle Pleistocene Transitions: The Land-Ocean Evidence. Geol. Soc. Lon. Spec. Pub., 247, 85-115, 2003. |
| [42] | E. Alve, A case study reconstructing bottom water oxygen conditions in Frierf jord, Norway, over the past five centuries. In: Martin, R.E. (Ed.), Environmental Micropaleontology: The Application of Microfossils to Environmental Geology. Kluwer Academic/Plenum Publishers, New York , pp. 323–350, 2000. |
| [43] | J.P.Debenay, E. Tsakiridis, R. Southard and H. Grossel, Factors determining the distribution of foraminiferal assemblages in Port Joinville Harbor (Ile d’Yeu, France): The influence of pollution. Journal of Marine Micropaleontology 43, 75-118, 2001. |
| [44] | J.M.Bernhard, and B.K.Sen Gupta, Foraminifera of oxygen-depleted environments. In: Sen Gupta, B.K. (ed.), Modern Foraminifera. Kluwer Academic Publishers, Boston, pp. 201-216, 1999. |
| [45] | J.M.Bernhard, and S.S. Bowser, Benthic foraminifera of dysoxic sediments: Chloroplast sequestration and functional morphology. Earth-Science Reviews 46 , 149- 165, 1999. |
| [46] | D.B.Scott, R.Tobin, M. Williamson, F.S. Medioli, J.S. Latimer, W.A Boothman, A. Asioli, and V. Haury, Pollution monitoring in two North American estuaries: Historical reconstructions using benthic Foraminifera. Journal of Foraminiferal Research 35(1), 65-82, 2005. |
| [47] | N.Jayaraju, K.R. Reddi, Impact of pollution on Coastal Zone monitoring with benthic foraminifera of Tuticorin, South east coast of Inida. Indian Journal of Marine Sciences 25, 376-378, 1996. |
| [48] | F. Frontalini and R. Coccioni, “Benthic Foraminifera as Bioindicators of Pollution: A Review of Italian Re-search over the Last Three Decades,” Revue de Micro-paléontologie, Vol. 54, No. 2 , pp. 115-127, 2011. |
| [49] | E. Armynot du Châtelet and J.P. Debenay, Anthropo- genic Impact on the Western French Coast as Revealed by Foraminifera: A Review,” Revue de Micropaléontolo- gie, Vol. 53, No. 3 , pp. 129-137. 2010. |