-
Paper Information
- Paper Submission
-
Journal Information
- About This Journal
- Editorial Board
- Current Issue
- Archive
- Author Guidelines
- Contact Us
Management
p-ISSN: 2162-9374 e-ISSN: 2162-8416
2025; 15(1): 44-54
doi:10.5923/j.mm.20251501.02
Received: Feb. 6, 2025; Accepted: Mar. 17, 2025; Published: Apr. 23, 2025

The Impact of Marketing Mix on Customer Satisfaction: A Primary Study of Carrefour-Lebanon
 Abstract
 Reference
 Full-Text PDF
 Full-text HTML
Mohamad Kheireddine1, Hassan Saleh2
1Ph.D. Candidate at the Faculty of Business Administration, Al-Jinan University, Lebanon
2Professor at the Lebanese University
Correspondence to: Mohamad Kheireddine, Ph.D. Candidate at the Faculty of Business Administration, Al-Jinan University, Lebanon.
| Email: |  |
Copyright © 2025 The Author(s). Published by Scientific & Academic Publishing.
This work is licensed under the Creative Commons Attribution International License (CC BY).
http://creativecommons.org/licenses/by/4.0/

The objective of this study is to analyze how applying the marketing mix elements (specifically the 4Ps: Product, Price, Promotion, and Place) affects customer satisfaction at Carrefour chains in Lebanon. The marketing mix is defined as a cluster of decisions or activities that an organization undertakes to offer value and apply marketable goods in modern business. In retail, these are the four areas through which customers measure value, and at the same time, contribute to their level of satisfaction. Customer satisfaction is explained as the extent to which the fulfillment of consumers’ set expectations regarding a given product’s quality, service delivery, and general shopping experience aligns with their satisfaction. This research analysis was conducted with a specific quantitatively defined cross-sectional design framework and used a deductive logic approach to look into the marketing strategy and customer satisfaction based on correlation. A structured questionnaire was given to a convenient sample of 120 customers at the Carrefour City Center branch in Beirut. Through the instrument, customer satisfaction (the dependent variable) was measured against the four core components of the marketing mix (the independent variables). Statistical analysis showed there is a positive and significant relationship between the marketing mix implementation and customer satisfaction. This proves the effectiveness of the 4Ps in improving retail experience and customer loyalty in Carrefour Lebanon.
Keywords: Marketing Mix, Price, Product, Place, Promotion, Customer Satisfaction
Cite this paper: Mohamad Kheireddine, Hassan Saleh, The Impact of Marketing Mix on Customer Satisfaction: A Primary Study of Carrefour-Lebanon, Management, Vol. 15 No. 1, 2025, pp. 44-54. doi: 10.5923/j.mm.20251501.02.
Article Outline
1. Introduction
- Mainly referred to as the 4Ps (Product, Price, Place, and Promotion), the marketing mix is the most essential component of the latest methods in marketing and strategy development [1]. Its components are vital towards brand perception, influencing their purchasing likelihood. Obtaining the ideal marketing mix means customer needs are met, the correct price is set, advertisement done properly and access to the product is strategically placed [2].Product: Design to meet the needs of a consumer by either physically offering them an item, or services.Price: The amount that the consumers wish to provide in relation to the perceived value and the affordability price range [3].Promotion: All forms of communication that solicit the purchase of goods or services aimed at capturing and persuading specific groups of audiences [4].Place: The various routes of distribution, the actual and virtual locations where you can find the product.These factors are related and when properly coordinated are beneficial to the organization. Without proper coordination, customers may be annoyed with and abandon the products entirely, which causes problems for the business in the market. Therefore, the marketing mix must be applied with sufficient diverse research and precision [1].In corporate parlance, customer satisfaction has often been defined as a metric that embodies overall performance by calculating how well a firm's products and services meet or exceed predefined customer expectations [4]. It has a quantifiable impact on customer loyalty, repeat purchases, and overall reputation of the brand. In the modern market, satisfaction is not only limited to the quality of the product but also includes service, support, psychological factors, and emotions [5].Majid Al Futtaim Group’s Carrefour Lebanon has been operating under the hypermarket model since 1995 and is well regarded for its product assortment, low prices, and customer-oriented services. It is important for Carrefour to evaluate its marketing strategies, especially the 4Ps, as they directly affect brand loyalty and customer satisfaction if they intend to remain competitive in Lebanon's retail market [1]; [6].
2. Research Problem
- A paradox exists where there is a focused shift to customer-centered marketing on a global scale, yet Lebanese companies—especially family-owned—continue to operate with a lack of marketing mix framework. These businesses are not aware or do not have adequate resources to sophisticated marketing techniques and strategies, which prevents them from optimally addressing customer satisfaction [7].In such a situation, Carrefour Lebanon, which operates in a retail market full of competitors, has to implement a complete marketing mix centered around the customer. Strategy based on Kotler & Keller (2006)'s 4Ps is needed because of issues with inadequate consumer understanding, weak promotional activities, ineffective product quality management, and lacking quality control. The purpose of this research is to investigate whether the systematic use of marketing mix elements can improve customer satisfaction.
3. Research Objectives
- This study's goal is to examine how the constituents of the marketing mix, which are product, price, promotion, and place, affect customer satisfaction toward Carrefour Lebanon. It aims to analyze these factors and their impact on the customers’ brand perception, buying decisions, emotional satisfaction, and overall brand loyalty towards Carrefour.The sub-objectives of the research are:1. To assess the individual effect of each marketing mix element (product, price, promotion, and place) on customer satisfaction.2. To determine which marketing mix element has the strongest influence on customer satisfaction among Carrefour customers.3. To analyze how the coordinated implementation of the 4Ps contributes to enhancing customer satisfaction.4. To provide data-driven recommendations for improving Carrefour Lebanon’s marketing strategies based on customer perceptions.5. To contribute to the academic understanding of marketing mix applications in the Lebanese retail sector.
4. Research Significance
- This study holds scholarly and practical importance. From the academic angle, this study expands the marketing mix’s use in Lebanon and other less studied areas by augmenting available literature, focusing specifically on the retail industry. It provides an understanding of the relationship between marketing components, customer satisfaction and brand loyalty perception, and overall perception. For practitioners, the study is of great importance to retail managers and marketers for revealing the constituents of the marketing mix that affect customer satisfaction the most. These results can help increase the enhancement of marketing plans tailored to consumers’ needs, thus fostering brand loyalty, and improving business performance [1].
5. Literature Review
5.1. Introduction to the Marketing Mix
- Borden (1953) first introduced the “marketing mix” concept [8], later on McCarthy (1960) popularized it by creating the 4Ps: Product, Price, Promotion, and Place [9]. This model assists marketers in strategically planning and assessing marketing activities across various contexts [1]. These four variables are factors that a company can manipulate in order to change the purchasing behavior of customers to gain competitive edge.The ever-changing business environment alongside the incessant competition between firms in a market leads to a shift in consumer needs, however the fundamental purpose of the marketing mix remains: The need to help businesses align their products/services with the customers and the market demands. First, marketers select a target market, after which they develop specific strategies through the 4Ps to enhance value creation and communication [2].
5.2. Marketing Strategy and Its Role
- The provided excerpt highlights the concepts, strategies and patterns set out by an organization in conducting business as well as defining marketing opportunities. For Walker and Larreche (2013), a marketing strategy means “the fundamental pattern of current and planned objectives, resource mobilization, and market interaction” [10]. Stemming from branding, packaging, pricing, and advertising, Olson and Peter (2010) note that marketing strategies seek to influence consumer behavior [11]. According to Kotler (2011), the marketing mix serves as the primary instrument for achieving strategic marketing objectives in any given market.
5.3. Theoretical Frameworks
- The connection between the marketing mix and customer satisfaction has received considerable attention through a number of established theories and models. These frameworks are designed to help the marketers understand the consumer approach to marketing stimuli and attitude formation towards the brand.1. Theory of Reasoned Action (TRA)Suggested by Ajzen and Fishbein in 1980, The Theory of Reasoned Action places that intent to behavior is preceded by an attitude towards a certain product and the impact of some social influence. Each of these elements from the marketing mix such as product quality, pricing strategy, and promotional content have an impact on attitude, behavior, satisfaction and purchase [12].2. Expectancy-Disconfirmation TheoryThis model (sometimes referred to as the Oliver model) has one of the broadest applications in the research of consumer satisfaction as described by Oliver in 1980. It states that satisfaction only occurs when there is some level of performance that meets or exceeds the expectation set prior by the individual. If all parts of a marketing mix, such as value-for-money pricing along with good promotions, exceed customer expectations, positive disconfirmation occurs [13].3. The Service Quality Model (SERVQUAL)The model developed by Parasuraman, Zeithaml, and Berry in 1988, although focused on the service industry, is highly applicable to the retail industry. SERVQUAL incorporates five specific dimensions: tangibles, reliability, responsiveness, assurance, and empathy which are heavily influenced by the 4Ps (Promotional mix). For instance, tangibles concern product presentation and atmosphere of the store, while assurance and responsiveness pertain to promotional strategies [14].4. The Customer Perceived Value (CPV) ModelIn his 1988, Zeithaml cited that perceived value is a consumer’s holistic view of the usefulness of a good and balancing what is received against what is given. In this context, the 4Ps have an undeniable direct contribution to the equation where price and quality are considered sacrifices and benefits respectively, while place and promotion increase perceived trust and convenience [15].5. The Stimulus-Organism-Response (S-O-R) ModelThis model was first proposed by Mehrabian and Russell (1974) as a way to explain how the marketing mix’s stimuli impacts an organism’s internal state and emotion, which triggers a response of purchase, satisfaction, and loyalty. For example, promotional advertisement (stimulus) may trigger emotional attachment (organism) leading to purchase behavior (response) repeatedly [16].
5.4. Components of the Marketing Mix
- ProductAccording to Kotler (2011), a product comprises features, design, branding, and services intended to meet a customer’s requirement. It is the central offering upon which all other marketing activities are centered. Products have life cycles: introduction, growth, maturity, and decline, all of which advance requires different marketing strategies. A product's success is determined by aligning to customer expectation on level of satisfaction, innovation and usability [17].PriceAccording to Kotler, (2011) price is the perceived worth of a product, and is therefore the monetary value to derive from losing for a utility. As cited by Umar (2011) “price is the amount of value that consumers exchange for the benefit of owning or using a product or service.” Consumers associate price with quality and market satisfaction as deemed fit [4]. Harsono, 2016 identifies discount and premium pricing as methods that impact buyer behavior the most.Place (Distribution)The aim of these channels is to describe how goods are delivered to the consumer. Proper allocation methods guarantee that the product is available when and where it is needed [2]. In retail, consumer satisfaction and foot traffic are directly correlated to convenience and location. Mohammadi & Sohrabi (2018) said that Carrefour’s physical stores, as well as their e-commerce platforms demonstrate a hybrid distribution model that enhances market reach.PromotionPromotion includes all communication tools used to inform, persuade, and remind customers. Kotler (2011) categorizes promotional activities into advertising, personal selling, sales promotion, public relations, and direct marketing. Integrated marketing communications ensure a consistent brand message and reinforce consumer trust. Studies have shown that targeted promotions increase customer satisfaction and purchasing frequency [18]. Customer SatisfactionCustomer satisfaction is commonly defined as a consumer's post-purchase evaluation of a product or service in relation to expectations [13]; [4]. Satisfied customers are more likely to become repeat buyers and brand advocates. According to Mowen and Minor (2010), satisfaction represents “the overall attitude shown by consumers toward goods or services after consumption.” High satisfaction levels enhance word-of-mouth referrals, brand loyalty, and profitability [19].
5.5. Empirical Studies on Marketing Mix and Satisfaction
- Within the last two decades, a multitude of researchers across different industries, cultures, and customer demographics have studied the connection between marketing mix strategies and customer satisfaction. This part summarizes important empirical studies that are pertinent to Carrefour Lebanon for the proposed research study.1. Rafiq and Ahmed (1995)Rafiq and Ahmed, in a pioneering study, scrutinized the applicability of the conventional 4Ps model to the UK banking sector. They noted that while product, price, promotion, and place were still valid, people, process, and physical evidence were indispensable components for discerning satisfaction in service sectors. This work later helped to enhance the model into the 7Ps of marketing for services. Their findings stressed that customer satisfaction is a composite phenomenon resulting from the influence of both concrete (product, place) and abstract (promotion, people) elements [20].2. El Sayed (2012)El Sayed evaluated the application of the 4Ps in the marketing strategies of Lebanese small and medium-sized enterprises (SMEs) in a field study. The study discovered that most Lebanese firms did not have a proper marketing plan which resulted in them not fully utilizing important mix elements like promotion and distribution. Yet, those businesses that practiced at least three of the 4Ps experienced greater customer satisfaction, suggesting even in developing markets, the model has some utility [21].3. Saghier and Nathan (2013)For Saghier and Nathan's case study in Egypt’s retail banking sector, they examined how each of the marketing mix elements impacted customer satisfaction C. Their study showed that the most significant predictors of satisfaction were price and accessibility (place), followed by product and promotional communications. The study pointed out the facilitative role of convenience and trust for sustaining customer relationships and retention over time, especially in the context of financial services [22].4. Sharma and Lambert (2013)This study sought to compare customer reaction related to various elements of the marketing mix in the US and India. The researchers concluded that the cultural setting greatly influenced customer attention: American customers were more responsive to promotional activities and spatial arrangements (place) in retail stores, whereas Indian customers valued price and product features more. These findings strengthen the argument for strategies tailored to specific markets and highlight the necessity to adjust the 4Ps in accordance with consumer trends and behavior [23].5. Al-Debi, H., & Al-Waely, D. F. J. (2015)Surveying the Jordanian insurance sector, Al-Debi and Al-Waely (2015) concluded that the greatest factors affecting customer satisfaction centered around product tailoring and promotional clarity as part of the 4Ps. The study advocated for a responsive service model alongside clearly defined communication frameworks, particularly in strained competitive scenarios. In the context of this study, place and price were found to have moderate effects that did not reach statistical significance, pointing towards the more intangible characteristic of the industry [24].6. Harsono (2016)Harsono conducted a study on customer loyalty toward Toyota Avanza in Surabaya, Indonesia, with a sample of 124 car owners. Using multiple regression analysis, the study found that while the overall 4Ps model had a significant impact, only the product variable had a direct, statistically significant influence on customer loyalty. The author recommended that car companies focus on maintaining high product quality while using the other elements (price, place, promotion) to support brand positioning [6].7. Alipour et al. (2017)This study examined the impact of the marketing mix strategies in the Iranian sports goods industry. It found that promotional strategies and the product itself had the most effect on customer satisfaction, particularly when brands used emotional marketing and lifestyle marketing. Price and place also contributed to satisfaction, but were not as significant. The study noted that customers in sports retail markets look for not only brand image, but also an emotional bond in addition to functional value [25].8. Mohammadi and Sohrabi (2018)Mohammadi and Sohrabi explored the online retail context and sought to understand the indirect impact of the marketing mix elements on customer satisfaction through the mediating role of e-CRM. Based on the data from 384 participants, the study concluded that the elements of the marketing mix did not directly influence satisfaction, but rather affected the effectiveness of e-CRM, which subsequently enhanced customer satisfaction. This highlights the need for more attention on digital channels when implementing marketing strategies [7].9. Sudaria et al. (2019)The study looked into the fast-food sector in the Philippines and found that all four Ps had a positive and significant impact on customer satisfaction. As in other studies, product quality and promotional activities were the most important. The study suggested the use of digital promotion, in addition to traditional marketing, to improve customer experience and brand perception.In any case, the literature review shows that marketing mix is related to customer satisfaction, and customer satisfaction is confirmed. Outcomes, however, differ by sector and region. For example, in the tangible product sectors, such as automotive and fast food, there is usually a focus on products and promotion. In serviced or digital sectors, focus shifts to place and CRM. The 4Ps is generally useful in many contexts, but with respect to the Lebanese retail market, there is less attention given especially to large retailers like Carrefour. This study intends to fill this gap with data from Carrefour Lebanon by applying a systematic study of the 4Ps to customer satisfaction metrics [18].
6. Hypotheses
- Based on the research problem and its questions, the following hypotheses are tested:Main premise:Ha: There is a significant positive relationship between the marketing mix and customer satisfaction.As for the sub-hypotheses:1. Ha1: Place has a positive and significant effect on customer satisfaction.2. Ha2: Promotion has a positive and significant effect on customer satisfaction.3. Ha3: Product has a positive and significant effect on customer satisfaction.4. Ha4: Price has a positive and significant effect on customer satisfaction.
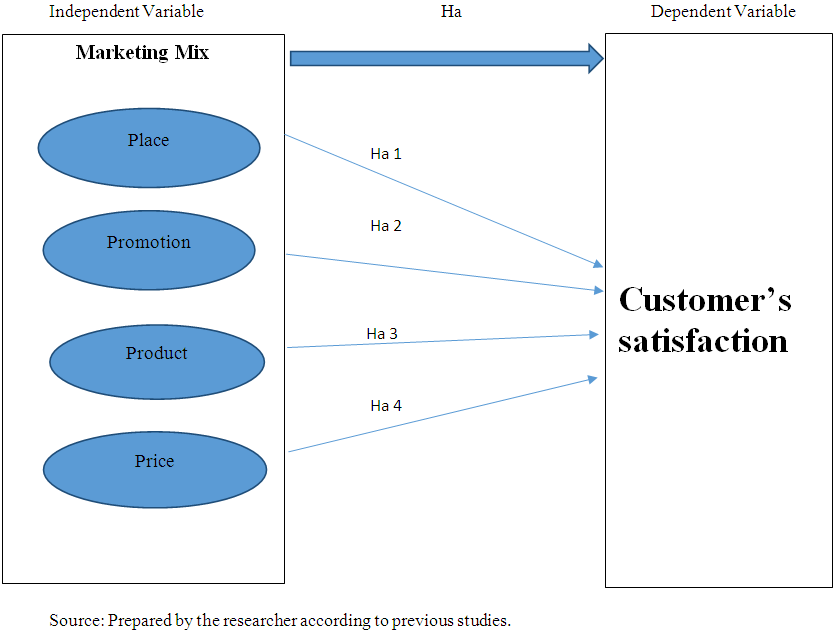 | Figure 1. Conceptual Framework |
7. Statistical Analysis and Hypothesis Testing
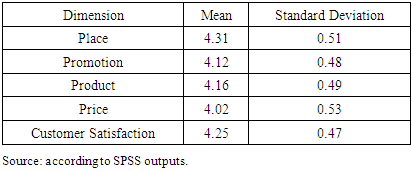
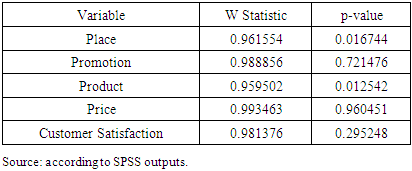
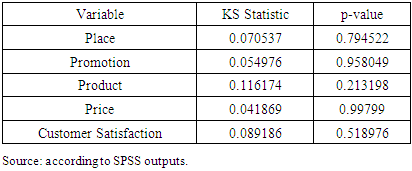
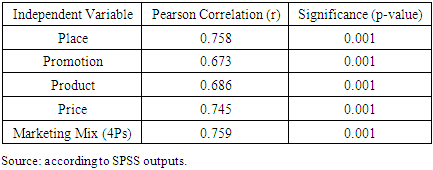
- First: The validity and reliability of the tool:To assess the reliability of the study instrument, Cronbach’s Alpha coefficient was used to examine the internal consistency of the questionnaire. The results showed that all dimensions exceeded the acceptable threshold of 0.60, with values over 0.80, indicating high reliability and internal coherence among the items measuring both the independent variables (4Ps) and the dependent variable (customer satisfaction).Second: The study sample's characteristicsA total of 120 participants took part in the survey, all of whom were customers at Carrefour’s City Center branch in Beirut. The sample’s demographic profile is characterized by diversity in terms of gender, age, educational attainment, occupational background, and marital status.Gender:The gender distribution was relatively balanced, with 62.5% of respondents identifying as female and 37.5% as male. This slight female majority may reflect the demographics of typical retail shoppers in Lebanon, where women often play a central role in household purchasing decisions. It also aligns with prior studies in the retail sector, where women have shown higher levels of engagement in evaluating pricing, quality, and promotional offers.Age:The majority of participants (38.7%) were in the 26–35 age group, followed by 25% aged 36–45. This indicates that most respondents were within the young to middle-aged adult bracket, a group known for its active purchasing power and high brand awareness. These age groups are also more likely to respond to modern marketing strategies, such as digital promotions and loyalty programs, which may influence their satisfaction levels.Educational LevelOver half of the sample (53.7%) held a university degree, while 25% completed only high school, and 21.3% held graduate-level qualifications. This educational distribution suggests that the majority of respondents were relatively well-educated, potentially making them more discerning consumers. Their higher level of education may also enhance their awareness of pricing fairness, product quality, and promotional clarity—factors that directly relate to satisfaction.Occupational StatusRegarding occupational status, nearly half of the participants (47.5%) were employed, and 16.2% were business owners. The remaining participants included students (17.5%) and unemployed individuals (18.8%). The dominance of working adults suggests that the respondents have regular disposable income, making them more experienced and critical in evaluating retail services. Students, on the other hand, may be more price-sensitive, while unemployed individuals may prioritize affordability and promotions.Marital StatusA significant proportion of respondents (68.7%) were married, with 25% single, and only 6.3% reporting that they were divorced or widowed. Married individuals may have broader shopping responsibilities and are likely to assess Carrefour based on family-oriented criteria such as value-for-money, product variety, and store convenience. In contrast, single respondents may focus more on pricing, promotional appeal, or personal preferences in product selection.The demographic characteristics of the sample show a broad representation of Carrefour’s target customer base, with dominance from educated, working-age, married individuals. These characteristics reinforce the reliability of the data, as they reflect a group that is actively engaged in purchasing and likely to be responsive to variations in the marketing mix.Descriptive Statistics for Research VariablesTo assess the general trends in participant responses, descriptive statistics were calculated for each of the study’s main variables using a 5-point Likert scale ranging from 1 (Strongly Disagree) to 5 (Strongly Agree). The analysis aimed to capture the central tendency and dispersion of perceptions related to the four marketing mix elements (product, price, promotion, place) and customer satisfaction.The results show that the highest mean score was recorded for Customer Satisfaction (M = 4.25, SD = 0.47). This indicates a strong level of agreement among respondents regarding their overall satisfaction, loyalty, and likelihood of recommending Carrefour to others. This high average underscores the effectiveness of Carrefour’s marketing efforts in fostering positive consumer experiences.Among the marketing mix elements, Place achieved the highest mean (M = 4.31, SD = 0.51), reflecting the importance customers assign to store accessibility, layout, and convenience. This finding aligns with existing literature which suggests that retail location and physical environment play a significant role in shaping customer satisfaction.Product and Promotion followed closely with mean scores of 4.16 (SD = 0.49) and 4.12 (SD = 0.48) respectively. These values suggest that consumers are generally satisfied with the quality, variety, and packaging of Carrefour’s products, as well as with its promotional efforts, although there may be room for enhancement in how promotional activities are communicated or perceived.Price had the lowest mean among the four marketing mix elements (M = 4.02, SD = 0.53), although still relatively high. This suggests that while customers view Carrefour’s pricing as fair, this element may be more sensitive to individual expectations and market comparisons.Importantly, all standard deviation values were below 0.60, indicating low variability and high consistency in participant responses across all dimensions. This reinforces the reliability of the data and suggests that customer perceptions were generally aligned across the sample.Table 1 presents the summary statistics in terms of the average and the standard deviation of each dimension.
|
|
|
|
|
|
|
8. Conclusions and Recommendations
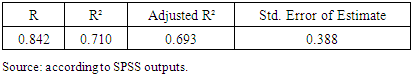
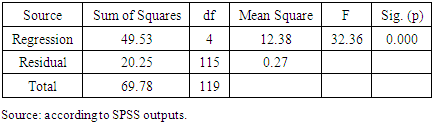
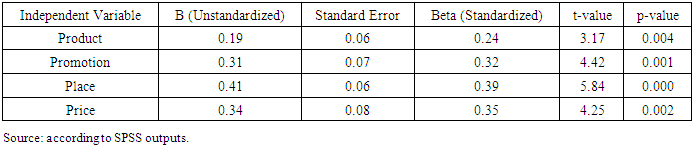
- The objective of this study was to determine the impact of the marketing mix elements – Product, Price, Promotion, and Place – on customer satisfaction in the Carrefour retail store in Lebanon. The analysis conducted has proven that all four components significantly impact customer satisfaction and this impact is positive. According to the regression analysis results, the percentage of customer satisfaction is significantly impacted by the marketing mix variables (Adjusted R² = 0.693), s indicating a strong customer satisfaction predictive model.Among these, Place (β = 0.39, p < 0.001) was noted to be the most significant, demonstrating the role of store placement regarding accessibility, customer traffic efficiency, and strategic convenience. Price came in next (β = 0.35, p = 0.002) which corroborated the impact of recessionary pricing powers even in a stressful economy like Lebanon’s. Promotion (β = 0.32, p = 0.001) also registered notable impacts, proving the influence that positive publicity powered by strategic communication campaigns creates ad shapes customers’ perceptions. While Product was last with the lowest coefficient (β = 0.24, p = 0.004), its impact on satisfaction measurement was still noteworthy, confirming that appreciation of product quality and variety remains pertinent, alongside other experiential factors.These results correspond with the international and local literature and accentuate that satisfaction does not come from a singular approach but rather the combined application of diverse marketing tactics. Retailers like Carrefour competent in integrating these components harmoniously tend to enjoy strong brand allegiance, enhanced customer retention, and a proprietary sustained edge over competitors. This research adds value to the academic and in-depth understanding of the subject, as well as to its practical implications by showcasing how the 4Ps model can be leveraged in the context of Lebanese retail.
9. The Study Recommends the Following
- Based on the findings, it is recommended that Carrefour Lebanon continues to invest in store experience and accessibility, as these emerged as the most influential factors in driving satisfaction. Pricing strategies should also remain a strategic priority, ensuring transparency and value. Promotional activities should be more personalized and technology-driven to reach and engage customers more effectively.For future research, scholars are encouraged to expand the sample size and geographical coverage across multiple Lebanese cities. It is also advised to incorporate additional marketing mix dimensions (such as People, Process, and Physical Evidence), and to consider mixed-method approaches for a more comprehensive understanding of consumer behavior.