-
Paper Information
- Paper Submission
-
Journal Information
- About This Journal
- Editorial Board
- Current Issue
- Archive
- Author Guidelines
- Contact Us
Management
p-ISSN: 2162-9374 e-ISSN: 2162-8416
2023; 13(1): 1-14
doi:10.5923/j.mm.20231301.01
Received: Dec. 25, 2022; Accepted: Jan. 30, 2023; Published: Feb. 22, 2023

Economic-Mathematical Assessment of the City Brand Competitiveness Based on a Quantitative Indicators System
 Abstract
 Reference
 Full-Text PDF
 Full-text HTML
Marina A. Ivankova
Ph.D. in Economics, JSC Atomenergoproekt, Russia
Correspondence to: Marina A. Ivankova, Ph.D. in Economics, JSC Atomenergoproekt, Russia.
| Email: |  |
Copyright © 2023 The Author(s). Published by Scientific & Academic Publishing.
This work is licensed under the Creative Commons Attribution International License (CC BY).
http://creativecommons.org/licenses/by/4.0/

The article substantiates the need for a quantitative indicators system of the city brand competitiveness, as well as offers the guideline of developing such a system, focusing on main areas of the city branding. Also, in this article the main development stages of economic-mathematical mechanism for assessing the city brand competitiveness have been formed, bearing in mind the priority of city brand competitiveness indicators, to meet the goal of increasing it in certain areas of city branding.
Keywords: City brand, City brand competitiveness, City brand competitiveness indicators, Quantitative assessment of competitiveness
Cite this paper: Marina A. Ivankova, Economic-Mathematical Assessment of the City Brand Competitiveness Based on a Quantitative Indicators System, Management, Vol. 13 No. 1, 2023, pp. 1-14. doi: 10.5923/j.mm.20231301.01.
Article Outline
1. Introduction
- It’s worth nothing that currently the contribution of the brand to the competitiveness of places, ranging from territories, cities to countries is wildly acknowledged. Therefore, the key to successful increasing of the city competitiveness lies in effective promoting and boosting the city brand competitiveness. In the conditions of a dynamically developing world, emerging global and local economic crises, alongside with increasingly fierce competition of territories, the objective of identifying the city brand competitiveness, as a driver for the city promotion, is extremely crucial in such competitive environment. It is no longer enough to assess qualitatively the level of the city brand competitiveness for maintaining its competitive position. The vibrant development of cities dictates the necessity to manage the process of creating city brand competitive advantages, while possessing the complete systematic information about its competitiveness.From our point of view, the foundation for improving the process of the city competitiveness assessment, primarily, lays in thorough monitoring of those factors, which exhaustively and sufficiently form the city brand competitiveness. Thus, a quantitative assessment of referred factors’ influence reflects the objective picture of tailoring the city brand competitiveness.Such systematic description of referred factors serves as a tool to create an economic-mathematical mechanism of the city brand competitiveness assessment. The mechanism which offers a range of opportunities to specifically enhance the city brand competitiveness.Such an approach will enable the authorities, in charge of promoting the city brand, to purposefully create its competitive advantages.The relevance of this article consists in the necessity to create an essential quantitative indicator system of the city brand competitiveness, in a compartment with economic-mathematical mechanism for the city brand competitiveness quantitative assessing, deriving from it.
2. Theoretical Base
- A study of relevant scientific sources on assessing the city brand competitiveness and the city brand as a driving force of the city competitiveness [1-6] revealed that the problem of assessing the city competitiveness and its brand attractiveness is quite complex. Most indicators in these studies are of a pronounced qualitative nature, and as a rule, there are no adequate statistics on some indirect quantitative indicators of the city brand attractiveness. Some of the analyzed sources contain quantitative indicators of such assessment, but do not offer their system. The list of indicators is fragmented. It does not provide an opportunity to assess the brand competitiveness comprehensively, to take into account exhaustively the fundamentally different areas of building the city brand competitiveness, while having the necessary and sufficient set of indicators for each such area.The analyzed papers focusing on the quantitative assessment of the competitiveness of the city/city brand [4,7-10] have demonstrated the following: - subsequently, the comparison of the obtained data, containing the target values or objectively the best values of similar indicators of the city/city brand is not carried out [4,7]. This leads to both a high degree of subjectivity of the assessment results and complexity in the process of comparing the competitiveness of several cities/brands of cities;- it has been noticed that the weightiness of competitiveness indicators in building the competitiveness of the city/city brand in general, may not be taken into account. The indicators are analyzed as equilibrium [4,8-10]. That is incorrect and doesn’t reflect the reality. The contribution of various indicators to the building of the comprehensive city /city brand competitiveness may vary significantly, in accordance with the objectives and conditions of the assessment; - there may be no system of competitiveness indicators in its right, or either the indicators are presented in the form of a sheer listing, without being combined into groups according to the areas for assessing the competitiveness of the city/city brand [4,8,10]. Thus, the principle of systematic competitiveness assessment has not been respected;- the title of the indicator may be of a generalized, inaccurate nature without containing units of measurement [7,10]. This also contributes to a greater expert’s subjectivity while assessing such an indicator;- the assessment of the city brand competitiveness may be missing in each area of the city branding, in a form of a generalized competitiveness indicator of the city brand for the given area, with due regard for the weight of the latter's contribution to the building the total city brand competitiveness. Also, there is missing the assessment of the impact of individual city brand competitiveness indicators, in a view of such indicators weight in the building the city brand competitiveness in each branding area [4,8,10]. Under such an approach we come across definite complexities in assessing whether the indicators are higher, or there is the lag (the "weak point" of competitiveness) in the exact areas of building the city/city brand competitiveness. While also – it is difficult to assess the impact of changes in a particular indicator of the city brand competitiveness on the building city brand competitiveness in a certain branding area. Thereby, this significantly complicates the process of making managerial decisions on the city brand development and promotion.The indicators system of the city brand competitiveness should be a list of fundamentally different characteristics (formation areas) of the city brand competitiveness. This system should describe and allow to evaluate such competitiveness completely and exhaustively. The quantity of such indicators should not be excessive. The objectivity of the conducted assessment of the city- brand competitiveness should be ensured by due regard of a city-brand competitiveness components and the weightiness of such components. The mechanism of quantitative assessment of the city brand competitiveness is designed to perform assessment of the city brand competitiveness in various branding areas, taking into account the contribution (weight) of each area in the process of building the total city brand competitiveness.Furthermore, such a mechanism should enable to assess in quantitative terms, the way in which a change in a particular indicator of a city brand competitiveness affects its competitiveness in general and particularly in a certain branding area. Therefore, such a mechanism offers the possibility to those, responsible for managerial decisions on the city brand promotion, to identify «the bottleneck» of the city brand competitiveness and arrive at a decision on how to eliminate it in a prompt manner.As a result, such a mechanism confers the possibility to clearly and purposefully identify and ensure the unique competitive position of the city brand.
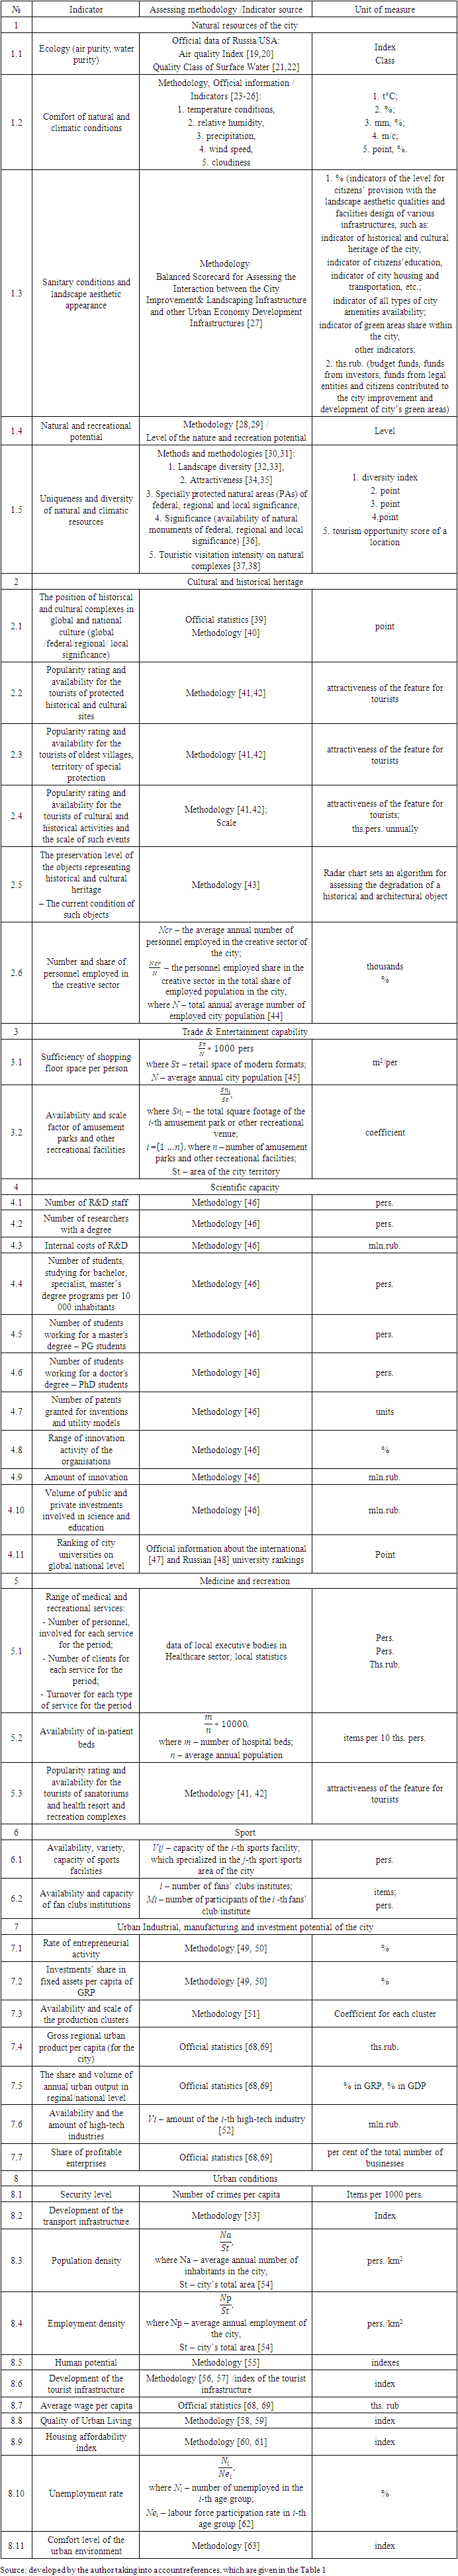
3. Quantitative Indicators System of the City Brand Competitiveness
- The main city branding areas have been taken as the basis for developing a quantitative indicators system of the city brand competitiveness assessment [4,11-17] from the standpoint of its attractiveness for various types of tourism and investors [18]: - natural resources of the city;- cultural and historical heritage;- Trade & Entertainment capability;- scientific capacity;- medicine and recreation;- sport;- urban industrial, manufacturing and investment potential of the city;- urban conditions. Figure 1 proposes a block diagram of a quantitative indicators system for a city brand competitiveness assessment, taking into account the main areas of city branding.
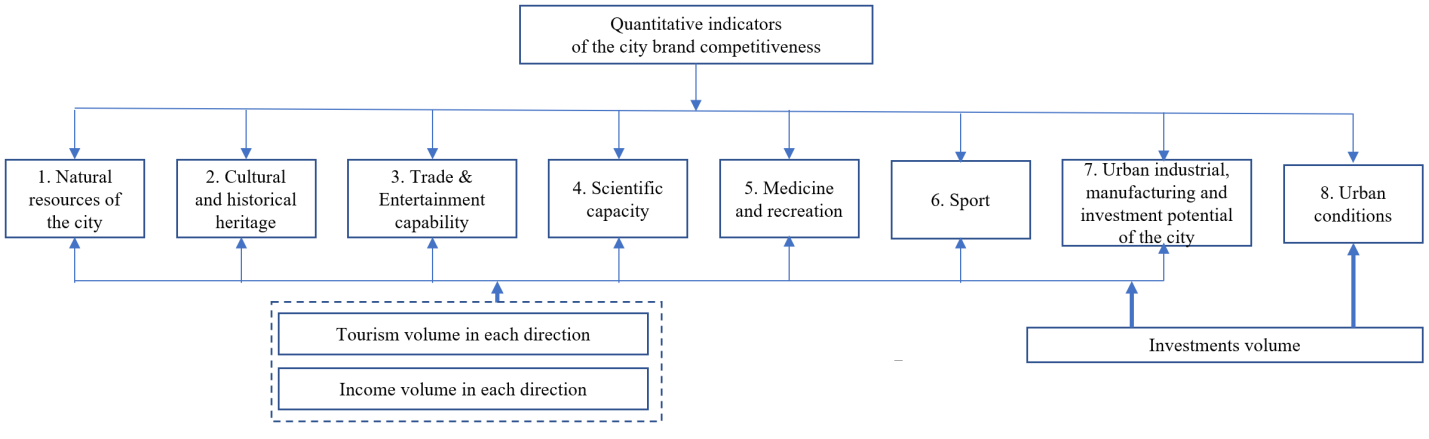 | Figure 1. Block diagram of a quantitative indicators system of the city brand competitiveness assessment (Source: developed by the author) |
|
4. Economic-Mathematical Assessment Tool for City Brand Competitiveness
- Elaborated by the author, economic-mathematical assessment tool for an industrial entity competitiveness, as well as methodological approaches to evaluating the competitive performance of the industry, serve as the basis for economic-mathematical assessment tool of the city brand competitiveness [64-66].Furthermore, in accordance with the methodology of the above-mentioned tool development, the private indicators can provide assessments of the conceivable influence of the main areas of city branding on the overall city brand competitiveness. These private indicators represent the coefficients to evaluate the level of city brand competitiveness, reflecting the current state of the main areas of city branding. Such private indicators are the statistic basis for formation of the generalized indicators of city brand competitiveness and serve as a key platform to the efficiency of management decision-making on developing and promoting the city brand, which as a result, lead to boosting the city brand competitiveness. When selecting the generalized indicators, it is crucial that their content has a certain rational value for studying the city brand competitiveness in various aspects. The generalized indicator captures the convergence within the set of private indicators (total or otherwise determined), taking into consideration the weighty contribution of such private indicators in a given generalized interaction. When selecting the generalized indicators, it is crucial that their private indicators have a certain rational value for studying the city brand competitiveness in various aspects. Furthermore, it is essential to estimate accurately the relevance of the private indicators as components of generalized indicators, from the perspective of building the city brand competitiveness, in the framework of the given generalized indicator. Thus, we offer the tool to develop a generalized indicator of the city brand competitiveness for each above-mentioned area of city branding, subsequently consisting of the private indicators of the city brand competitiveness. Therefore, the generalized indicator of the specific area of city branding will be named after the area correspondently. Whilst quantitative indicators operate as the private indicators, providing the detailed assessment of the city brand competitiveness on each area of the city branding.For that matter, the generalized indicators feature the cumulative effect of the private indicators impact and its weighty contribution on building the city brand competitiveness in the appointed area of city branding.The integrated indicator of the city brand competitiveness, (recording weighty contribution of each generalized indicator involved in the city brand competitiveness) should be identified, when designing the generalized integral assessment of city brand competitiveness in all areas of city branding. It may be stated that the weighty contribution of each generalized indicator is selected according to the order of priority of the specific area of city branding in the process of building the city brand competitiveness.Therefore, the integrated indicator brings sufficient evidence to draw conclusions regarding the city brand competitiveness, and in case of necessity, aims at improving the efficiency of regulatory decision-making on city branding competition policy, on the basis of the acquired information.The following approach to identify the referred indicators can be recommended.As each city brand can be characterized by a certain set of private indicators S, affecting its competitiveness, the pending task to be accomplished -is the task to select a brand-sample, while assessing the private indicators. Such a brand sample is intended to be used to compare both the city brand competitiveness indicators and those of a brand-sample, and subsequently, identify the quantitative value of the competitiveness coefficient.It should be noted, that the issue of results comparability is significant for making comparison between different city brands competitiveness, as well as for choosing a brand-sample.To comply with this condition, the city branding areas and the private indicators for each city branding area (see Table 1) would have to coincide for the city brands under comparison.For instance, in the capacity of the values of brand-sample’s competitiveness indicators, can be taken similar indicators’ target values of the analyzed city brand. Also, as indicators of a brand-sample, we may include competitiveness indicators of a competitor-city brand, with the best values.The city brand competitiveness coefficient of the separate characteristic, described by the corresponding private indicator, can be calculated by the formula:
 | (1) |
 – value of the i-th analyzed private indicator of the private indicators set
  si0 – value of the i-th basic private indicator of the sample from its private indicators set
  Ki – competitiveness coefficient for the i-th private indicator.With regards to calculating the competitiveness coefficient on unemployment rate, we should keep in mind that the dependence would be reverse:
 | (2) |
 then the city brand competitiveness on the si-indicator is lower than that of the city-competitor in question;- provided that
  then the city brand competitiveness on the si-indicator is higher than that of the city-competitor in question;- provided that
  then the city brand competitiveness on the si-indicator is equal to the city-competitor competitiveness on the same indicator;- provided that
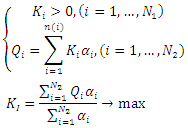
  on the si-indicator then the city brand appears to be non-competitive. Such occurrence would have been completely inadmissible in the process of building the city brand competitiveness, in the framework of the given areas of city branding. For each si indicator under assessment, in the framework of the given areas of city branding competitiveness, coefficient should be strictly above zero:
  To put it another way, while assessing the city brand competitiveness, the areas of the city branding are selected accordingly, with a view to promote the city brand. Otherwise, we should state that the city brand lacks a precondition for a successful promotion in the market and achieving competitive advantage, due to being non-competitive in at least one of selected areas of the city brand competitiveness assessment. Thereby, while building the city brand competitiveness, that results in creating a «bottleneck» which puts the city brand at risk of losing in the competition.Generalized indicators for the city branding areas can be calculated by the following formula:
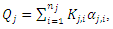 | (3) |
 in assessing the city brand competitiveness of using the generalized indicator
  j – city branding area. For this case j=1…8 (see Table 1). The significance (weightiness) of private indicator, as a rule, is determined by economic laws and described by mathematical dependencies, as well as by an expert and takes values
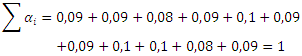
  Moreover, when calculating each of the generalized indicator for weighting coefficients of private indicators, included in this generalized indicator, the condition should be observed:
  | (4) |
 | (5) |
 | (6) |
 | (7) |
 | (8) |
 – city brand competitiveness coefficient for the i-th private indicator;
 – number of private indicators of the city brand competitiveness;
 – the i-th generalized indicator of the city brand competitiveness;
 – number of generalized indicators of the city brand competitiveness;
 – weighting coefficient of the city brand competitiveness coefficient Кi;
  for any generalized indicator
 – number of private indicators of the city brand competitiveness in the i-th generalized indicator; KI – integrated indicator of the city brand competitiveness;
 for integrated indicator KI.
 5. Example of Using the Economic-Mathematical Assessment Tool for City Brand Competitiveness
- By way of illustration, we cite an assessment of generalized indicators of the urban conditions’ competitiveness on the example of Yekaterinburg city and Tyumen city, for the subsequent comparison and for drawing conclusions on the competitiveness of urban conditions for these two cities.Table 2 presents both basic values and the values of indicators of urban conditions’ competitiveness for Yekaterinburg city and Tyumen city (depending on the identification conditions of the relevant indicator of the table in Sverdlovsk and Tyumen regions, respectively). As a case study for calculation, the basic values here were provided within the maximum/minimum values for Russia, disregarding the comparability of the regions under consideration (formulas 1 and 2).
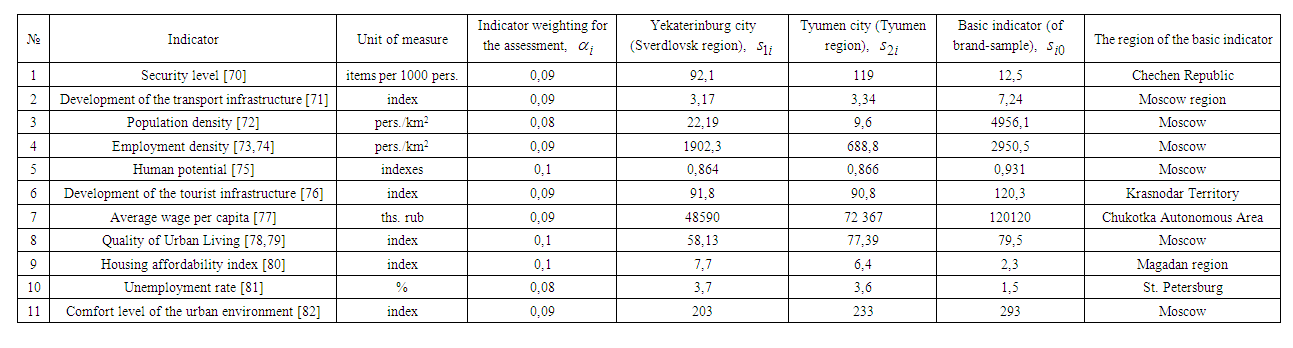 | Table 2. Indicators of urban conditions’ competitiveness for Yekaterinburg city and Tyumen city |
 Generalized indicator on urban conditions for Yekaterinburg city (Sverdlovsk region) according to the formula (3) is:
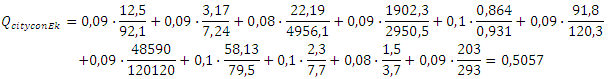 Generalized indicator on urban conditions Tyumen city (Tyumen region), according to the formula (3) is:
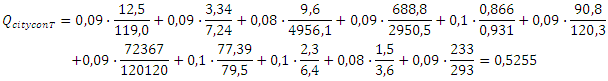 The conducted assessment leads to the conclusions that Tyumen city has a higher level of competitiveness for urban conditions.Within Tyumen city, more attractive conditions have been created for: - development of the transport infrastructure,- average wage per capita, - quality of Urban Living, - housing affordability, - unemployment rate- comfort level of the urban environment.In the case of certain managerial decisions of the city authorities are taken, a change of a particular urban condition indicator for Yekaterinburg city will give a clear picture of the change in the generalized indicator of competitiveness for urban conditions. That could also be applied when comparing the level of competitiveness in a certain branding areas of Yekaterinburg city and Tyumen city.Having executed the assessment of the generalized indicators, in this manner, for all areas necessary for the city brand competitiveness study, it is possible to calculate the integral indicator of the competitiveness of the city brand (formula 8).
6. Conclusions
- Based on the research of various sources, we can confidently conclude that the quantitative indicators system of the city brand competitiveness, presented in the article, has no analogues. While assessing the city brand competitiveness, the analysis of all city branding areas is conducted, whereas each city branding area is followed by a detailed elaboration with quantitative indicators. Thus, the incorporation of quantitative indicators provides a systematic assessment of the city brand competitiveness, giving attention to all aspects of building the city brand competitiveness. Such indicators, in a sufficient amount, is the detailed and exhaustive statistics base, ideally qualified to carry out such an assessment.Elaborated by the author, economic-mathematical assessment tool provides the opportunity to explicate the level of the city brand competitiveness, using a quantitate and systematic approach to evaluating the city brand competitiveness, with due regard for all the factors affecting, in various areas of city branding.Therefore, such analysis allows to identify strong and weak sides of the city brand competitiveness and serves as a key platform to the efficiency of management decision-making on regulation and promoting the city brand on the particular indicators or the branding area.The objectivity of the city brand competitiveness assessment is firmly adhered through consideration the weighty contribution (weight) of each specific indicator of the city brand competitiveness in the shaping of a generalized indicator for each city branding area, as well as the weighty contribution (weight) of each generalized indicator including each branding area in the integrated – general – assessment of the city brand competitiveness. Furthermore, comparing the values of individual indicators, with the selected basic values of a similar brand-sample indicators, provides a more objective assessment of competitiveness.The objectivity of the assessment here is ensured by the fact that the target values of each indicator or the best values of similar indicators of a brand of a city-competitor can be taken as the base values.Thus, the comparison of values will reveal the proximity or lag of indicator values from similar target values or advancements of a more successful brand. Moreover, it is possible to conduct the same competitiveness assessment and analysis in particular for a brand-competitor. Thus, the unique competitive advantages of a brand-competitor identified in the structured and targeted manner through evaluation and analysis will allow to benefit from the experience of a competitor, while building the city brand under examination.The presented economic-mathematical tool of the overall assessment of city brand competitiveness, including the specific and generalized indicators, offers insight with regards to the responsiveness of the overall city brand competitiveness to adjustments in certain specific or generalized indicators of the city brand competitiveness. And this, in turn, will provide assistance for the identification the specific city branding area, and highlight the detail, affecting the results of assessments of the city brand competitiveness level to a greater or lesser extent. This means that the conducted analysis will reveal what impact will have any possible adjustments to the current city branding areas on the overall city brand competitiveness. As a consequence, such approach gives you a more precise and objective final assessment of the city brand competitiveness.The article shows that the mathematical functional description of interrelations between private and generalized indicators of the city brand competitiveness, will illustrate quantitatively the impact of bringing changes in one indicator of the branding area, in the way it affects the other and as a result the influence of such adjustments on the city brand competitiveness. Ultimately, such functional interrelations facilitate to detect the criticality of such adjustments for the city brand competitiveness.As a final point, we would like to summarize that all the aforementioned will determine the policy for the well-timed management decision-making on achieving the required values of competitiveness indicators, by means of identifying and promptly eliminating the «bottleneck» of the city brand competitiveness, brining progress to streamline activities and thus, undoubtedly, resulting in boosting the city brand competitiveness. Presented in this article economic-mathematical mechanism, elaborated for assessing a city brand competitiveness, may serve as efficient tool to those making managerial decisions on promoting the city brand by designing a unique strategy and tactics for increasing the city brand competitiveness, while retaining competitive advantages of a city, and also preventing the losses of position in rapidly changing conditions and in times of crisis.