-
Paper Information
- Paper Submission
-
Journal Information
- About This Journal
- Editorial Board
- Current Issue
- Archive
- Author Guidelines
- Contact Us
Management
p-ISSN: 2162-9374 e-ISSN: 2162-8416
2020; 10(1): 18-22
doi:10.5923/j.mm.20201001.03

The Role of Micro and Small Enterprises in Employment Creation and Income Generation in Samara-Logia Town, Afar Regional State
 Abstract
 Reference
 Full-Text PDF
 Full-text HTML
Mahmud Ahmed Mahmud1, Minda Yirga Beyene2, Ebrahim Mohammded1
1Samara University, Ethiopia
2Wolkite University, Ethiopia
Correspondence to: Minda Yirga Beyene, Wolkite University, Ethiopia.
| Email: |  |
Copyright © 2020 The Author(s). Published by Scientific & Academic Publishing.
This work is licensed under the Creative Commons Attribution International License (CC BY).
http://creativecommons.org/licenses/by/4.0/

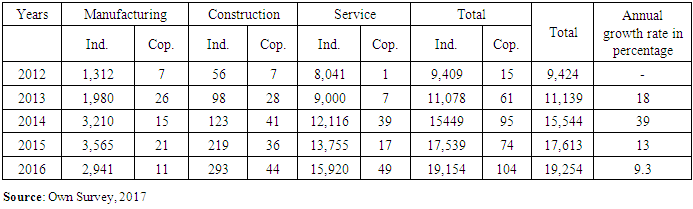
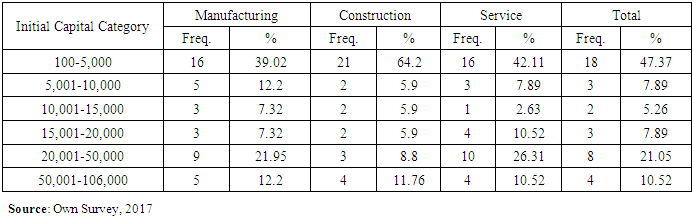
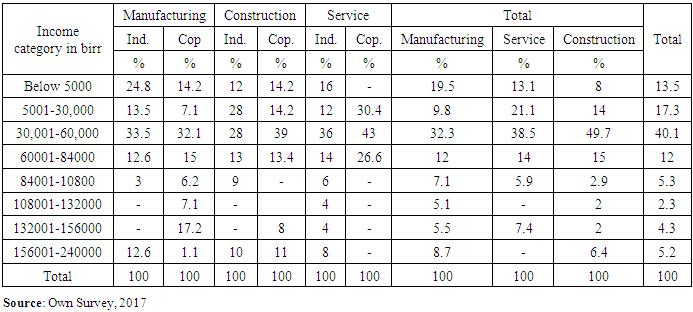
Unemployment and low income are one of the present situations in urban parts of Ethiopia. The government of Ethiopia has formulated a policy to mitigate the overwhelming problem by fostering micro and small enterprises. In this study an attempt is made to assess whether Micro and Small Enterprises (MSEs) create employment opportunities and income increase in Samara-logia town, Afar regional state. The study was based on primary data from 123 small business owners and 106 employees of MSEs and secondary data was also obtained from Afar Regional state bureau of Trade, industry and Transport. A descriptive cross-sectional approach was the research design utilized to carry out the study. Questionnaire and interview were used as data collection instruments and the response obtained was analyzed using descriptive approach. The study revealed that there is growth rate of MSEs in Samara-logia town and the five year trend of MSEs, shows 19.8 percent annual average growth rate of MSEs. There is difference among sectors in terms of number of employees per MSEs, the manufacturing and construction sector have 7.52 and 8.3 average number of employees per MSEs respectively in five years time. Service sector also have 5.4 average number of employees per MSEs. Most of the MSE owners (44.6%) get average annual income from 30,001-60,000 birr while majority of the employees of MSEs (42.4%) get average annual income of 7,402-8,402 birr individually. The major constraints MSEs are facing in their order are financial shortage and inability to get access to affordable rental house. To conclude MSEs have great contribution in reducing unemployment and in providing income to those owners and employees of MSEs. Based on the major findings a number of policy recommendations are drawn. Among these, access to credit has vital role in growing MSEs. Giving working premises and business development service would help MSEs to produce and sell products easily.
Keywords: Micro and Small Enterprises, Employment creation, Income generation
Cite this paper: Mahmud Ahmed Mahmud, Minda Yirga Beyene, Ebrahim Mohammded, The Role of Micro and Small Enterprises in Employment Creation and Income Generation in Samara-Logia Town, Afar Regional State, Management, Vol. 10 No. 1, 2020, pp. 18-22. doi: 10.5923/j.mm.20201001.03.
Article Outline
1. Introduction
- Poor countries, like Ethiopia, at this time are highly attached with different problems like poverty, unemployment, backward culture, famine, illiteracy, high population growth rate etc. According to Federal Urban Development Package of Ethiopia 2005, “In Ethiopia, the number of people who can work continues to grow more rapidly than the ability of the economy to provide new employment opportunities. Unemployment, particularly urban unemployment, is one of the critical problems in the country. The rate of urban unemployment in the country was 26.4 percent in medium towns and 40 percent in large urban towns in 2005” Afar regional state in relation to Ethiopia is highly affected by long lasting war, draught due to shortage of rain. This and other factors affected the region to have many destitute, unemployed, less income or poor people. Samara-logia, the regional government’s center, is one of the cities found in Ethiopia, with high unemployment level. There were around 47,382 and 15,122 unemployed people in the region’s urban towns and samara-logia town respectively (Afar Regional State Bureau of Trade, Industry and Transport 2008). And the rate of unemployment in Samara-logia is 30 percent (FUDPE 2005). In recent years, the problem of unemployment is aggravated in the town because of rapid migration of people from various parts of the region, and high natural growth rate of population, low death rate and limited job opportunity by the private sector and government.In addition to the unemployment in the town, poverty has aggravated in urban areas. According to plan for accelerated sustainable development to end poverty (PASDEP 2005/6-2009/10), Samara-logia is one of the towns, which have highest population living under absolute poverty in relation to other major towns of the country (PASDEP 2005/6-2009/10). This accounts for 40 percents of the population of Samara-logia. The micro and small enterprise development strategy of the country has started implementation recently in Ethiopia to reduce urban unemployment, poverty and bring economic development. Due to this, promoting MSEs has been taken as a tool in Samara-logia town, like other cities of Ethiopia. As the result of this, many MSEs are created in the past five to six years. Those MSEs flourished are individually owned and cooperatives enterprises. The questions are whether these enterprises contribute to employment generation and its sustainability. If MSEs contribute to income creation for those individuals engaged in MSEs? What is the trend of MSEs in Samara-logia town? What are the prospects and challenges of MSEs? The main objective of the study was to assess the role of micro and small enterprises in employment creation and income generation in Samara-logia town.
2. Materials and Methods
- The research has relied both qualitative and quantitative types of data. Concerning sources of data, both primary and secondary sources have been used in generating relevant data. As the objective of the research is to assess the role of Micro and small enterprises in employment creation and income generation, the research design adopted here is descriptive, describing what has happened and what is happening. And the study has primarily used qualitative data which was obtained through a questionnaire that was distributed to and filled by the employees of the enterprises and interview sessions with owners of enterprises. Here, three sectors of MSEs are taken. Those are manufacturing Industry, Service, and Construction sectors.From these different sectors or each stratum, the sample has been selected through disproportional stratified sampling by judgmental decision. This is for the purpose of comparison between different sectors in their contribution to income generation and employment opportunity creation. The sample taken through disproportionate stratified sampling by selecting equal sample size from each sector. This is because in order to compare and contrast the three sectors regarding contribution towards employment and income generation and also to see the growth rate and constraints of the three sectors.
3. Data Collection and Instruments
- In this research, the primary data collection instruments are semi structured questionnaires, in depth interviews and focus group discussions. In order to collect the required data from selected sample, the researcher used the survey method. The designs of the questionnaire have been close and open ended types of questions. The questionnaires have been pretested and modified before the execution of the survey. During pilot test of the questionnaires, 20 owners of MSEs and 20 employees of MSEs were selected randomly through systematic random sampling. In the administration of questionnaire four enumerators were recruited and trained on data collection and on the contents of the questionnaire provided. The enumerators administered the questionnaire with the supervision of the researcher. A total of 123 questioners for owners and 106 questionaires for employees working in the MSEs were distributed, filled and returned by employees working in target MSEs. Further, focus group discussion and were techniques utilized to gather the necessary data. Methods of Data Processing and AnalysisThe counting and placing of data in particular group and sub-group have been done through simple and cross tabulation. Descriptive statistical tools were used to analyze the data. Descriptive statistical tools such as tables, percentages, are used. Mean, maximum, minimum were used to classify the respondents annual income and number of employees per MSEs in to the above mean, below the mean, the minimum and the maximum.
4. Results and Discussion
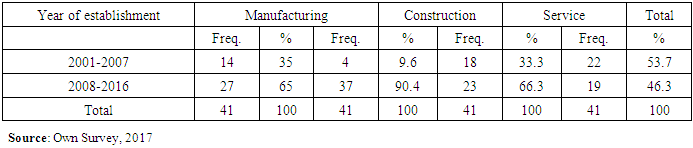
- Gender Wise distribution of ownership of MSEsAccording to the survey made by the researcher, 73.8 percent of the respondents of manufacturing sectors, 72.8 percent of the construction and 41 percent of the service sector owned individually or cooperatively are owned by male entrepreneurs, 26.2 percent of the manufacturing sector, 27.2 percent of the construction sector and 59 percent of the service sector owned individually or cooperatively are owned by female entrepreneurs. According to the researcher’s Survey, the aggregate number of male owned MSEs is more than the numbers of MSEs owned by female entrepreneurs which are 62.5 percent and 37.5 percent respectively. The study indicates that, except in the service sector majority of the enterprises are owned by male entrepreneurs. The socio-cultural attitude could be another factor for decreasing participation of women in Manufacturing and construction sectors. Enterprises’ Information
|
|
|
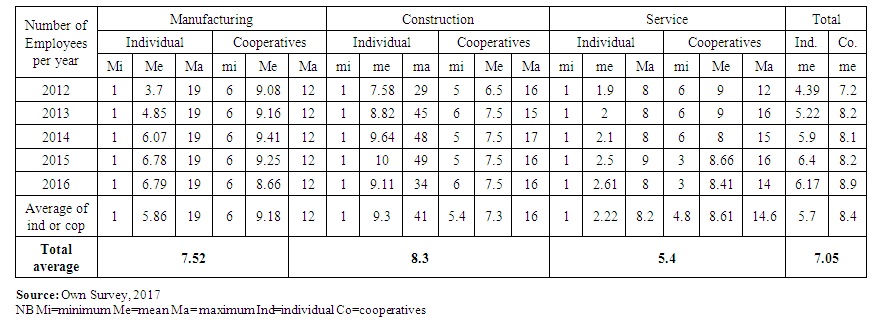 | Table 4. Total Number of Employees by Enterprise and Form of Ownership |
|
5. Conclusions and Recommendations
- • Micro and small enterprises (MSEs) are among the major economic agents in Afar regional state next to agriculture (MOFED 2002).• The study tried to survey five year trend of Samara-Logia town, and there is consecutive growth in number of establishment in MSEs with different growth rates. And the average growth rate in number of establishment in five consecutive years is 19. 9 percent.• In employment creation, MSEs created jobs for many individuals. The average number of employees in MSEs is 7.05 per MSEs in Samara-Logia town. . The study also finds out that there is an increase in average number of employees working in MSEs from year to year.• Compared to male entrepreneurs, the participation of female entrepreneurs in the study area is less. Therefore, it is highly recommended for the regional government to work towards increasing female engagement in this sector of the economy.