-
Paper Information
- Paper Submission
-
Journal Information
- About This Journal
- Editorial Board
- Current Issue
- Archive
- Author Guidelines
- Contact Us
Management
p-ISSN: 2162-9374 e-ISSN: 2162-8416
2020; 10(1): 10-17
doi:10.5923/j.mm.20201001.02

Assessing the Impact of Tourism on the Hospitality Sector’s Share to Gross Domestic Product: From the Ghanaian Perspective
 Abstract
 Reference
 Full-Text PDF
 Full-text HTML
Moses Ago Gyamfi 1, Daniel Odoom 2, Kennedy Oppong Fosu 3, Bayuasi Nammei Luki 4
1Stellar Lodge, Stellar Properties and Champs Sports Bar and Grill Takoradi Limited
2Graduate School, Ghana Technology University College, Takoradi Campus, Takoradi
3Ghana Audit Service, Bibiani
44Faculty of IT Business, Ghana Technology University College, Takoradi Campus, Takoradi
Correspondence to: Daniel Odoom , Graduate School, Ghana Technology University College, Takoradi Campus, Takoradi.
| Email: |  |
Copyright © 2020 The Author(s). Published by Scientific & Academic Publishing.
This work is licensed under the Creative Commons Attribution International License (CC BY).
http://creativecommons.org/licenses/by/4.0/

This study assessed the impact of tourism on the hospitality sector’s share to the real Gross Domestic Product (GDP) growth of Ghana. It employed the quantitative research approach and the explanatory research design. The study used time series data from 2007 to 2017 on tourism variables such as tourism receipts to GDP, tourism expenditure to GDP, number of international tourism arrivals to GDP; economic variables or transmission channels such as imports to GDP, exports to GDP, real exchange rate and hospitality sector’s share to GDP growth. Theoretically, this study was grounded on the tourism-led growth hypothesis which helped in explaining the link between tourism and economic growth. Regression analysis was employed as the analytical tool for this study. The study established that tourism drivers such as tourism receipts, tourism expenditure, and number of international tourism arrivals have statistically significant positive relationship with hospitality sector’s share to the country’s real GDP. Again, the study found a reverse positive relationship between hospitality sector’s share to real GDP and tourism expenditure. Also, it was observed that a positive relationship existed between tourism drivers (tourism receipts and international tourism arrivals) and tourism expenditure. In addition, there was a statistically significant positive relationship between imports to GDP and hospitality sector’s share to real GDP. There is the need for new policy direction to develop and promote tourism activities and the hospitality sector to make them more attractive to regular tourists and potential ones. The Ministry of Tourism, and Hotel and Hospitality Association of Ghana need to financially support the business activities of the local companies in the industry to enable them expand and develop economies of scale to improve their export activities to generate more foreign exchange.
Keywords: Tourism, Gross Domestic Product, Hospitality, Impact, Growth, Economy, Drivers
Cite this paper: Moses Ago Gyamfi , Daniel Odoom , Kennedy Oppong Fosu , Bayuasi Nammei Luki , Assessing the Impact of Tourism on the Hospitality Sector’s Share to Gross Domestic Product: From the Ghanaian Perspective, Management, Vol. 10 No. 1, 2020, pp. 10-17. doi: 10.5923/j.mm.20201001.02.
Article Outline
1. Introduction
- Tourism plays a vital role in expanding the growth of economies globally. Nations which pay increased attention to their tourism sector stand the chance of achieving improved economic growth (Freytag and Vietze [1]; Jaafar et al.) [2]. For example, it is widely contended that an improvement in tourism activities tends to stimulate investments in the public and private sectors, human capital, the generation of income and employment which ultimately contribute to economic growth (Brida and Pulina [3]; Freytag and Vietze [1]; Jaafar et al.) [2]. This implies that the inability of policy makers to invest in the tourism sector would have adverse effect on the public and private sectors, human capital, revenue generation and on the overall growth of the economy. In line with achieving economic growth, researchers, policy makers and practitioners have also shown interest in knowing the different tourism drivers which influence different sectors’ contribution to the growth of the economy. Researchers and scholars have used different economic growth models and theories in an attempt to explain the linkage between tourism activities and economic growth. Desite this effort, very little attention has been given to how tourism drivers influence different sectors’ contribution to the growth of the economy (Lado-Sestayo and Fernández-Castro [4]; Prayag et al.) [5].The Ghanaian tourism industry is among the sectors which have gained considerable recognition owing to the expansion, development and promotion in different tourist activities such as beaches, resort centers, hotels, iconic attractions, wildlife centers, and museums among others (Travel and Tourism) [6]. In the contention of Caglayan et al. [7], tourist activities come in different forms and these are associated with the generation of earnings through tourist receipts, international arrivals, foreign exchange, and improvement in local activities. In essence, the different tourism activities play different roles; simulates tourist spending and these tend to have multiplier effect on the different sectors contribution to the growth of the economy (Caglayan et al. [7]; Gyamfi) [8]. In Ghana, for example, it is widely recognized that international tourist arrivals and international tourism receipts create a lot of revenue for the country and international tourist arrivals was expected to increase to 2 million by 2017. This figure is expected to generate expenditure of USD 1,414.6 million (increase of 4.1% pa) (Travel and Tourism) [6]. Notwithstanding these strides, the industry is faced with a number of challenges including inadequate qualified personnel, poor investments to make the industry more attractive to foreigners, and poor maintenance culture. Policy makers and practitioners are expected to address these challenges using both short and long term investments in infrastructure, maintenance, employee development, recruitment of more qualified personnel, etc. (Gyamfi) [8]. According to a report by Travel and Tourism report 2017, as cited in Gyamfi [8], the tourism sector has become very important to both the global and local economies. The Report further shows that travel and tourism contributed to 10.2% of global GDP and also contributed to 292 million jobs for people in 2016. At the global level tourism is able to distribute money through their purchasing power from developed economies to developing or emerging countries. The tourism activities help to create jobs and also reduce poverty in emerging economies (Gyamfi [8]; Travel and Tourism) [6]. The tourism industry in Ghana is becoming vibrant as it has improved in its different tourist activities such as hotels, resorts, good restaurants, beaches, and tourist sites, among others. Tourism sector remains robust in the creation of employment and contribution to GDP (Travel and Tourism) [6]. In 2016, for instance, tourism contributed to 3% of Ghana’s GDP and this increased to 3.2% of GDP in 2017. In fact, the figure is expected to rise to 2.9% of GDP by 2027. In terms of job creation, tourism helped to create 288,000 direct jobs in 2016 and this increased to 301,500 in 2017. In addition, international tourist arrivals are expected to increase to 2 million in 2027 and this is expected to generate expenditure of USD 1,414.6 million (increase of 4.1% pa) (Gyamfi [8]; Travel and Tourism) [6]. Suffice to indicae that the vibrancy of the Ghanaian tourism industry has not been in doubt.Empirical studies have observed that tourism activities are associated with more spending by tourists in the hospitality industry and these tend to have multiplier effect on the different sectors’ contribution to the growth of the economy (Lado-Sestayo and Fernández-Castro [4]; Nagy [9]; Prayag et al.) [5]. More so, other studies (Brida and Pulina [3]; Freytag and Vietze [1]; Jaafar et al. [2]) have found a link between tourism activities and economic growth and this has been explained by tourism-led growth hypothesis. The implication is that improvement in tourism activities tends to contribute to increased investments within the public and private sectors, improved human capital formation, increased income generation and improved employment creation. All these tend to contribute to economic growth (Freytag and Vietze [1]; Jaafar et al.) [2]. Although previous studies (Brida and Pulina [3]; Freytag and Vietze [1]; Nagy) [9] have found a relationship between tourism activities and hospitality sector, they failed to establish the impact of tourism activities on hospitality sector’s share to the GDP growth of nations. Thus, there is paucity of knowledge with respect to the impact of tourism on the hospitality sector’s share to the growth of the economy. Against this background, this study aimed at examining the impact of tourism on the hospitality sector’s share to the GDP growth of the economy from the perspective of Ghana.
2. Literature Review
- This study is informed by the Tourism-Led Growth Hypothesis. Literature exists on the link between tourism and economic growth and this has been explained by tourism-led growth hypothesis (Brida and Pulina [3]; Freytag and Vietze [1]; Jaafar et al.) [2]. The tourism-led growth hypothesis is premised on the fact that when there is improvement in tourism activities it tends to improve the foreign exchange earnings in the host country. The earnings are then employed to produce improved goods and services in different sectors of the economy (Brida and Pulina) [3]. The hypothesis also holds that improvement in tourism activities will stimulate investments in the public and private sectors through the development of human capital. Again, the theory states that when tourism activities are promoted there is the tendency to stimulate spending in different sectors of the economy. Besides, when tourism activities are promoted it helps in the generation of income and employment opportunities (Freytag and Vietze) [1]. From the above, it can be argued that improvement in tourism activities is a potent vehicle to stimulate foreign exchange earnings, increased employment and improved economic growth. Empirical studies which tested the tourism-led growth hypothesis found mixed results in different countries (Jaafar et al. [2]; Jackman [10]; Jenkins and Katircioglu [11]; Zuo and Huang) [12]. For instance, in a study in China, Zuo and Huang [12] revealed an inverted U shaped relationship between the tourism specialization drivers and economic growth. Again, Freytag and Vietze [1] found that tourism has a statistically significant positive impact on economic growth which provides support to the tourism-led growth hypothesis. Other studies which have tested the tourism-led growth hypothesis are Qin et al., as cited in Gyamfi [8] for China; Zadel and Bogdan [13] for Republic of Croatia; and Phri [14] for South Africa. Besides, several other studies conducted on the impact of tourism on economic growth revealed mixed results which could be ascribed to differences in country-specific factors which became the basis of analyzing the impact of tourism on economic growth. For instance, Muslija et al. [15] studied the relationship between tourism and economic growth based on 113 countries with data from 1995 to 2015. The authors found that tourism and economic growth impacted positively on each other in both directions. Both tourism and economic growth were found to be key determinants in the growth of the hospitality industry. In another study by Chou [16] which focused on 10 transition countries involving panel data from 1988 to 2011, it was observed that causal relationship existed between tourism and economic growth for countries such as Romania, Bulgaria, Slovenia and Lativa. However, Chou found a reverse relationship between tourism and economic for countries including Czech Republic and Poland. Again, Caglayan et al. [7] examined the relationship between tourism and economic growth using panel data for 135 countries drawn from America, Asia, Europe, Middle East and Africa. In this study, a bi-directional causality relationship was established between tourism revenue and GDP for Europe; whilst unidirectional causality relationship was observed for American nations. Also, a reverse relationship from GDP to tourism revenue was found for East Asia, South Asia and Oceania; whilst it found no relationship for Africa, Asia and Middle East. Suhel and Bashir [17] assessed the impact of tourism drivers such as number of tourists, added value of the tourism sector, government tourism spending and tourism investment on economic growth. The study showed that tourism added value, number of tourists and government tourism spending contribute to economic growth. Again, the study observed that tourism added value, government tourism spending, and overall tourism and economic growth affect the number of tourists. A study by Akama [18] in Kenya using time series data from 1980 to 2013 found international tourism receipt to have unidirectional causal relationship with economic growth when the Granger causality test was employed. This result contradicts Suhel and Bashir [17] who found a significant relationship between tourism and economic growth. Similarly, a study by Karim and Njoya [19] in Kenya found that there is unidirectional relationship between tourism and economic growth. In the same vein, a study in Sri Lanka by Suresh and Senthilnathan [20] established an unidirectional causality relationship between economic growth and tourism earnings. It is very clear from the above that there are inconsistent results with respect to the impact of tourism on economic growth. The inconsistency could be attributed to the differences in country-specific factors. This means that more studies need to be conducted using different countries in order to help bring clarity on the issues, hence this research.
3. Methodology
- This study relied on the quantitative research approach in an explanatory design. The approach used in this study was necessitated by the nature and availability of the data the researchers relied upon (Odoom, Fosu, Ankomah and Amofa) [21]. Also, the research approach and design used were in line with Saunders et al. [22]. The researchers employed time series data from 2007 to 2017 involving data on tourism variables such as tourism expenditure (Selimi et al.) [23], tourism receipts (Bulim et al.) [24], international tourism arrivals (Bulim et al.) [24]. Also, economic variables including imports, exports, real exchange rate and hospitality sector’s share to GDP growth from 2007-2017 (Bulim et al. [24]; Caglayan et al. [7]; Selimi et al.) {[23] were examined. Secondary data on the tourism variables were obtained from Ministry of Tourism (MoT), and data on economic variables or transmission channels were obtained from Bank of Ghana (BoG), and Ghana Statistical Service (GSS) from 2007 to 2017. Based on literature (Bulim et al.. [24]; Selimi et al.) [23], this study categorized the tourism variables (tourism receipts, tourism expenditure, and international tourist arrivals) as the explanatory variables; economic variables (imports, exports, real exchange rate) as the control variables or the transmission channels, and hospitality sector’s share to GDP growth as the dependent variable.The key explanatory variables were measured as tourism receipts to GDP ratio, tourism expenditure to GDP ratio and number of international arrivals to GDP (the number of times tourist visit the country in a year). These explanatory variables were used to account for transmission effect of the different tourism drivers on hospitality sector’s share to GDP growth (Bulim et al. [24]; Selimi et al.) [23]. Again, based on the works of scholars such as Bulim et al. [24], Caglayan et al. [7], and Selimi et al. [23], the transmission channels are imports, exports, and real exchange rate. The measurement of real exchange rate was based on Bank of Ghana’s rate, estimated at an average rate of the foreign currencies in US dollar in relation to the ratio of consumer price index for Ghana to that of US (BoG) [25]. Like in the case of Jaafar et al. [2], the researchers considered one-year lag period for the measurement of real exchange rate. The one-year lag effect used accounts for the delayed effect of the real exchange rate on hospitality contribution to GDP (Jaafar et al.) [2]. Similar to Selimi et al. [23], exports and imports were measured as percentage of GDP, expected to account for the trade openness of the Ghanaian economy. These variables were used to account for the effect of other economic variables or transmission channels on the hospitality sector’s contribution to the country’s GDP. Needless to say that existing studies (Bulim et al. [24]; Selimi et al.) [23] have recognized that different sectors’ contribution to GDP is not only dependent on tourism drivers but also on different economic variables despite the differences existing in the nature and magnitude of the impact. Freytag and Vietze [1] explained GDP as the aggregated economic output when adjusted for price changes with respect to inflation. However, similar to Bulim et al. [24], this study focused on hospitality sector’s share to real GDP as a measure of the dependent variable from 2007 to 2017. This study mainly followed the research model by Muslija et al. [15] which focused on only tourism variables such as tourism receipts and number of international tourist arrivals and real GDP growth as measurement of economic growth. However, unlike Muslija et al. [15], the researchers incorporated tourism variables such as tourism receipts, tourism expenditure, number of international tourist arrivals; economic variables such as imports, exports, real exchange rate and hospitality sector’s share to real GDP. The econometric model for the study is shown below:
 In the above econometric model, SHGDPt represents hospitality sector contribution to RGDP in year tTR1t represents tourism receipts to GDP in year t TR2t represents international tourism arrivals in year tTR3t represents tourism expenditure to GDP in year tIMPt represents imports to GDP in year tEXPt represents exports to GDP in year tREXCt represents real effective exchange rate in year tIn the above model, αo represents the constant, εi represents the error term, while β1, β2, β3, β4, β5 and β6 represent the coefficients of the respective explanatory and control variables (Wooldridge, 2016). This study employed multiple regression analysis as the analytical tool based on earlier studies (Bulim et al. [24]; Selimi et al.) [23]. The first regression was run to examine the relationship between tourism variables (tourism receipts, tourism expenditure, and international tourism arrivals), economic variables (imports, exports, real exchange rate) and hospitality sector’s share to real GDP Growth. Also, another regression was run to examine the relationship between only the tourism variables (tourism receipts, tourism expenditure, and international tourism arrivals) and hospitality sector’s share to real GDP Growth.
 4. Results and Discussion
- The analyses of the results are in three parts. The first part discusses the diagnostic tests performed to check the normality of the data and the robustness of the model. The second part discusses the results from the first regression analysis in examining the relationship between tourism variables (tourism receipts, tourism expenditure, and international tourism arrivals), economic variables (imports, exports, real exchange rate) and hospitality sector’s share to real GDP Growth. The third part discusses the second regression analysis and this examined the extent to which hospitality sector’s share to real GDP Growth and tourism expenditure impact on each other.
4.1. Diagnostic Tests Performed
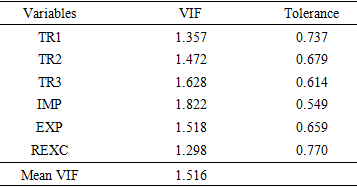
- Drawing knowledge from Wooldridge [26], the running of regression analysis are associated with limitations and as a result some diagnostic tests were carried out to check for the normality of the data, multicollinearity, among others. The results for these tests are discussed below. Results of multicollinearity testsTable 1 shows the results of the multicollinearity and it reports all the variables have Variance Inflation Factor (VIF) to be less than 10 and have tolerance values greater than 0.10. The results suggest the non-existence of multicollinearity among the explanatory variables to affect the regression analysis in line with the position of Wooldridge [26].
|
4.2. First Regression Results
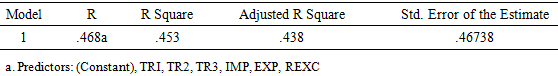
- As already stayed, this study employed time series data from 2007 to 2018 and this involved 11 observations for the regression analysis. Based on Wooldridge [26], the output of regression analysis has columns with different values and interpretations. For instance, the output generates unstandardized and standardized coefficients for the different explanatory variables and the standardized coefficient accounts for contribution and impact of the individual explanatory variable on the dependent variable. The impact of the explanatory variable on the dependent variable is explained by the t-values generated and the significance of the t-values is explained by the p-values. For instance, if t-values have corresponding p-values < 0.01, the variables involved are assumed to be significant at 1% level; whilst t-values having corresponding p-values < 0.05, the variables involved are assumed to be significant at 5% level (Wooldridge) [26]. The first objective of this study examined the impact of tourism (tourism receipts, tourism expenditure, and number of international tourism arrivals) on the hospitality sector’s share to real GDP growth (SHGDP). The first regression analysis was performed in addressing this objective. The results are shown in Tables 2 and 3.
|
4.3. The Impact of Tourism on the SHGDP
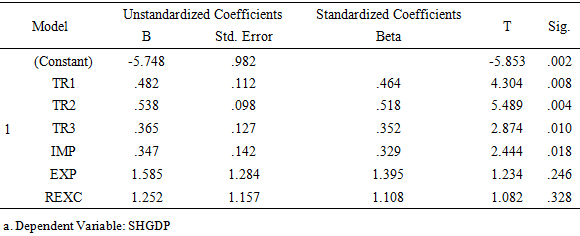
- Table 3 reports the coefficients of the explanatory variables and it shows tourism receipts (TR1) to have coefficient of 0.464 (column 4) and p-value or significance value of 0.008 (column 6) to be significant at 1% level. The positive coefficient implies that tourism receipts had statistically significant and positive relationship with hospitality sector’s share to real GDP (SHGDP) after controlling for imports to GDP, exports to GDP, and real exchange rate. Again, the positive coefficient means an increase of 1% in tourism receipts would increase hospitality sector’s share to real GDP by 0.464 in the long-run. Table 3 reports tourism expenditure (TR2) to have coefficient of 0.518 (column 4) and p-value of 0.004 (column 6) to be significant at 1% level. The positive coefficient suggests that tourism expenditure had statistically significant and positive relationship with hospitality sector’s share to real GDP (SHGDP) after controlling for other variables. Besides, the positive coefficient means that an increase of 1% in tourism expenditure would increase hospitality sector’s share to real GDP by 0.518. Table 3 also reports number of international tourist arrivals (TR3) to have coefficient of 0.352 (column 4) and having p-value or significance value of 0.010 (column 6) to be significant at 5% level. The positive coefficient indicates that the number of international tourist arrivals had statistically significant positive relationship with hospitality sector’s share to real GDP (SHGDP) after controlling for other variables. The positive coefficient is an indication that an increase of 1% in number of international tourist arrivals would increase hospitality sector’s share to real GDP by 0.352.
|
4.4. The Impact of Other Economic Variables on SHGDP
- The study also examined the extent to which other economic variables (imports, exports, real exchange rate) impact on hospitality sector’s share to real GDP Growth. Table 3 reports import to GDP (IMP) to have coefficient of 0.329 (column 4) and p-value of 0.018 (column 6) to be significant at 5% level. The positive coefficient implies import to GDP to have statistically significant positive relationship with hospitality sector’s share to real GDP (SHGDP). The positive coefficient implies an increase of 1% in import to GDP would increase hospitality sector’s share to real GDP by 0.329. As an import-driven nation, the findings about Ghana suggest importation activities have the tendency to stimulate tourism activities. The findings confirm other studies (Bulim et al. [24]; Caglayan et al. [7]; Jaafar et al. [2]; Selimi et al.) [23] which noted that tourism drivers are also trigerred by other determinants of economic growth. For instance, the findings mirror that of Selimi et al. [23] who found tourism determinants such as tourism receipts and tourist arrivals to have positive impact on economic growth measured as income per capita and also found the impact to be stimulated by other economic variables such as imports and FDI. Additionally, this study supports Nasir et al. [27] who observed that economic growth does not depend on only international tourism but also on other related hospitality factors and economic transmission channels such as hotel price index, and the quantum of luxury hotel imports. Likewise, Šimundić et al. [28], and Mazghouni and Goaied [29] found trade openness and foreign direct investments to be transmission channels which stimulated the tourism effect on economic growth. On the other hand, Table 3 reports export to GDP (EXP) and real exchange rate (REXC) to have coefficients of 1.395 and 1.108 (column 4) with p-values greater than the acceptable 5% significance level. The results suggest that export to GDP and real exchange rate to has insignificant impact on hospitality sector’s share to real GDP (SHGDP). Thus, in the Ghanaian context, export to GDP and changes in real exchange rates are not significant transmission channels which stimulate tourism effect on economic growth. This situation could be attributed to local firms’ inability to develop economies of scale to improve on their exporting activities to generate more foreign exchange. Ghana is one country which is import driven, which implies that there is the possibility of high exchange rate volatility adversely affecting the earnings from foreign exchange volatility. Based on the position of Jaafar et al. [2], it can be argued that changes in foreign exchange rate constitute one of the constraints which affect the activities of local investors and exporters in Ghana. However, the results on real exchange rate could not provide evidence to support the tourism-led growth hypothesis. The tourism-led growth hypothesis states that improvement in tourism activities leads to improvement in the foreign exchange earnings of the host country. These earnings are then used to improve goods and services in different sectors of the economy to enhance economic growth (Brida and Pulina) [3]. Nonetheless, this study shows that the real exchange rate has a insignificant impact on economic growth and that this economic variable could not stimulate foreign earnings to improve goods and services to enhance economic growth. What is more is that the present study contradicts previous studies (Jaafar et al. [2]; Jackman [10]; Jenkins and Katircioglu [11]; Zuo and Huang) [12] which tested the tourism-led growth hypothesis and found foreign exchange earnings to stimulate economic growth.
4.5. Second Regression Results
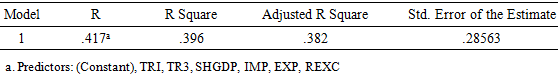
- Moreover, this study assessed the extent to which hospitality sector’s share to real GDP growth and tourism expenditure influence each other. The econometric model employed is shown below and the results are displayed in Tables 4 and 5.

|
|
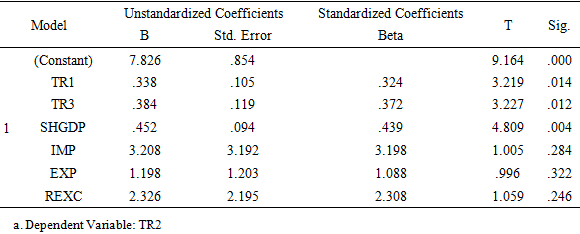
4.6. The Extent to which SHGDP and Tourism Expenditure Impact on Each Other
- From Table 5, it is seen that hospitality sector’s share to real GDP (SHGDP) has coefficient of 0.439 (column 4) and p-value or significance value of 0.004 (column 6) which is significant at 1% level. The positive coefficient implies hospitality sector’s share to real GDP (SHGDP) to have statistically significant and positive relationship with tourism expenditure (TR2). The positive coefficient suggests that an increase of 1% in hospitality sector’s share to real GDP would lead to an increase in tourism expenditure by 0.439. The results also imply that an improvement hospitality sector in Ghana would reflect in tourism expenditure. This means that a relationship exists between hospitality sector’s share to real GDP and tourism expenditure. Thus, improving tourism activities in the hospitality sector will increase tourism spending and this would reflect in the growth of the Ghanaian economy.Table 5 also reports tourism receipts (TR1) and number of international tourist arrivals (TR3) and to have coefficients of 0.324 and 0.372 (column 4) with p-values of 0.014 and 0.012 (column 6) to be significant at 5% level. The positive coefficient indicates that the number of international tourist arrivals and tourism receipts had statistically significant positive impact on tourism expenditure. Besides, the positive coefficient suggests that a 1% increase in the number of international tourist arrivals and 1% increase in tourism receipts would increase tourism expenditure by 0.372 and 0.324 respectively. On the other hand, Table 5 reports export to GDP (EXP), import to GDP and real exchange rate (REXC) to have coefficients of 1.088, 3.198 and 2.308 (column 4) with all p-values greater than the acceptable 5% significance level. The findings imply that import to GDP, import to GDP and real exchange rate to have insignificant impact on tourism expenditure (TR2). The results further suggest that import to GDP; import to GDP and real exchange rate could not provide evidence of reverse relationship with tourism expenditure.
5. Conclusions and Recommendations
- The study provides evidence of tourism drivers such as tourism receipts, tourism expenditure, and number of international tourism arrivals to have statistically significant positive relationship with hospitality sector’s share to real GDP in the context of Ghana. This means that by improving tourism activities, it would increase international tourism arrivals, tourism spending, and tourism receipts and these would reflect in the growth of the hospitality sector and the Ghanaian economy as a whole. It can be suggested that the growth of the economy is key to policy makers and the development of the tourism sector in Ghana can be used as an economic growth strategy. Besides, this research reveals that with the exception of export to GDP and real exchange rate; there is statistically significant positive relationship between imports to GDP and hospitality sector’s share to real GDP of Ghana. It is recommended that new policy directions together with tourism interventions should be provided by the government and industry players in order to improve the tourism sector. For instance, there is the need for new policy direction which would develop and promote Ghanaian cultural activities, tourist centers, and the hospitality sector to make them more attractive to regular tourists and potential ones. Also, the positive relationship between imports to GDP and hospitality sector’s share to real GDP confirm the economic position of Ghana as an import driven nation. There is, therefore, the need for policy makers and other stakeholders of the economy including the Ministry of Finance, BoG, Ministry of Business Development, Ministry of Tourism and Creative Industry, etc. to financially support the business activities of the local companies to enable them expand and develop economies of scale to improve on their exporting activities to generate more foreign exchange.