-
Paper Information
- Paper Submission
-
Journal Information
- About This Journal
- Editorial Board
- Current Issue
- Archive
- Author Guidelines
- Contact Us
Management
p-ISSN: 2162-9374 e-ISSN: 2162-8416
2017; 7(6): 202-208
doi:10.5923/j.mm.20170706.03

Role of Motivation and Policy Factors on Waste Management Performance in Makassar, Indonesia
 Abstract
 Reference
 Full-Text PDF
 Full-text HTML
Ilham Syafey1, Suyadi2, Amin Setyo Leksono3, Lambang Basri Said4
1Doctoral Program of Environmental Science, Postgraduate University of Brawijaya, East Java, Indonesia
2Faculty of Animal Husbandry, University of Brawijaya, East Java, Indonesia
3Department of Biology, Faculty of Mathematics and Natural Sciences, University of Brawijaya, East Java, Indonesia
4Makassar Islamic University, Department of Civil Engineering, Faculty of Engineering, Makassar, Indonesia
Correspondence to: Ilham Syafey, Doctoral Program of Environmental Science, Postgraduate University of Brawijaya, East Java, Indonesia.
| Email: |  |
Copyright © 2017 Scientific & Academic Publishing. All Rights Reserved.
This work is licensed under the Creative Commons Attribution International License (CC BY).
http://creativecommons.org/licenses/by/4.0/

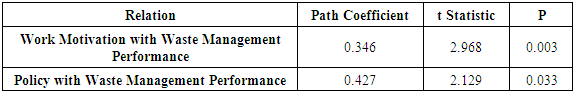
Municipal waste management is still focused on technical efforts, so to solve and manage waste comprehensively need to include non- technical aspects, such as worker motivation, and management policy support. The purpose of this research is to analyze the role of motivation factor of workers and the factor of policy support to the waste management performance in Makassar, Indonesia. The research type is descriptive qualitative, collecting data through a questionnaire from the respondent according to the applicable provision, the result of data tabulation is processed by Structural Equation Modeling (SEM-PLS) method. Result of analysis obtained, that the role of motivation factor of worker to waste management have a coefficient with positive direction. The calculation result shows that the coefficient of path equal to 0.185 with t-statistic amounted to 2.968 (p <0.05), it gives a decision that work motivation have significant effect to waste management performance. Good work motivation will improve waste management performance. While solid waste management policies have a coefficient with a positive direction. The calculation results show that the path coefficient of 0.160 with t-statistics of 2.129 (p <0.05) gives the decision that the waste policy has a significant effect on waste management. A good waste policy on waste management system will improve waste management performance.
Keywords: Motivation, Policy, Performance, Waste
Cite this paper: Ilham Syafey, Suyadi, Amin Setyo Leksono, Lambang Basri Said, Role of Motivation and Policy Factors on Waste Management Performance in Makassar, Indonesia, Management, Vol. 7 No. 6, 2017, pp. 202-208. doi: 10.5923/j.mm.20170706.03.
Article Outline
1. Introduction
- Municipal solid waste management is one of the major environmental problems of most developing countries, though the scale of the problem differs from one country to another country [1, 2]. The problem of waste on earth, in general due to the population growth rate and the flow of migration or the movement of the population between one country to the other countries, both in developed and developing countries. Particularly in Indonesia as a developing country, waste issues are a serious concern, as population growth continues to increase. The waste producing is not balanced with the support of human resources, infrastructure, rule support as well as proper allocation of financing to handle.Indonesia is in a state of waste emergency with 175,000 tons of waste per day, and this continues to grow in line with the annual population growth rate and on the other hand the government together with all parties have not focused to control and solve the waste problem, by balancing the growth of the amount of waste volume products to human resources support, facilities, infrastructure and non-technical aspects support that are proportional [3].Makassar is one of big city in Indonesia, located in South Sulawesi. The general description Makassar has problems of waste management. Makassar is the city of about 1.5 million inhabitants that produce 600 to 800 tons of waste per day, from the data in 2015. That number increased dramatically compared to the previous years. The waste production per person per day about 2.75 to 3.5 liter per person per day (Indonesian National Standard), hence the amount of actual waste is 3.0 liter per person per day if we take the production number per person per day, then the waste volume reaches 4,500 m3 per day, or 1,008 ton per day. This waste volume of handling level achievement, only reaches 60-70% per day or about 3,150 m3 per day, and the remaining 1,350 m3 per day waste that is not handled. The rest of the untreated waste is widespread in the city and partially treated by burning, disposing of the river, canal, drainage, and dumped in the soil. Waste treatment, is the beginning of the emergence of environmental problems in general, especially in urban areas.Based on the results of the previous research, the problem of waste is increasingly and become complex in various aspects, both in technical aspect and non-technical aspect. The result of research has been done in 2014 to 2017. On the technical aspects include several things. Support of facilities and infrastructure is still far from the fulfillment of the amount of production volume of municipal waste per day to the needs of facilities and infrastructure. Human support or management, both the status of civil servant and contract worker, on the aspect of quality and quantity is not sufficient. Financing support for both equipment investment and operational and maintenance financing, the financing between the target and the acquisition has only reached approximately 67.98%, which means deficit to 32.02%. Support for the policy implementation on waste management in the new paradigm has not been able to be applied due to the lack of public understanding generally.The non-technical aspect, covering several things: the support of motivation to the workers has not been maximized, marked by the minimum wage value for the existing contract workers as the spearhead of waste management in the field. The support of community participation is still low as a producer of waste per day, particularly on the aspect of participation of financing operational management services. The behavioral pattern does not yet have awareness of how waste should be treated in relation to the impact it has. Policy support and the rules have not been implemented well and firmly with any sanctions against deviations based on the existing provisions. Performance at the level of waste management services, which influenced especially on the non-technical aspects, only reaches 60-70% per day.Particularly in non-technical aspects, the local government still expects the involvement of the community towards the waste management comprehensively. Community participation in waste management generally has the least cost option and there is a strong case for comprehensively involving community participation in waste management [4]. It is conveyed by the city authorities, the importance of an approach to maximize how the city can participate, behave, supported by policies and foster motivation of the waste collectors through the attention to its existence, through the improvement of basic needs of life, completeness of safety and safety as well as providing health insurance and long term care insurance.Technically, the concept of waste management has been done with various thoughts starting with planning related to the amount of waste volume which involves the population as waste sources. Making a mathematical approach to how much the management facilities need from the waste per day production, and how to prepare the schedule to manage the waste from source to final disposal consistently and continuously. The objective of this study is to analyze the role of motivation factor of workers and the factor of policy support to the waste management performance.
2. Research Methods
2.1. Research Design
- According to the data type review of research approach used in this study is a qualitative approach.The model picture of the relationship between the research variables above shows that in this study there are two exogenous variables (variables that are not influenced by other variables in a relationship model or often known as independent variables), the variables are; motivation Workers (X1) and Waste Management policies (X2), with one endogenous variable (variables that are influenced by other variables within a relationship model or often known as "dependent variable") are the Waste Management Performance (Y3) variable. In modeling, it will involve all indicator variables so that all variables are latent. In accordance with the above relationship model, the data analysis technique to be used in this research is structural equation modeling (SEM), where the independent variable will be divided into a number of arranged blocks.
2.2. Population and Sample
- The population in this research is the people of Makassar. Based on the data collection plan there are two sub-districts of 14 sub-districts, consisting of 21 urban villages of 134 urban villages, each urban village is assigned as many as the respondents that are being targeted on neighborhood block area and the community leaders as well as the urban villages staff, including the Department of Sanitation staff and the staff of Department of Garden that are stated in the sub-district area according to the new provisions, that the urban waste operation is done by each urban villages, including some citizens who are generally as the towns people to participate as the respondents, i.e. students and teachers.
2.3. Data Analysis
- After the research data is collected, the undertaken activities are analyzing research data with data analysis techniques in accordance with the type of research. Data descriptive technique used descriptive statistical analysis. Data analysis used in inferential statistical method in this research is partial least square (PLS). PLS has several advantages compared to other analytical tools: (1) can analyze complex models, (2) data do not need normally distributed, (3) can use small samples and (4) can handle the missing values.This study was analyzed using primary data collected through questionnaires using survey method. The questionnaire of this research consists of questions about four variables or constructs measured by a number of indicators. Each respondent is asked to convey his perceptions of the indicator of the variable by selecting a number from a scale of 1 to 5. Therefore, each construct needs to be tested whether it is valid and reliable.The final analysis in this research is hypothesis testing. The analysis tool used to test the hypothesis is Smart Partial Least Square (Smart PLS) software version 3.2.6. The reason for the use of Partial Least Square (PLS) is that there are several research hypotheses that do not have a solid theoretical basis yet. Another reason is that PLS is able to analyze constructs with reflective and formative indicators [5]. The PLS is a powerful analytical method, because it is not based on many assumptions, the data should not be normally distributed, the sample should not be large, and be able to explain the relationship between the latent variables [6].Another advantage of PLS is that can be used on the data of different types of scales, its capability in managing multi-collinearity problems among the independent variables, and fixed results (robust) despite abnormal and missing data [7].The use of PLS as an analytical method requires several steps of structural equation modeling. The steps of the PLS can be explained as follows:1. Designing a structural model (inner model) is designing relationships between variables (constructs) based on the research hypothesis.2. Designing a model of measurement (outer model) is designing the relationship between latent variables with the indicator. This study uses formative indicators.3. Construct the path diagram.4. At this stage a path diagram is made to illustrate the relationship between latent variables (constructs) both exogenous and endogenous. The path diagram is presented in Figure 1.5. Convert the path diagram into the system of equations. The system of equations shows the relationship between latent variables (inner model) and the relationship indicator with the variable (outer model).
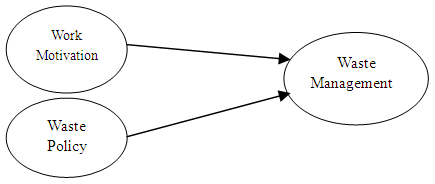 | Figure 1. Concept model between variables |
2.4. Location of Research Study
- The location of the research is Makassar in the South Sulawesi Province, it focused on two sub-districts, namely Makassar and Biringkanaya Sub-district. The focus was on 14 urban villages in Makassar Sub-district and 7 urban villages in Biringkanaya Sub-districts. Research Objects, is the performance of waste management includes the start of the emerge waste to the process of activities ranging from the source of waste incidence to the final dumping place on landfills. Research subject is a source of data that asked for information in accordance with the research problem. As for the data sources in the research is the subject from which the data was obtained [8]. To obtain the right data, it is necessary to determine the respondents who have the competence and in accordance with the needs of the data (purposive), they were the town people and it is focused on the citizens in two sub-districts, as well as the entire of Department of Public Cleanliness and National Environment Agency in Makassar. This study describes how the response of the citizens as the object, viewed from the aspect of workers motivation, which is supported by the factor of management policy if it is correlated with the performance of garbage collectors.
3. Results and Discussion
- This research used SEM PLS model and processed with Smart PLS version 3.2.6 to evaluate research model. Hypothesis testing through two stages namely outer model testing and inner model testing, outer model testing aims at determining the correlation value of latent variables, cross loadings, validity and reliability of constructs and R Square (R2). Inner model testing aims to know the value of path coefficient, inner model T-statistic, and total effect value that indicates the level of variation of independent variable changes to the dependent variable [7]. Model evaluation results are presented in the appendices.
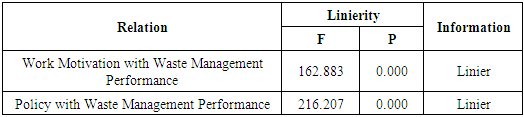
3.1. Statistical Testing of the Linearity Assumptions
- Before performing further evaluation of this analysis, it is necessary to first perform the linearity assumption test, i.e. the relationship between the constructs to be tested whether having a linear relationship or not. Therefore the first step in the SEM PLS model is to test linearity assumptions. The relationship between variables in the analysis of this model is linear. Testing this assumption of linearity test used test of linearity. The linearity assumption in path analysis is only related to structural equation modeling and is not related to hypothesis testing, i.e. the relationship between variables in the structural model is linear. This means that the increase or decrease of variation in the criteria is followed consistently by the increase or decrease of variation on the criterion of the predictor so that the relationship will form a straight or linear line.
|
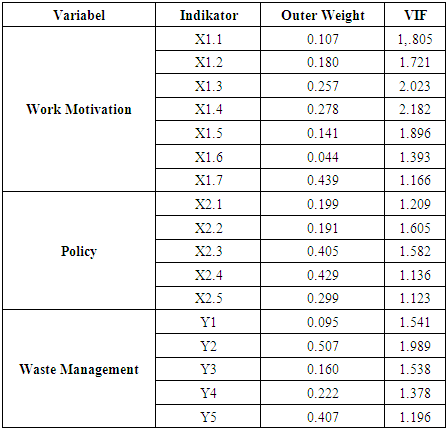
3.2. Construct Validity and Reliability
- The examination of the validity and reliability of the construct on the formative relationship is done using a number of different ways with the reflective latent variable. In a latent construct with a reflective correlation, the test is performed to assess the convergence validity, discriminant validity, and reliability. A model has convergent validity when outer loading values> 0.7; communality> 0.5 and average variance extracted (AVE) > 0.5 [7]. While, in the formative relationship, the indication that is used to assess the items is based on the test results of the significance of outer weight coefficient and the value of variance inflation factor (VIF). All indicators are still used in measuring the latent constructs although their coefficients are tested insignificant provided there is no high multicollineary problem (VIF> 5).The latent variable of work motivation is measured formatively by 7 indicators. All coefficients marked positive and partially tested are not significant (p> 0.05). Significant coefficients of indicators for work motivation include material (X1.1), willingness (X1.3), skill (X1.5) and education (X1.7). VIF values in the range of 1.166 - 2.182 indicate that there is no high multicollinary problem.
|
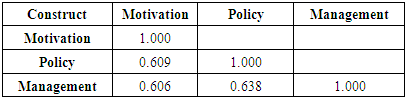
3.3. Testing of Structural Model (Inner Model)
- In the three variables that exist in the model has a correlation coefficient marked positive with the range of 0.510 to 0.664. Correlation coefficient on the relationship between variables is significant, because the critical value of correlation coefficient on the sample size of 350 is 0.105. The following table is the correlation matrix between variables.
|
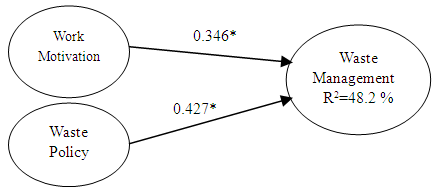 | Figure 2. Hypothesis Model |
|
4. Conclusions
4.1. Conclusions
- This study is analyzing the role of management policy factors on the performance of waste management. Referring to the results of the analysis in the hypothesis model explains that the waste policy is highly implemented on the waste management in Makassar and the significant effect on improving waste management performance. Since the policy support on waste management has an indicator on the reduction of waste volume in the sources of waste, waste management, waste utilization and scheduling transportation as well as the cooperation of other parties. Stages of the policy were arranged based on the stages of management activities started from the reduction of the volume of waste by processing to make it as useful materials, handling waste from the source to the final disposal place, followed by the utilization of waste, the volume of waste that is transported become smaller. In addition the cooperation and participation between the communities and all parties will bring a successful waste management.High motivation of workers is supported by the participation of the community in the form of participation and make changes in community behavior through the delivery and implementation of policies that socialized to the community actively, will create maximum work productivity as a manifestation of the performance of managers in carrying out waste services from the source to the place of final disposal. The disclosure and review of how the role of motivation factors in improving services by involving the community as a form of participation, and the behavior change of the citizens by supporting the waste policies in the context of increasing the capacity of waste management as a form of level performance of waste management for the project of Makasar that is being a city of waste-free and clean city.
4.2. Suggestion
- It is recommended for the local government or the town council especially in Kota Makassar that waste management in the future is expected to be a synergy between technical and non-technical aspects that the workers motivation and policy support can be done consistently and continuously to bring Makassar being a city of waste-free.
ACKNOWLEDGEMENTS
- The author would like to thank Rector of Makassar Islamic University, Director of Graduate School University of Brawijaya, Waste Management City of Makassar who were given permission for the research and a reviewer team who helped in revising the initial manuscript.