-
Paper Information
- Paper Submission
-
Journal Information
- About This Journal
- Editorial Board
- Current Issue
- Archive
- Author Guidelines
- Contact Us
Management
p-ISSN: 2162-9374 e-ISSN: 2162-8416
2017; 7(3): 131-135
doi:10.5923/j.mm.20170703.05

Society’s Behavior of Personal Transportation Utilization in Makassar South Sulawesi Indonesia
 Abstract
 Reference
 Full-Text PDF
 Full-text HTML
Lambang Basri Said, Maryam Hafram, Abdul Hafid Hasim
Department of Civil Engineering, Faculty of Engineering, Indonesian Muslim University, Makassar, Indonesia
Correspondence to: Lambang Basri Said, Department of Civil Engineering, Faculty of Engineering, Indonesian Muslim University, Makassar, Indonesia.
| Email: |  |
Copyright © 2017 Scientific & Academic Publishing. All Rights Reserved.
This work is licensed under the Creative Commons Attribution International License (CC BY).
http://creativecommons.org/licenses/by/4.0/

This study aims to provide an overview of the most dominant variable affecting individuals in the use of private transportation (cars). The population in this study was the users of private car as many as (N = 200) respondents scattered around Makassar. The independent variables consisted of attitude (X1), subjective norms (X2) and perceived behavioral control (X3), while behavior (Y1) as the dependent variable. Moreover, the sampling technique used in this study was purposive random sampling and the data were analyzed by using descriptive analysis and multiple linear regression. The data analysis was processed by using SPSS 22. The results showed that the attitude variable (X1) is the most dominant variable and has an influence towards behavior variable compared to other independent variables. Private cars are still seen as a symbol of success and a reliability of an individual. It means that it is also considered to increase the prestige or social status of the people despite its transportation function which is safer and more convenient.
Keywords: Behavior, Private car, Symbol
Cite this paper: Lambang Basri Said, Maryam Hafram, Abdul Hafid Hasim, Society’s Behavior of Personal Transportation Utilization in Makassar South Sulawesi Indonesia, Management, Vol. 7 No. 3, 2017, pp. 131-135. doi: 10.5923/j.mm.20170703.05.
Article Outline
1. Introduction
- Makassar, the capital of South Sulawesi, is one of the major cities in Indonesia with the economic growth that is also one of the best in Indonesia. With such conditions, the problems faced in the upcoming years are the growth and increasing number of private vehicles used by the people. With the rapid development of this condition, it is still not balanced with the improvement of road infrastructure so that it is feared to create a traffic jam in Makassar. In Makassar, the number of motorcycles is increased by 13% - 14% per year while private cars are increased by 8% - 10% per year. Unfortunately, the growth of street infrastructure is only by 0.001% per year. The number of both motorcycles and cars in 2015 has reached by 2.4 million units (motorcycles by 1.1 million and cars by 1.3 million) which are actually higher than the total population of 1.7 million [1].The growth in the number of private vehicles, especially in Makassar, will continue to increase. It is actually supported by the marketing system of vehicle manufacturer that provides low payment to purchase their products with a credit system. The reason why people prefer car or motorcycle as a means of transportation is that it provides comfort and security, enhances their prestige, and provides privacy [2].With the uncontrolled use of private cars, it will certainly cause serious problems for the environment, urban life, and accessibility in various destinations. Besides the solutions offered by technology, the most effective solution to this transportation problem is a reduction in the volume of traffic through the changes of user’s behavior towards private cars [3].In correlation to that, it requires an adequate knowledge of one's intention to use the private car in his/her daily activities. It is expected to work like a policy that aims to manage the travel demand. Also, this will become very effective if the community (a subject) is directed to the factors which significantly affected the level of private cars utilization [4]. The use of private vehicles is driven by the lack of good public transportation, both in terms of networks, facilities, infrastructure, and so forth. The low quality of service in terms of safety, comfort, appropriateness, ease, and efficiency of public transport is essentially given an uncomfortable feeling to the user, by that, this will encourage the people to prefer private vehicles [5]. This study aims to provide an overview of the most dominant variable affecting individuals in the use of private transportation (cars).
2. Research Methods
- The research was conducted in Makassar with the population of residents who use private cars for his/her daily activities. The sampling technique used in this study was a purposive random sampling [6], and there were 200 respondents scattered around Makassar. The independent variables consisted of attitude (X1), subjective norms (X2) and perceived behavioral control (X3), while behavior (Y1) as the dependent variable [7]. Primary data and information were obtained from questionnaires, interviews, observations, and documentations. On the other hand, there was also a data collection instrument used to collect data which in this study is in the form of checks lists, questionnaires (open/closed questionnaires), interviews, and camera photos [8]. The analysis of the data was carried out with a descriptive analysis by describing or depicting the collected data without having to make conclusions or public generalizations [9]. Then, to determine the nature and strength of the relationship between two or more variables and to predict the value of the unknown variable, a multiple linear regression analysis is used through an association with the data from past observations (either on those variables or other variables) [10]. Both of the data analyses are processed with the help of SPSS 22 for windows.
3. Results and Discussion
3.1. Classic Assumption Test
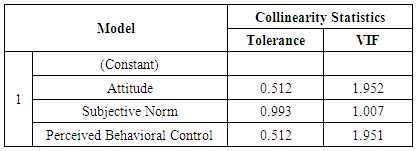
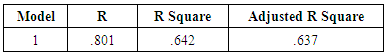
- To avoid a biased regression model or BLUE regression model (Best Linear Unbiased Estimator), it is necessary to test the classic assumption in the first place [11]. Classic assumption test consists of a normality test, heteroscedasticity test, and multicollinearity test.Figure 1a showed that one of the easiest ways to see the residual normality was to look at the histogram graph that compares the observed data with the near-normal distribution (bell shape) even though sometimes it could be misleading especially for the small sample size.Figure 1b showed the normal distribution formed a straight diagonal line and the data plot was compared with the diagonal line. If the data were spread normally around the diagonal line, a regression model was considered to meet the assumptions of normality. Otherwise, if the data were spread far from the diagonal line and/or do not follow the direction of the line, the regression model was seen to not fulfil the assumptions of normality [12].Figure 1c showed a heteroscedasticity test that is used to determine whether there was a deviation in the model that is caused by a different interference in between variants of the observations. The heteroscedasticity test was done by observing the scatter plot graph with the requirements. If the dots have formed a specific regular pattern, this indicated that there was a problem in the heteroscedasticity and vice versa [13].The figure explained that the histogram graph gave a pattern of the data distribution or the residual value with a normal distribution (bell shape). While in the normal plot graph, we can see the data (in the form of the dots) spread around the diagonal line and follow the direction of the diagonal so that the model meet the assumption of normality. If the data are spread far from the diagonal line, the model is believed to not meet the assumptions of normality. Furthermore, in scatterplot graph, it is shown that the points do not form a particular regular pattern and that there is no clear pattern shape. The third graph here indicated that the regression model has met the assumptions of normality or the residue of the model can be considered to be a normal distribution.
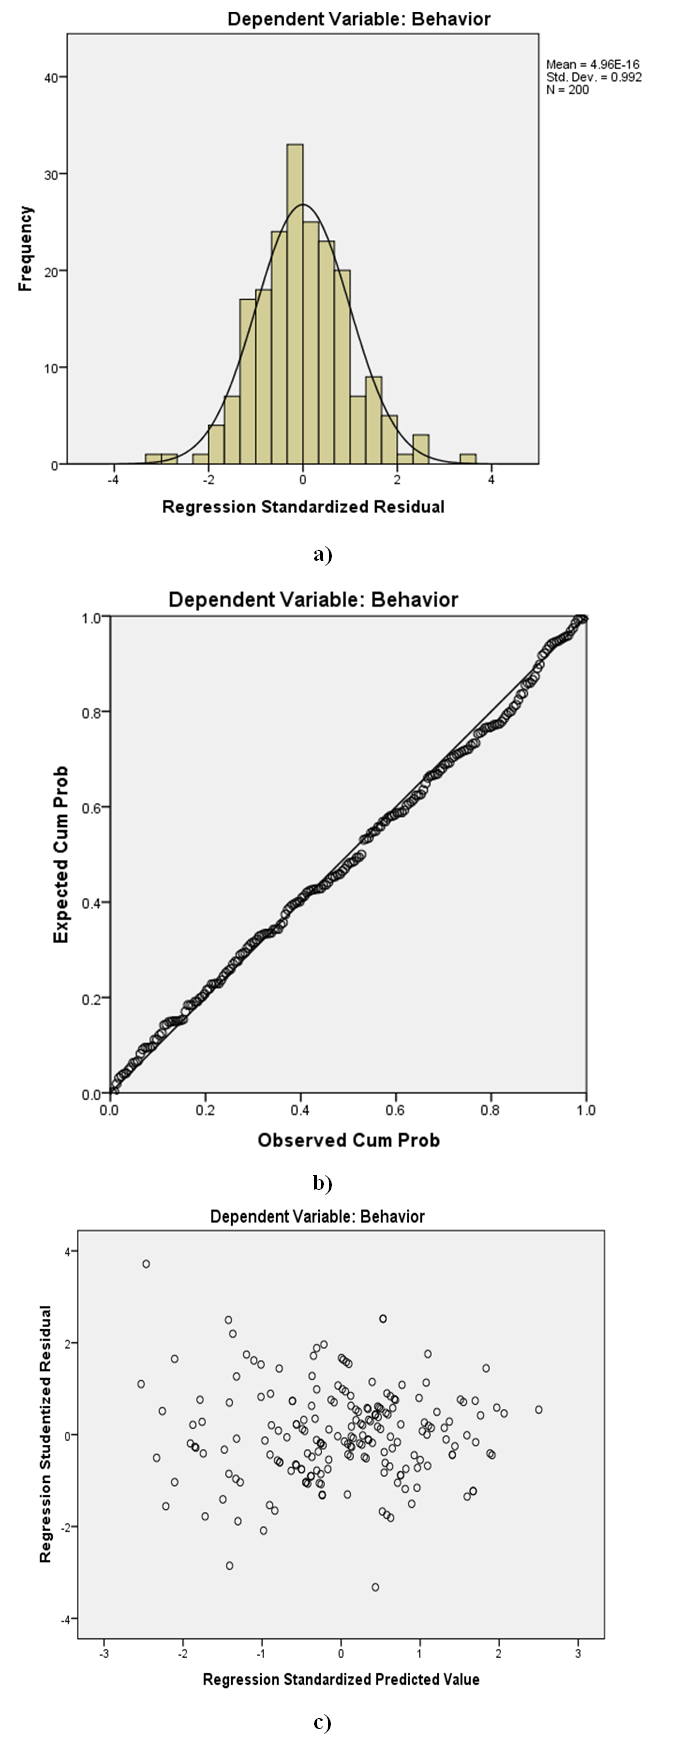 | Figure 1. Classic Assumption Test; a) Residual Normality Histogram; b) P-P Plot Regression Standardized Residual Normality; and c) Scatter Plot Heteroscedasticity |
3.2. Multicollinearity
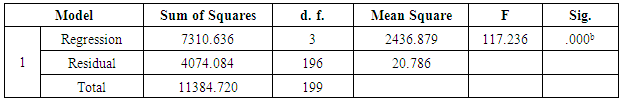
- Multicollinearity test was used to test the relationship of the model whether it was complete or almost complete in between independent variables. By that, it was difficult to separate the influence of the independent variables individually from the dependent variable. This test was carried out to determine whether the independent variables in the regression equation are correlated to each other [12]. To detect a multicollinearity, we need to look at the value of tolerance and the value of Variance Inflation Factor (VIF), where the variable is said to have multicollinearity problems if the value of tolerance was less than 0.10 or if the VIF value is greater than 10 [13].
|
|
|
|
3.3. Descriptive Attitude in the Use of Private Cars
- From the total of 14 questions related to public attitudes toward the use of private cars, the results showed that 5% of them strongly disagrees, 16% disagree, 38% still hesitate, 27% are agreed, 14% strongly agreed. These results indicated that there is a tendency of using private cars at the level of confusion/hesitation.
3.4. Descriptive Subjective Norms in the Use of Private Cars
- From the total of 13 questions related to the public subjective norms toward the use of private cars, it was noticed that there was a very low result in the category of subjective norm by 6%, low category of subjective norm by 11%, medium category of subjective norm by 28%, high category of subjective norm by 37.5%, and very high category of subjective norm by 17%. These indicated that there was a high level of subjective norms tendency in the use of private cars. Subjective norm arose from perception about the private cars. This situation is caused by society value and philosophy. We found that the behavioral response is determined by subjective norms that exist within the concerned individual in the community. This result supports by Ajzen’s theory that behavioral response is determined by intention and subjective norms of society [16]. Generally people see the value of the vehicle based on two aspects, the material value that useful for physical and vital value that supports the activity of a person. This subjective norm is in line with Notonegoro's theory which divides the social value into three values, namely the material, the vital, and the spiritual values [17]. Other than that people also have a perception that the car can improve the vertical mobility is the improvement of one's social status [18].
3.5. Descriptive Perceived Behavioral Control in the Use of Private Cars
- From the total of 14 questions related to perceived behavioral control in the use of private cars, the result showed a category of less agreed perceived behavioral control by 2%, agreed perceived behavioral control by 63.5%, very-agreed perceived behavioral control by 34.5%. By that, this proves that there was a tendency of perceived behavioral control in the use of private cars at agreed-level.
3.6. Descriptive Behavior in Use of Private Cars
- From the total of 12 questions related to the behavior in the use of private cars, there was 29.5% of the respondents agree and 70.5% strongly agrees. Thus, there was a trend in the use of private cars at the level of strongly agree.
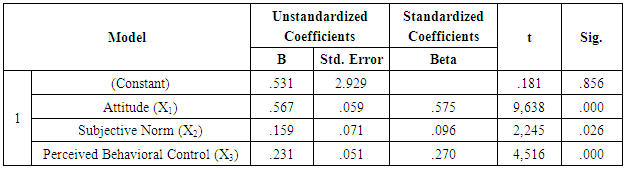
3.7. The Influence of Attitudes towards the Behavior of Private Car users
- If the significance value was less than 0.05, then there was a significant difference between the variables. The results of the analysis showed the value of Unstandardized Coefficients B from attitude variable (X1) to behavior variable (Y) by +0.567 as well as the significance value by 0.000. Based on the results above, the attitude variable has a positive and significant effect on behavior variable in the use of the private car. This also can be interpreted that the higher value of attitude, the higher the public's behavior. The attitude of the individual in using the private car was due to the desire of more comfortable, safe, and quick transportation process. The private car as a symbol of reliability and success is able to increase the prestige in the society. The geographical conditions of Makassar are divided into two seasons, summer and rainy in which this becomes one of the considerations of the individuals and society in using the private car as their main mode of transportation.
3.8. The Influence of Subjective Norms towards the Behavior of Private Car Users
- If the significance value was smaller than 0.05, it was no doubt that there is a significant difference between the variables. The results of the analysis showed the value of Unstandardized Coefficients B from subjective norms variable (X2) to behavior variable (Y) by 0.159 with the significance value of 0.026. Based on the results, the subjective norms variable has a positive and significant effect on behavior variable in the use of the private car. In other words, the higher the subjective norms, the higher the public’s behavior. The intention and perceived behavioral control affected the people’s behavior. However, in general, the intention and perceived behavioral control did not have a significant relationship to each other. This happens because each individual has a complete control towards the displayed people’s behavior [19]. A different result is shown by the perceived behavioral control that has a positive and significant relationship to people’s behavior where in this case is the behavior of private car users in Makassar.
3.9. The Influence of Perceived Behavioral Control towards the Behavior of Private Car Users
- If the significance value is smaller than 0.05, it was no doubt that there is a significant difference between the variables. The results show that the value of Unstandardized Coefficients B from perceived behavioral control variable (X3) to behavior variable (Y) is by +0.231 with the significance value of 0.000. By that, we can say that the perceived behavioral control variable has a positive and significant effect on behavior variable in the use of the private car. This also means that a high perceived behavioral control will make the public’s behavior to be higher.The results indicated that the value of attitude variable is 0.567 or 56.7% in which it was higher than the variable of subjective norms (0.159 or 15.9%) and perceived behavioral control (0.231 or 23.1%). Although it was numerically higher than the attitude variable, this did not mean that we did not consider the results of the subjective norms and perceived behavioral control in influencing the people’s behavior. There is no significant change in the behavior of private car users. Users will always be free to use their own cars in accordance with their will. This transportation means is also strongly correlated to how the freedom and comfort are gained during the use [20].Private car users are also believed to have a significant contribution to the improvement of their lives quality. The use of private cars may not easily be reduced because not only it improves the quality of life but also it fulfills the important social values. Indeed, this assumption applies only to those who frequently use their cars. It would be better if the quality of public transportation can be improved in order to make the private car users switch to public transportation; private car users can be reduced. It is very likely could improve their quality of life, not only because of the personal and social significance of public transportation, but also the quality of mental and urban environment which probably will be increased significantly [21].The effect of subjective norms to people’s intention is seen to be more dominant than the attitude. It is felt that the social support has played an important role in the decision-making process of not using private cars but switch to use public transportation. The changes in behavioral outcomes such as "cheap", "fast", or "comfortable" is noted to not only appear in attitude but also in the subjective norms. Actually, the attitude and social support are related to the use of specific transportation mode which seems to be colored by various types of cognitive beliefs simultaneously [22].
4. Conclusions
- Based on the results and discussion above, we finally can pull out a conclusion that:1. There is a positive and significant influence between the variable of attitude, subjective norms, and perceived behavioral control towards the behavior of private car users in Makassar.2. The variable of attitude is more dominant in influencing the behavior of private car users in Makassar compared with the variable of subjective norms and perceived behavioral control.3. The perception of private car users in Makassar is generally considered as a symbol of success and individual’s reliability which also able to increase the society’s prestige or class as well as the mode of transportation that is more convenient and safer to use.
ACKNOWLEDGEMENTS
- The author would like to thank the Head of Department of Public Work of Makassar City, Dean of Faculty of Engineering Makassar Islamic University, and team of Reviewer from of Postgraduate Program, Brawijaya University who helped in revising the initial manuscript.