-
Paper Information
- Next Paper
- Paper Submission
-
Journal Information
- About This Journal
- Editorial Board
- Current Issue
- Archive
- Author Guidelines
- Contact Us
Management
p-ISSN: 2162-9374 e-ISSN: 2162-8416
2016; 6(6): 185-190
doi:10.5923/j.mm.20160606.01

Critical Social Determinants of Patients’ Satisfaction in Busia County Referral Hospital, Kenya
 Abstract
 Reference
 Full-Text PDF
 Full-text HTML
Martin Mwangi Kimani1, David Omondi Okeyo2, David Sang3
1Department of Public Health and Community Development, Maseno University, Maseno Township, Kenya
2Department of Nutrition and Health, Maseno University, Maseno Township, Kenya
3Department of Biomedical Sciences and Technology, Maseno University, Maseno Township, Kenya
Correspondence to: Martin Mwangi Kimani, Department of Public Health and Community Development, Maseno University, Maseno Township, Kenya.
| Email: |  |
Copyright © 2016 Scientific & Academic Publishing. All Rights Reserved.
This work is licensed under the Creative Commons Attribution International License (CC BY).
http://creativecommons.org/licenses/by/4.0/

Patients have specific desires for services when they visit hospitals. However, inadequate attention to their needs may result in patients’ dissatisfaction. Preliminary reports indicated patients’ dissatisfaction with outpatient healthcare services provided at Busia county referral Hospital. This facility also lacked a routine system for assessing patients’ satisfaction with the services rendered. The study aimed to assess the levels and individual determinants of client satisfaction with outpatient healthcare services at Busia County Referral Hospital using a cross-sectional study. Systematic random sampling method was used to attain a sample of 400 respondents. A pre-tested structured questionnaire was used to conduct interviews. Descriptive statistics, principal axis factoring and multiples regression was adopted for analysis. Approximately 84% of the respondents reported to be satisfied with outpatient healthcare services. Respondents’ socio-demographic characteristics accounted for 8.8% of the variation in general outpatient satisfaction. Age of the respondents, place of residence, gender and marital status emerged as significant predictors of general outpatient satisfaction (p<0.05). The study concludes and recommends that although majority of respondents reported satisfaction with outpatient healthcare services, the hospital service providers should work hard, to win the interests of the patients and have an environment that better fits the expectations of all patients regardless of their age, gender, marital status and place of residence.
Keywords: Patient satisfaction, Outpatient, Healthcare services, County referral hospital
Cite this paper: Martin Mwangi Kimani, David Omondi Okeyo, David Sang, Critical Social Determinants of Patients’ Satisfaction in Busia County Referral Hospital, Kenya, Management, Vol. 6 No. 6, 2016, pp. 185-190. doi: 10.5923/j.mm.20160606.01.
Article Outline
1. Introduction
- Patient satisfaction is a key criterion by which the quality of health care services is evaluated [26]. It can be defined as a state of pleasure or contentment with an action, event or service, especially one that was previously desired [11]. In medical care, patient satisfaction can be considered in the context of patients’ appraisal of their desires and expectations of health care. Patient satisfaction may be influence by individual related factors with some attempts made to empirically explore this domain of health care practice. Age, gender, ethnicity, place of residence, occupation, level of education and socio-economic status are some of the important variables that predict patients’ satisfaction patient demographic and clinical characteristics including age, health status and severity of illness [27, 10]. Older patients seem to be more satisfied than younger ones [19]. Educational level was found to be the main socio-demographic factor associated with patient satisfaction [6].As regards to patients’ socio-economic status, those who are well-off have been shown to rate satisfaction about 5% higher than those with lower socio-economic status [27, 17]. Other factors which may determine patients’ satisfaction include palace of residence. A study was carried out in Toronto, Canada, to investigate the importance of place of residence in patient satisfaction [13]. From the results, patients who lived outside Toronto were consistently more satisfied than patients who lived inside Toronto when both types of patients were hospitalized in Toronto. Other studies have shown that patients hailing from a rural background express satisfaction at about 20% higher than those coming from an urban background [23]. This suggests that where patients live has a small but potentially important impact on how they rate their care.As far as gender is concerned, satisfaction depends on what aspect of care is in question. Female patients are more prone to be dissatisfied with nursing care [27]. For female patients, being seen by a female healthcare provider is associated with higher perceived quality, while for male patients; time and money spent for travel to the health facility are negatively associated with perceived quality [14]. This could be due to the fact that female patients feel free to open up to female healthcare workers on issues affecting their health especially reproductive health. However, for overall patient satisfaction, gender has not been found to correlate with the patient satisfaction indices [19].Somehow it appears that many factors have been put to test though it is not clear which critical individual factors play a major role in mix of array of factors and uniqueness of setting.
2. Materials and Methods
- The study was carried out at Busia County Referral Hospital. It is located in Busia town, in Busia County, in Kenya’s Western region, approximately 268 miles (431 kilometers), by road west of Nairobi, Kenya’s capital city. An institution based cross- sectional analytical design was utilized. The study population comprised of 6,554 patients who visited the Busia County Referral Hospital for treatment during the study period. Fisher’s method was used in sample size determination using the formula [8], based on the following assumptions: 50% of the patients would report being satisfied with the outpatient services provided (this is because there were no prior published studies on patient satisfaction at Busia County Referral Hospital or any other similar setting); A 5% level of statistical significance; A target population of approximately 6,554 patients, the highest number treated in a month over the last 3 years; and A 10% non-response rate adjustment.The formula was: n = z2pq÷d2 Where; n=desired sample size (if the target population is greater than 10,000); z = the standard normal deviation at the required confidence level (in this case 1.96); p= the proportion in the target population estimated to have the existing variable being measured; q = 1-p; d = the level of statistical significance set; The sample size for a population more than 10,000 would thus be; n = (1.96)2(0.5) (0.5) ÷ (0.05)2 = 384 patients. Since the targeted population was below 10,000 (the highest number of patients attended to in a month over the last two years was 6,554), the final sample size (nf) was then calculated as follows: n f = n ÷ {1+ (n/N)}. Where; n f = desired sample size (when target population is less than 10,000); n = desired sample size (when target population is greater than 10,000); N = the desired sample size (target population). Therefore, n f = 384 ÷ {1+ (384/6554 =362.75. Adjusting for non-response at 10% gave a required sample size of 399, which was approximated to 400. Systematic random sampling method was used to select respondents. The approximate target population of 6,554 patients was divided by the required sample size, 400 to get the sampling interval of 16. The first patient was selected at random and every 17th patient who met the inclusion criteria was interviewed until the total number of 400 patients was reached. The research process utilized a structured questionnaire. The dependent variable was “Client satisfaction with outpatient healthcare services at Busia County Referral Hospital”. Individual determinants included age, gender, place of residence, employment status, and highest level of education attained, marital status and health status. Gender; was recorded as either male or female. Age; was recorded into clusters of 18-25 years, 26-35 years, 36-45 years, 46-55 years, 56-65 years and over 65 years. There was also a record for those who did not know their age. Highest level of education attained was indicated as no formal schooling, primary education, secondary education, post-secondary education, college education or university education. Employment status was indicated as permanent employment, casual employment, self-employed or unemployed. Place of residence was a record of respondents’ place of residence was done in an attempt to approximate the distance from the health facility and whether it was within Busia town or outside.Factor analysis was carried out to identify factors that explained most of the variance observed in the population with regard to each scale. Multiple linear regression analysis for identifying determinants of outpatient satisfaction at the healthcare facility was done. A significance level of 0.05 was used in all cases. Factor analysis was employed for all Likert scale instruments to extract factor(s) representing each of the scales and have factor scores, which facilitate treatment of the variables as continuous during further analysis. During all factor analysis procedures, principal axis factoring with Eigen value greater than or equal to one extraction and Varimax rotation methods were employed. Whenever the scales had more than one factor extracted the factors were renamed using appropriate abbreviations according to the items contained in the factor extracted.
3. Results
3.1. General Satisfaction
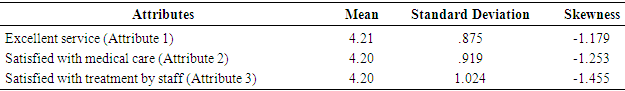
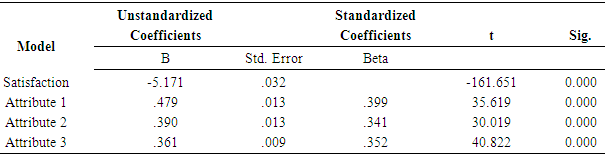
- There were significant differences for each of the three items extracted as key measures of general satisfaction with outpatient healthcare services when the respondents who were satisfied and those who were dissatisfied were compared (p<0.5). The study assumed that the expected level of satisfaction with outpatient services was at 50% in the study population. In order to address specific objective which sought to determine the general level of patient satisfaction with outpatient healthcare services in Busia County Referral Hospital, Kenya, three items were tested as measures of overall satisfaction. These included attribute 1 (the service I have received is excellent), attribute 2 (I am satisfied with the medical care I received), and attribute 3 (I feel satisfied by the way I was treated by staff). These items were subjected to hierachical regression to establish which items best explained general satisfaction with outpatient healthcare services. Descriptive statistics were run for all the items to assess for the accuracy of entry of data, mean score for each item and normality. High means above average were recorded across all item measures (Table 1).
|
|
3.2. Relationship between Socio-Demographic Factors and overall Outpatient satisfaction
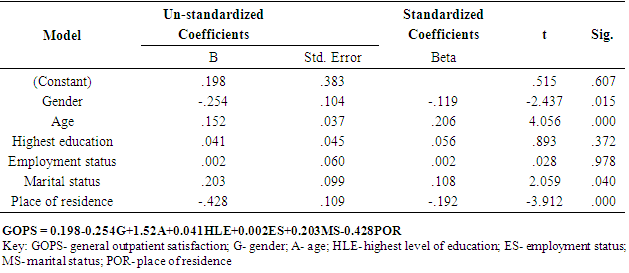
- Simple regression analysis was performed in order to determine the importance of each element/variable in the predictive model. Gender of the respondent (G) could only account for 1.7% (R2=0.017, F=6.968, p<0.05) of the variation in general outpatient satisfaction. The difference between R2= 0.017 and adjusted R2=0.015 is 0.002 and shows that the suggested model generalizes quite well as the adjusted R2 is too close to R2. Shrinkage of less than 0.5 depicts that the validity of the model is very good [7]. The other variations in general outpatient satisfaction i.e. 98.3% were explained by other external factors outside the model. After addittion of the second predictor, age of the respondent (A), the model explained 4.0% (R2=0.040, F=8.205, p<0.05) of the variation in general outpatient satisfaction. The other variations in general outpatient satisfaction i.e. 96.0% were explained by other external factors outside the model. The difference between R2=0.040 and adjusted R2= .035 is 0.005, again showing that the suggested second model can be used to generalize quite well as the adjusted R2 is too close to R2. This further confirms the goodness of the validity of the model as this shrinkage of 0.005 is well below the recommended shrinkage cut off value of 0.5 by Field (2005). After inclusion of the third predictor variable, highest level of education (HLE), the model explained 4.4% (R2=0.044, F=5.950, p<0.05) of the variation in general outpatient satisfaction. The difference between R2 and adjusted R2 is 0.008 which was well below the recommended shrinkage cut off value of 0.5. After the addition of the fourth predictor, employment status (ES), the R2 value was still at 0.044 which explained 4.4% of the variation in general outpatient satisfaction. The difference between R2 and the adjusted R2 is 0.009 and this was way below the recommended shrinkage cut off value of 0.5. Upon the inclusion of the fifth predictor variable, marital status (MS), the model explained 5.2% (R2=0.052, F=4.255, p<0.05) of the variation in general outpatient satisfaction. The other variations in general outpatient satisfaction i.e. 94.8% were explained by other external factors outside the model. The difference between R2 and adjusted R2 was 0.012, again showing that the suggested fifth model can be used to generalize quite well as the adjusted R2 is too close to R2. This further confirms the goodness of the validity of the model as this shrinkage of 0.012 is well below the recommended shrinkage cut off value of 0.5 by Field (2005). When the last predictor variable was included, i.e. place of residence (POR), the model could explain 8.8% (R2= 0.088, F=6.226, P<0.05) of the variation in general outpatient satisfaction. The other variations in general outpatient satisfaction, i.e. 91.2% were explained by other external factors outside this model. The difference between R2 and adjusted R2 was 0.014, suggesting that the sixth model can be used to generalize quite well as the adjusted R2 is too close to R2. This again confirms the goodness of the validity of the model as this shrinkage of 0.014 is well below the recommended shrinkage cut off value of 0.5 [7]. An attempt to discriminate the factor competitiveness was executed based on standardized regression beta weights and this suggests that all the variables except highest level of education and employment status make a significant contribution to the model as they have significant t-values. Table 3 outlines that the most competitive factor was age (beta=0.206; t=4.056, p<0.05) followed by place of residence (beta=-0.92; t=-3.912, p<0.05), gender (beta=-0.119; t=-2.437, p<0.05) and marital status (beta=0.108; t=2.059, p<0.05) in that order. This model competitive test ruled out highest level of education and employment status as key predictors of patient satisfaction.
|
4. Discussion
- The perceived level of patient satisfaction with outpatient services in the health facility was measured as an outcome variable. Three items were investigated in order to assess the level of overall satisfaction with outpatient healthcare services offered at Busia district hospital. There was significant difference for all the three items extracted as key measures of general satisfaction with outpatient healthcare services between the respondents who were satisfied and those who were dissatisfied. The study assumed that the expected level of satisfaction with outpatient services was at 50% in the study population. Further analysis indicated that there was significant difference between the expected level of satisfaction and the observed level of satisfaction for all the three attributes. This implies a much higher level of satisfaction with outpatient healthcare services at Busia district hospital than expected. This is in agreement with several studies, [21, 14, 16, 5], that most patients report satisfaction with the care they receive both in public and private hospitals.Past research has found that there are few consistent relations between socio-demographic characteristics and patient satisfaction levels, even for variables such as gender and age [3 and 4]. However, results of the present study suggest that reliable relationships do exist between patient satisfaction and certain socio-demographic factors. These socio-demographic factors accounted for 8.8% of the variation in general outpatient satisfaction Furthermore, age of the respondents emerged as the most important predictor of general outpatient satisfaction since it had the highest beta value. Place of residence of the respondents was the second most important predictor followed by gender and finally, marital status. These findings are in line with those of other researchers that socio-demographic factors are important determinants of patient satisfaction [7, 17, 13]. Highest level of education and employment status did not make a significant contribution in determining general outpatient satisfaction since the two had significant values of more than 0.05.Age of respondents emerged as the most important predictor of general outpatient satisfaction. This is consistent with the results of other studies [23, 2, 15], that age is a strong predictor of patient satisfaction with healthcare services. These studies have also found that older patients report higher satisfaction as compared to younger patients. Older patients have lower expectations while seeking healthcare services and therefore tend to be more satisfied. These results contradict other studies that have found age to be an insignificant determinant of patient satisfaction with healthcare services [9]. Place of residence appeared to be the second most important predictor of patient of general outpatient satisfaction. This mirrors the results of other studies [9, 18], that place of residence is a significant predictor of patient satisfaction. Patients living in towns have been found to be more satisfied than those who reside in rural areas [18]. This can be explained by the proximity of healthcare services and infrastructure.The third most significant predictor of general outpatient satisfaction was respondent’s gender. These results are consistent with those of other researchers [24, 12, 2], that there is significant association between overall patient satisfaction and respondent’s gender. Furthermore, female patients have been found to be lesser satisfied with healthcare services provided by healthcare providers as compared to male patients. Marital status emerged as the fourth most important predictor of general outpatient satisfaction. Several studies have found marital status to be statistically associated with satisfaction factor score [1, 5]. Single respondents have been found to be less satisfied compared to their married counterparts [5]. On the contrary, a different study revealed that single respondents were more satisfied with healthcare services as compared to married respondents [1].
5. Conclusions
- Patient satisfaction is an increasingly important issue, both in evaluation and the shaping of health care. In addition, patient evaluations can help to educate health care providers about their achievements as well as their failure, assisting them to be more responsive to patients’ needs. In the current study, over half of the study participants were satisfied with the overall health care services. The predictive individual factors identified in this study were age, gender, marital status and place of residence of the respondents. Although majority of respondents reported satisfaction with outpatient healthcare services, the service providers in the hospital facility should work hard, to win the interests of the patients and have an environment that better fits the expectations of all patients regardless of their age, gender, marital status and place of residence.