-
Paper Information
- Previous Paper
- Paper Submission
-
Journal Information
- About This Journal
- Editorial Board
- Current Issue
- Archive
- Author Guidelines
- Contact Us
Management
p-ISSN: 2162-9374 e-ISSN: 2162-8416
2016; 6(4): 113-135
doi:10.5923/j.mm.20160604.03

Mutual Funds in India: Evolution, Significance and Need for Study in Reference to ELSS Mutual Funds
Seema Sharma, M. A. Khan, R. K. Srivastava
Department of Finance, Sydenham Institute of Management Studies, Research & Entrepreneurship Education (SIMSREE), Mumbai, India (University of Mumbai)
Correspondence to: Seema Sharma, Department of Finance, Sydenham Institute of Management Studies, Research & Entrepreneurship Education (SIMSREE), Mumbai, India (University of Mumbai).
| Email: |  |
Copyright © 2016 Scientific & Academic Publishing. All Rights Reserved.
This work is licensed under the Creative Commons Attribution International License (CC BY).
http://creativecommons.org/licenses/by/4.0/

A large number of investment avenues are available for investors in India. Risk and return are the major issues which an investor faces to maximize his returns while choosing investing avenues depending on his objectives, preferences and needs. The advent of mutual funds has helped in garnering the investible funds of this category of investors in a significant way. Mutual fund is one of the most viable investment options for the small investor as it offers an opportunity to invest in a diversified, professionally managed basket of securities at a relatively low cost. Mutual funds offer different schemes for different investment objectives. ELSS funds are one of the best avenues to save tax; also the investor gets the potential upside of equity exposure. Indian investors have little information to take prudent investment decisions. Such information drought is the breeding ground for misguidance, leading the investor to opt for a particular scheme without an in-depth analysis, resulting in dissatisfaction over fund performance. The present paper aims to identify and address this basic issue in detail, covering the history of mutual fund evolution, their significance for the small investor and the need for study of mutual funds and the ELSS funds. The study aims to benefit the tax-burdened small investor who is barely financially literate and has little time (or energy) to research before buying a fund.
Keywords: Mutual fund, ELSS, Investor, Financial market, Risk, Return, Performance
Cite this paper: Seema Sharma, M. A. Khan, R. K. Srivastava, Mutual Funds in India: Evolution, Significance and Need for Study in Reference to ELSS Mutual Funds, Management, Vol. 6 No. 4, 2016, pp. 113-135. doi: 10.5923/j.mm.20160604.03.
Article Outline
1. Introduction
1.1. Indian Financial System
- Financial services sector is the nucleus of the growth model designed for the economic development of a country. The financial services sector plays a crucial role in the process of economic development. The Indian financial system can be broadly classified into the formal (organized) financial system and the informal (unorganized) financial system. The formal financial system comes under the purview of the Ministry of Finance (MoF), Reserve Bank of India (RBI), Securities & Exchange Board of India (SEBI) and other regulatory bodies. The informal financial system consists of individual money lenders, pawn brokers or groups of persons operating as private funds or financial intermediaries such as chit funds. In India the spread of banking in rural areas has helped in enlarging the scope of the formal financial system. Formal financial system consists of four segments viz. financial institutions, financial markets, financial instruments and financial services. Financial institutions are intermediaries that mobilize the savings and facilitate the allocation of funds in an efficient manner and are classified as banking and non-banking financial institutions. Financial markets are a mechanism enabling participants to deal in financial claims. Money market and capital market are the organized financial markets in India. Money market is for short term securities while capital market is for long term securities. Financial instrument is a claim against a person or an institution for the payment at a future date a sum of money or a periodic payment in the form of interest or dividend. Financial instruments may be primary or secondary securities. Primary securities are issued by the ultimate borrowers of funds to the ultimate savers e.g. bank deposits, Mutual Fund units, insurance policies, etc. Financial instruments help the financial markets and the financial intermediaries to perform the important role of channelising funds from leaders to borrowers. Financial services include merchant banking, leasing, hire purchase, credit rating etc. Financial services rendered by the financial intermediaries’ bridge the gap between lack of knowledge on the part of the investors and increasing sophistication of financial market and instruments. These four components of the formal financial system are interdependent and they interact continuously with each other. Their interaction leads to the development of a smoothly functioning financial system. Over the years, the financial services in India have undergone revolutionary changes and had become more sophisticated, in response to the varied needs of the economy. The process of financial sector reforms, economic liberalization and globalization of Indian capital market has generated and augmented the interest of the investors in equity. But, due to inadequate knowledge of the capital market and lack of professional expertise, the common investors are still hesitant to invest their hard earned money in the corporate securities. The advent of mutual funds has helped in garnering the investible funds of this category of investors in a significant way. Every investor has his own set of objectives while investing, but primary objective remains creation of wealth (Jahanzeb et al, 2012).A large number of investment avenues are available for investors in India. Some of them are more marketable and liquid while others are more risky and less safe. Risk and return are the major issues which an investor has to face and handle. The investor has to choose proper investing avenues depending on his objectives, preferences, needs and abilities to take the risk and maximize the returns. Risk and returns are positively related variables. These go along in the investment process. All financial investments are risky but the degree of risk and return differ from each other. A higher return is always accompanied with a larger risk so that lower risk yields lesser return. Under such circumstances investors face dilemma as to preference for one and distraction for other. The financial investment avenues are classified under the following heads: 1. Corporate shares, debentures, deposits, etc. 2. Bank deposits and schemes 3. Mutual Fund schemes. 4. Post-office deposits/ certificates etc. 5. Government and semi-government bonds/ securities 6. PSU shares and bonds. The pre-requisite for a successful investment also lies in its liquidity, apart from risk and return on investment. Liquidity through easy marketability of investments demands the existence of a well-organised government regulated financial system. Financial services offered by asset management companies including leasing companies, mutual funds, merchant bankers, issue managers, portfolio managers and liability management companies play a big role in raising and efficient deployment of the funds in the financial system.
2. Mutual Funds
- A mutual fund is an investment vehicle made up of a pool of funds collected from many investors for the purpose of investing in assets and securities such as stocks, bonds or money market instruments. Mutual funds are operated by fund managers, who invest the fund capital and attempt to produce capital gains and income for the fund investors. An asset management company (AMC) is a company that manages a mutual fund. For all practical purposes, it is an organized form of a money portfolio manager which has several mutual fund schemes with similar or varied investment objectives. The AMC hires a professional money manager, who buys and sells securities in line with the fund's stated objective. A mutual fund portfolio is structured and maintained to match the investment objectives stated in its prospectus. Each investor owns shares, which represent a portion of the holdings of the fund. Thus, a mutual fund is one of the most viable investment options for the small investor as it offers an opportunity to invest in a diversified, professionally managed basket of securities at a relatively low cost. Mutual funds invest in a wide amount of securities, and performance is usually tracked as the change in the total market cap of the fund, derived by aggregating performance of the underlying investments. Mutual fund units, or shares, can typically be purchased or redeemed as needed at the fund's current net asset value (NAV) per share. A fund's NAV is derived by dividing the total value of the securities in the portfolio by the total amount of shares outstanding.When an investor purchases shares in a mutual fund, he is usually assessed a fee known as an expense ratio. A fund's expense ratio is the summation of its advisory fee or management fee and its administrative costs. Additionally, these fees can be assessed on the front-end or back-end, known as the load of a mutual fund. When a mutual fund has a front-end load, fees are assessed at the time of the initial purchase. For a back-end load, mutual fund fees are assessed when an investor sells his shares. Sometimes, however, an investment company offers a no-load mutual fund, which is a fund sold without a commission or sales charge. These funds are distributed directly by an investment company rather than through a secondary party. Investing in a mutual fund offers the investor a gamut of benefits. With mutual fund investments, the money can be spread in small bits across varied companies. This way, the investor reaps the benefits of a diversified portfolio with small investments. The pool of money collected by a mutual fund is managed by professionals who possess considerable expertise, resources and experience. Through analysis of markets and economy, they help pick favourable investment opportunities for their investors. A mutual fund usually spreads the money in companies across a wide spectrum of industries. This not only diversifies the risk, but also helps take advantage of the position it holds. Mutual funds clearly present their investment strategy to their investors and regularly provide them with information on the value of their investments. Also, a complete portfolio disclosure of the investments made by various schemes along with the proportion invested in each asset type is provided. A wide variety of schemes allow investors to pick up those which suit their risk/ return profile. All the mutual funds are registered with SEBI. They function within the provisions of strict regulations created to protect the interests of the investors.
3. Types of Mutual Funds
- Every investor has a different investment objective. Some go for stability and opt for safer securities such as bonds or government securities. Those who have a higher risk appetite and yearn for higher returns may want to choose risk-bearing securities such as equities. Hence, mutual funds come with different schemes, each with a different investment objective. Broadly, they have been categorized in three categories. Based on the structure, the mutual funds can be closed-ended, open-ended and interval funds. Based on the nature, they can be equity funds, debt funds and hybrid funds. Based on the investment objective, they can be classified as the growth funds, income funds, balanced funds and index funds (http://www.sebi.gov.in/faq/mf_faq.html).
3.1. Types of Mutual Funds by Structure
3.1.1. Close Ended Fund
- A close ended fund or scheme has a predetermined maturity period (e.g., 5-7 years). The fund is open for subscription during the launch of the scheme for a specified period of time. Investors can invest in the scheme at the time of the initial public issue and thereafter they can buy or sell the units on the stock exchanges where they are listed. In order to provide an exit route to the investors, some close ended funds give an option of selling back the units to the mutual fund through periodic repurchase at NAV related prices or they are listed in secondary market.
3.1.2. Open Ended Fund
- The most common type of mutual fund available for investment is an open-ended mutual fund. Investors can choose to invest or transact in these schemes as per their convenience. In an open-ended mutual fund, there is no limit to the number of investors, shares, or overall size of the fund, unless the fund manager decides to close the fund to new investors in order to keep it manageable. The value or share price of an open-ended mutual fund is determined at the market close every day and is called the Net Asset Value (NAV).
3.1.3. Interval Funds
- Interval schemes combine the features of open-ended and close-ended schemes. The units may be traded on the stock exchange or may be open for sale or redemption during pre-determined intervals at NAV related prices. FMPs or Fixed maturity plans are examples of these types of schemes.
3.2. Types of Mutual Funds by Nature
3.2.1. Equity Mutual Funds
- These funds invest maximum part of their corpus into equity holdings. The structure of the fund may vary for different schemes and the fund manager’s outlook on different stocks. The Equity funds are sub-classified depending upon their investment objective into diversified equity funds, mid-cap funds, small cap funds, sector specific funds and tax savings funds/ Equity Linked Savings Scheme (ELSS). Equity investments rank high on the risk-return grid and hence, are ideal for a longer time frame.
3.2.2. Debt Mutual Funds
- These funds invest in debt instruments to ensure low risk and provide a stable income to the investors. Government authorities, private companies, banks and financial institutions are some of the major issuers of debt papers. Debt funds can be further classified into gilt funds, income funds, MIPs, short term plans and liquid funds.
3.2.3. Balanced Funds
- They invest in both equities and fixed income securities which are in line with pre-defined investment objective of the scheme. The equity portion provides growth while debt provides stability in returns. This way, investors get to taste the best of both worlds.
3.3. Types of Mutual Funds by Investment Objective
3.3.1. Growth Funds
- Also known as equity schemes, these schemes aim at providing capital appreciation over medium to long term. These schemes normally invest a major portion of their fund in equities and are willing to withstand short-term decline in value for possible future appreciation.
3.3.2. Income Funds
- Also known as debt schemes, they generally invest in fixed income securities such as bonds and corporate debentures. These schemes aim at providing regular and steady income to investors. However, capital appreciation in such schemes may be limited.
3.3.3. Balanced Funds
- A combination of growth and income funds, also known as balanced funds, are those that have a mix of goals. They seek to provide investors with current income while still offering the potential for growth. Some funds buy stocks and bonds so that the portfolio will generate income whilst still keeping ahead of inflation. Equities provide the growth potential, while the exposure to fixed-income securities provides stability to the portfolio during volatile times in the equity markets. Growth and income funds have a low-to-moderate stability along with a moderate potential for current income and growth.
3.3.4. Index Funds
- These schemes attempt to reproduce the performance of a particular index such as the BSE Sensex or the NSE 50. Their portfolios consist of only those stocks that constitute the index. The percentage of each stock to the total holding is identical to the stock index weightage. And hence, the returns from such schemes are more or less equivalent to those of the Index.
3.3.5. Money Market or Liquid Funds
- These funds are also income funds and their aim is to provide easy liquidity, preservation of capital and moderate income. These schemes invest exclusively in safer short-term instruments such as treasury bills, certificates of deposit, commercial paper and inter-bank call money, government securities, etc. Returns on these schemes fluctuate much less compared to other funds. These funds are appropriate for corporate and individual investors as a means to park their surplus funds for short periods.
3.3.6. Gilt Funds
- These funds invest exclusively in government securities. Government securities have no default risk. NAVs of these schemes also fluctuate due to change in interest rates and other economic factors as is the case with income or debt oriented schemes.
4. Structure of Mutual Funds
- A mutual fund is set up in the form of a trust, which has sponsor, trustees, asset management company (AMC) and a custodian. The trust is established by a sponsor or more than one sponsors who is like a promoter of a company. The trustees of the mutual fund hold its property for the benefit of the unit-holders. The AMC, approved by SEBI, manages the funds by making investments in various types of securities. The custodian, who is registered with SEBI, holds the securities of various schemes of the fund in its custody. The trustees are vested with the general power of superintendence and direction over AMC. They monitor the performance and compliance of SEBI Regulations by the mutual fund. A typical mutual fund structure in India can be graphically represented in the Figure 1.
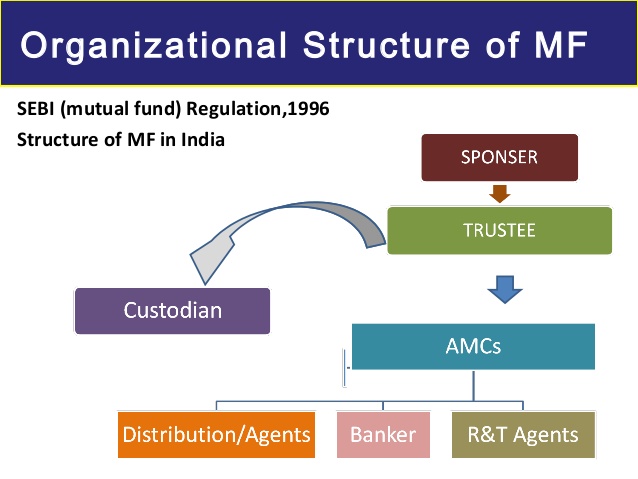 | Figure 1. Structure of mutual fund (investopedia.com) |
4.1. Sponsor
- Sponsor means any person who acting alone or with another body corporate establishes a mutual fund. The sponsor of a fund is akin to the promoter of a company as he gets the fund registered with SEBI. The sponsor forms a trust and appoints a Board of Trustees. He also appoints an Asset Management Company as fund managers. The sponsor, either directly or acting through the Trustees, also appoints a custodian to hold the fund assets. The sponsor is required to contribute at least 40% of the minimum net worth of the asset management company.
4.2. Mutual Funds as Trusts
- A mutual fund in India is constituted in the form of a public Trust created under the Indian Trusts Act, 1882. The sponsor forms the Trust and registers it with SEBI. The fund sponsor acts as the settler of the Trust, contributing to its initial capital and appoints a trustee to hold the assets of the Trust for the benefit of the unit- holders, who are the beneficiaries of the Trust. The fund then invites investors to contribute their money in the common pool, by subscribing to ‘units’ issued by various schemes established by the Trust as evidence of their beneficial interest in the fund. Thus, a mutual fund is just a ‘pass through’ vehicle. Most of the funds in India are managed by the Board of Trustees, which is an independent body and acts as protector of the unit -holders’ interests.
4.3. Asset Management Company
- The trustees appoint the Asset Management Company (AMC) with the prior approval of SEBI. The AMC is a company formed and registered under the Companies Act, 1956, to manage the affairs of the mutual fund and operate the schemes of such mutual funds. It charges a fee for the services it renders to the mutual fund trust. It acts as the investment manager to the Trust under the supervision and direction of the trustees. The AMC, in the name of the Trust, floats and then manages the different investment schemes as per SEBI regulations and the Trust Deed. The AMC should be registered with SEBI. The AMC of a mutual fund must have a net worth of at least Rs. 10 crore at all times and this net worth should be in the form of cash. It cannot act as a trustee of any other mutual fund. It is required to disclose the scheme particulars and base of calculation of NAY. It can undertake specific activities such as advisory services and financial consultancy. It must submit quarterly reports to the mutual fund. The trustees are empowered to terminate the appointment of the AMC and may appoint a new AMC with the prior approval of the SEBI and unit-holders. At least 50% of the directors of the board of directors of AMC should not be associated with the sponsor or its subsidiaries or the trustees.
4.4. Custodian
- The mutual fund is required, under the Mutual Fund Regulations, to appoint a custodian to carry out the custodial services for the schemes of the fund. Only institutions with substantial organizational strength, service capability in terms of computerization, and other infrastructure facilities are approved to act as custodians. The custodian must be totally delinked from the AMC and must be registered with SEBI.
4.5. Schemes
- Under the Mutual Fund Regulations (SEBI, 1996), a mutual fund is allowed to float different schemes. Each scheme has to be approved by the trustees and the offer document is required to be filed with the SEBI. The offer document should contain disclosures which are adequate enough to enable the investors to make informed investment decision, including the disclosure on maximum investments proposed to be made by the scheme in the listed securities of the group companies of the sponsor. If the SEBI does not comment on the contents of the offering documents within 21 days from the date of filing, the AMC would be free to issue the offer documents to public.
4.6. Investment Criteria
- The Mutual Fund Regulations lay down certain investment criteria that the mutual funds need to observe. There are certain restrictions on the investments made by a mutual fund. These restrictions are listed down by SEBI. The moneys collected under any scheme of a mutual fund shall be invested only in transferable securities in the money market or in the capital market or in privately placed debentures or securitised debts. However, in the case of securitised debts, such fund may invest in asset backed securities and mortgaged backed securities. Furthermore, the mutual fund having an aggregate of securities which are worth Rs. 100 million (approximately USD 2.15 million) or more shall be required to settle their transactions through dematerialised securities.
4.7. Limitation of Fees and Expenses
- The Mutual Fund Regulations lay down certain restrictions on the fees that can be charged by the AMC and also caps the expenses that can be loaded on to the Fund. The AMC can charge the mutual fund with investment and advisory fees subject to the following restrictions -- One and a quarter of one per cent of the weekly average net assets outstanding in each accounting year for the scheme concerned, as long as the net assets do not exceed Rs. 1 billion.- One per cent of the excess amount over Rs. 1 billion, where net assets so calculated exceed Rs. 1 billion. For schemes launched on a no load basis, the AMC can collect an additional management fee not exceeding 1% of the weekly average net assets outstanding in each financial year. In addition to the aforesaid fees, the AMC may charge the mutual fund with the initial expenses of launching the schemes and recurring expenses such as marketing and selling expenses including agents’ commission, if any, brokerage and transaction cost, fees and expenses of trustees, audit fees, custodian fees etc. The Mutual Fund Regulations also lay down a cap on the initial expense and the ongoing expense that can be borne by a scheme. In respect of a scheme, initial expenses, they cannot exceed 6% of the initial resources raised under that scheme and any excess over the 6% initial issue expense shall be borne by the AMC. Ongoing expenses (excluding issue or redemption expenses) including the investment management and advisory fee cannot exceed the following limits - - on the first Rs. 100 crores of the average weekly net assets - 2.5% - on the next Rs. 300 crores of the average weekly net assets - 2.25% - on the next Rs. 300 crores of the average weekly net assets - 2.0%- on the balance on the assets - 1.75% In addition to the above provisions, the Mutual Fund Regulations, 1996 and 2001 lay down several compliance/ filing requirements pertaining to reporting to the SEBI, guidelines for calculation of Net Asset Value, disclosure requirements, accounting norms, etc.
5. Role of SEBI
- SEBI regulations (2001) provide for exercise of due diligence by asset management companies (AMCs) in their investment decisions. For effective implementation of the regulations and also to bring about transparency in the investment decisions, all the AMCs are required to maintain records in support of each investment decision, which would indicate the data, facts, and other opinions leading to an investment decision. While the AMCs can prescribe broad parameters for investments, the basis for taking individual scrip-wise investment decision in equity and debt securities would have to be recorded. The AMCs are required to report compliance in their periodical reports to the trustees and the trustees are required to report to SEBI, in their half-yearly reports. Trustees can also check its compliance through independent auditors or internal statutory auditors or through other systems developed by them. The unclaimed redemption and dividend amounts can now be deployed by the mutual funds in call money market or money market instruments and the investors who claim these amounts during a period of three years from the due date shall be paid at the prevailing net asset value. After a period of three years, the amount can be transferred to a pool account and the investors can claim the amount at NAV prevailing at the end of the third year. The income earned on such funds can be used for the purpose of investor education. The AMC has to make a continuous effort to remind the investors through letters to take their unclaimed amounts. In case of schemes to be launched in the future, disclosures on the above provisions are required to be made on the offer documents. Also, the information on amount unclaimed and number of such investors for each scheme is required to be disclosed in the annual reports of mutual funds. SEBI issued a directive during 2000-01 that the annual report containing accounts of the asset management companies should be displayed on the websites of the mutual funds. It should also be mentioned in the annual report of mutual fund schemes that the unit-holders, if they so desire, can request for the annual report of the asset management company. Mutual funds earlier were required to get prior approval of the board of trustees and AMCs to invest in un-rated debt instruments. In order to give operational flexibility, mutual funds can now constitute committees who can approve proposals for investments in un-rated debt instruments. However, the detailed parameters for such investments must be approved by the AMC boards and trustees. The details of such investments are required to be communicated by the AMCs to the trustees in their periodical reports and it should be clearly mentioned as to how the parameters have been complied with. However, in case a security does not fall under the parameters, the prior approval of the board of the AMC and trustees is required to be taken.To provide the investors an objective analysis of the performance of the mutual funds schemes in comparison with the rise or fall in the markets, SEBI decided to include disclosure of performance of benchmark indices in case of equity-oriented schemes and subsequently extended to debt-oriented and balanced fund schemes in the format for half-yearly results. In case of sector or industry specific schemes, mutual funds may select any sectoral indices published by stock exchanges and other reputed agencies. In pursuance with the proposals in the Union Budget 2002-03, SEBI allowed the mutual funds to invest in foreign debt securities in the countries with full convertible currencies and with highest rating (foreign currency credit rating) by accredited/ registered credit rating agencies. They were also allowed to invest in government securities where the countries are AAA rated.
6. Equity Linked Savings Schemes (ELSS) Mutual Funds
- Equity-Linked Savings Scheme, popularly known as ELSS, are open-ended, diversified equity schemes offered by mutual funds in India. Features that differentiate ELSS from other open-ended equity diversified schemes are tax saving benefits (deductions under section 80 C of the Income Tax Act) and a lock-in period of 3 years. There is no tax on capital gains of these funds either. ELSS funds are one of the best avenues to save tax under Section 80 C. This is because along with the tax deduction, the investor also gets the potential upside of investing in the equity markets. Also, no tax is levied on the long-term capital gains from these funds. Moreover, compared to other tax saving options, ELSS has the shortest lock-in period of three years. The objective of the tax paying investors is to invest their money in an opportunity that not only has tax exemption, but also gets maximum liquidity and better rate of return. There are various avenues available in the financial market such as fixed deposits, Public Provident Fund, National Savings Certificate, tax saving mutual funds etc., which provide tax exemption benefits. Equity Linked Savings Schemes (ELSS) mutual funds are similar to the normal equity diversified schemes that invest in the equity market. People can invest in these ELSS Mutual Funds in small amounts through Systematic Investment Plan (SIP) and can begin with a small fund size. Some expenses are borne by the investor in the form of entry or exit load or both. This expense is similar to any other expense of equity schemes of mutual funds. The obvious disadvantage of ELSS funds is that the investors don’t enjoy the liquidity to move their money as they need. Nevertheless, the advantages far outweigh this inconvenience. For one, the money remains invested for at least three years, which is a reasonably long period for equity portfolios to accumulate profits and cultivate investor discipline.
6.1. The Systematic Investment Plan (SIP) Approach to ELSS Mutual Funds
- Systematic investment plan (SIP) is a disciplined way of investing in mutual funds which enables the investors making regular and equal payments at regular intervals for periods to accumulate wealth over long run. An SIP is a planned approach towards investments and helps inculcate the habit of saving and building wealth for the future. The best way to manage the risks inherent in equity investing is to allocate a fixed sum of money at periodic intervals, without making any attempt to ‘time’ the market. By saving in this manner, one will automatically accumulate more units of the ELSS when the market is down (when the units become ‘cheaper’) and lesser units when the market is up (when the units become ‘more expensive’) By averaging out the purchase price of their units, one can significantly reduce the risk of losing capital when markets go down. This is called ‘rupee cost averaging’. By starting an SIP in an ELSS, one can avail this wonderful benefit. Investors can start and continue investing with small amount of minimum of Rs. 500 through SIP. SIP is a better option for all tax paying investors who have scope to invest u/s 80C of the Income tax Act. It helps start tax planning from the beginning of the financial year. Investments through SIP mode have grown firmly and given significantly higher returns over the longer term. Investors can prefer monthly or quarterly frequency to invest. SIP works well across market cycles and helps to average out the cost of investment that are done in different periods. But investors have to keep in mind that every SIP installment is meant to be locked in for 3 years. SIP is a simple and disciplined approach towards investment. Investment is possible with small sum of money invested regularly to accumulate wealth. It is based on concept of Rupee Cost Averaging. SIP provides flexibility in terms of amount or quantity based SIP and flexible investments intervals like daily/ weekly/ fortnightly/ monthly or yearly basis.
7. International Scenario of Mutual Funds
- At the very dawn of commercial history, Egyptians and Phoenicians were selling shares in vessels and caravans in order to spread the risk of these perilous ventures. The word ‘mutual’ denoted something to be done collectively by a group of people with the common objective of having mutual faith and understanding among themselves. ‘Fund’ was used in monetary terms, to collect some money from the members for a common objective like earning profits with joint efforts. The mutual fund was born from a financial crisis that staggered Europe in the early 1770s. Against this backdrop, a Dutch merchant, Adriaan van Ketwich, had the foresight to pool money from a number of subscribers to form an investment trust – the world’s first mutual fund – in 1774, called “Eendragt Maakt Magt” (“unity creates strength”). Van Ketwich’s fund survived until 1824 but the vehicle he created is still a hallmark of personal investing. In 1822, groups of people in Belgium established a company to finance investments in national industries under the name of ‘Societe Generale de Belgique’ incorporating the concept of risk sharing. The institution acquired securities from a wide range of companies and practiced the concept of mutual fund for risk diversification. Same year, in 1822, King William I of Netherlands came up with a close-end fund. In 1860, this phenomenon spread to England. In 1868, the Foreign and Colonial Government Trust of London was formed, which was the real pioneer to spread risk of investors over a large number of securities and was considered as the Mecca of modern mutual funds. In 1873, Robert Fleming, established ‘The Scottish American Trust’. The first American investment trust was the close-end Boston Personal Property Trust created in 1893. The first modern-day mutual fund, Massachusetts Investors Trust, was created on March 21, 1924. It was the first mutual fund with an open-end capitalization, allowing for the continuous issue and redemption of shares by the investment company. After just one year, the fund grew to $392,000 in assets from $50,000. The fund went public in 1928 and eventually became known as MFS Investment Management. Four years later, in 1932, the first Canadian fund, Canadian Investment Fund Ltd. (CIF), was established and by 1951 had assets of $51 million. It was Sherman L Adams, the father of modern mutual fund, along with Charles Learoyd and Ashton Carr, who established a modest portfolio of 45 common stocks worth USD 50,000. The crash of stock markets in 1929 led to the demise of many close-end funds. By 1930’s, 920 mutual funds were formed in U.S.A. and most of them were close end (Sudhakar & Sasikumar, 2004). In Canada, the Canadian Investment Fund was the first to be set up in 1932, followed by Commonwealth International Corporation Limited and Corporate Investors Limited. The enactment of Securities Act of 1933, Investment Company Act of 1940 and Investment Advisors Act of 1940, led to the revival of mutual funds in U.S.A. The value of securities owned by U.S.A. funds was USD 2.5 billion in 1950. So, the accepting houses started rapidly to build up their skills and knowledge to deal with enlarged capital. The mutual fund industry in Japan dates back to 1937. But an investment trust modeled on the unit trusts of U.K. was established only in l941. Investment trusts in Japan were set up under the Securities Investment Law of 1951 with the three important characteristics namely contractual nature, open-end and flexibility. A major product innovation occurred in the 1970s with the launching of money market mutual funds. These specialized in investing in money market instruments and competed with banks by offering market-related returns and lower spreads than traditional bank deposits, while ensuring liquidity and ease of access. Money market mutual funds were launched in the United States in the 1970s in response to the regulatory restrictions that prohibited US banks from paying market rates of interest on their retail deposits at a time when high inflation was pushing market rates to very high levels compared to the ceilings imposed on banks. They also achieved high levels of development in other countries with rigid restrictions on bank deposit rates, such as France, Greece and Japan. But even in the absence of regulatory distortions, money market mutual funds, once invented, tend to grow to meet the demand from sophisticated investors who need a convenient place for parking their liquid investment balances. Growth of equity and bond funds resumed in the early 1980s as macroeconomic performance and equity markets started to improve. But growth did not become explosive until the early 1990s. It is still unclear why investors started to change their financial asset allocations so drastically after 1990. In the United States, the widening of bank spreads as commercial banks attempted to rebuild their capital following their disastrous results of the late 1980s may have provided an early stimulus to equity funds. As the gap between returns on bank deposits and returns on equity funds widened considerably, investors showed an increasing preference for equity funds. In the United States, the increased demand for mutual funds reflected a broader pickup in demand for financial assets, buoyed by rising equity prices, low and stable interest rates, and subdued inflation (Reid 2000). One of the most interesting financial phenomena of the 1990s was the explosive growth of mutual funds. In U.S.A., the number of mutual funds grew from 70 in 1940 to more than 3000 by the end of 1989. The mutual fund industry’s assets in U.S.A. increased from USD 44 billion in 1980 to USD 1 trillion in 1989. Subsequently hundreds of mutual funds, both open-end and close-end were launched and the concept of mutual funds spread over to many countries like Europe, the Far East, Latin America and Canada. In 1990, U.S.A. mutual fund industry constituted of 2,362 mutual funds with 39,614 thousands of investors holding USD 570.8 billion of assets. American investors embraced mutual funds with a fervor that even the most optimistic fund executives could not have predicted. By the end of 1994 in U.S.A., mutual funds had become the second largest financial institution after the banking sector holding assets worth USD 2161.4 billion. In the United States, total net assets of mutual funds grew from USD 1.6 trillion in 1992 to 5.5 trillion in 1998, equivalent to an average annual rate of growth of 22.4 percent. With the exception of some East Asian countries (including Japan), it was also true of most other countries around the world. The 15 countries that are members of the European Union witnessed an increase in their total mutual fund assets from USD 1 trillion in 1992 to 2.6 trillion in 1998 (average annual growth rate of 17.7 percent). Among EU member countries, Greece recorded the highest growth rate at 78 percent, followed by Italy at 48 percent and Belgium, Denmark, Finland and Ireland, all with growth rates of around 35 percent. Some developing countries, such as for example Morocco, registered even higher growth rates, but from much smaller starting points. In the United States, not only did mutual fund assets grow explosively over this period, but household ownership of mutual funds also experienced rapid growth. Survey estimates reported by the Investment Company Institute (the trade association of US mutual funds) show that the proportion of US households owning mutual funds grew from 6 percent in 1980 to 27 percent in 1992 and 44 percent in 1998 (ICI 2002). It is also important to note that this growth occurred contemporaneously with a period of high growth in market capitalizations around the world, fueled in part by the technology/ internet boom. For example, at the height of the bubble in March 2000, the market capitalization of U.S. publicly traded internet stocks was estimated to be U.S. $1.3 trillion (as compared to a valuation of U.S. $843 billion in June 2000) (Demers et al, 2000). Over the period of 1991-1999, the market capitalization in the U.S. increased by over 300%, from a base of 68% of GDP to over 180% of GDP. The proportion of US households owning mutual funds continued to increase after 1998 and reached 52 percent in 2001, before falling back slightly to 49.6 percent in 2002 (ICI 2002). The popular interest and visibility of equity market performance certainly helped contribute to the increased popularity of mutual fund products. In 1995, U.K. equity income category had the highest number of account holders at 11,86,365 (Fredman et al, 1997).At the end of first quarter of 2003, the assets of worldwide mutual funds stood at USD 11.2 trillion while the assets of equity funds contributed for 35 percent (Tripathy et al, 2004). The number of worldwide mutual funds stood at 53,150 (Tripathy et al, 2004) as shown in the Figure 2.
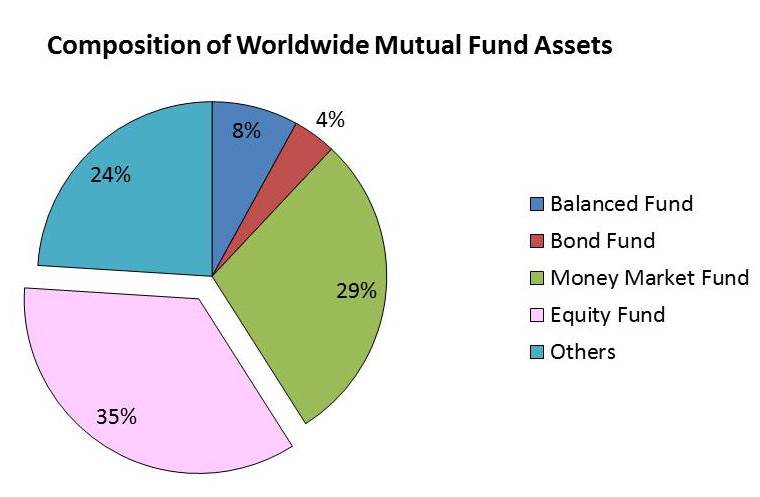 | Figure 2. Composition of worldwide mutual fund assets, 2003 (Tripathy, 2004) |
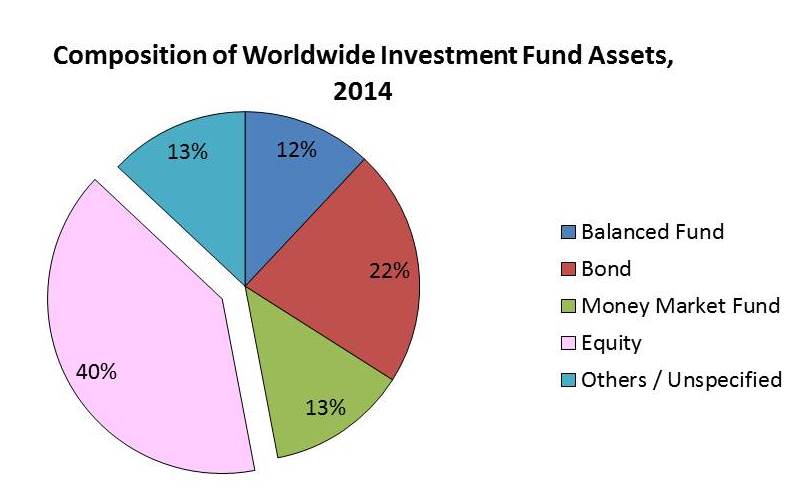 | Figure 3. Composition of worldwide investment fund assets, 2014 (mutualfundforum.com) |
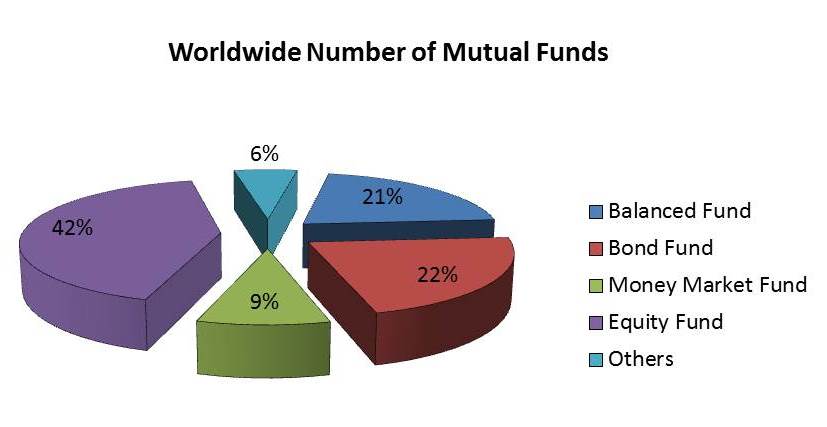 | Figure 4. Number and types of mutual funds worldwide in 2014(mutualfundforum.com) |
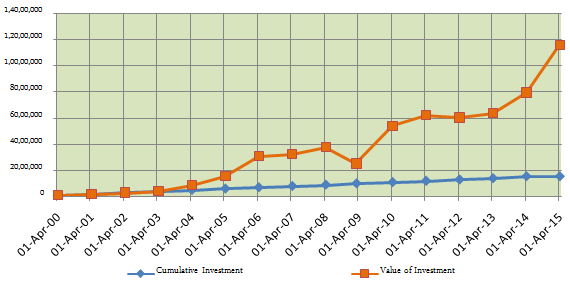 | Figure 5. AUM (in ’000 rupees) of Indian ELSS mutual funds from 2000-2015 (amfi.com) |
8. Indian Scenario of Mutual Funds
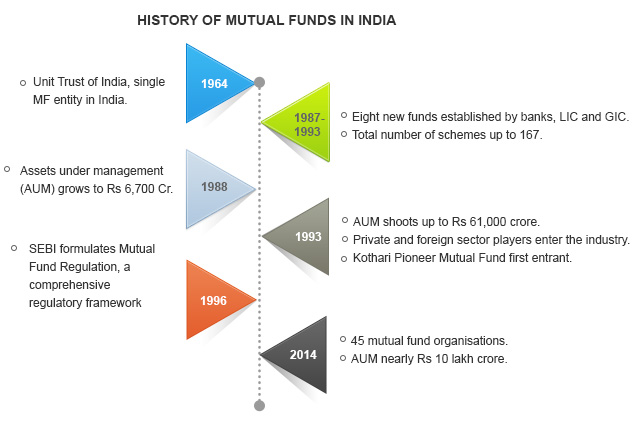
- In India, the need for the establishment of mutual funds was felt in 1931 and the concept of mutual fund was coined in 1964, by the farsighted vision of Sri T.T. Krishnamachari, the then finance minister. Taking into consideration the recommendations of the Central Banking Enquiry Committee and Shroff Committee, the Central Government established Unit Trust of India in 1964 through an Act of Parliament, to operate as a financial institution as well as an investment trust by way of launching UTI Unit Scheme 64. The overwhelming response and the vast popularity of UTI Unit Scheme 64 and the Mastershare Scheme in 1986 attracted the attention of banks and other financial institutions to this industry and paved the way for the entry of public sector banks. In 1987, the public sector banks and insurance companies were permitted to set up mutual funds. Accordingly, the LIC and GIC and six public sector banks initiated the setting up of mutual funds, bringing out a new era in the mutual fund industry. The financial sector reforms were introduced in India as an integral part of the economic reforms in the early 1990s with the principal objective of removing structural deficiencies and improving the growth rate of financial markets. Mutual fund reforms attempted for the creation of a competitive environment by allowing private sector participation. Since 1991, several mutual funds were set up by private and joint sectors. Many private mutual funds opted for foreign collaboration due to the technical expertise of their counterparts and past track record of success. Based on the recommendations of the Dave panel report in 1991, the Government of India issued new guidelines for setting up mutual funds in public sector, private sector as well as in joint sector on February 14, 1992. On February 19, 1993, the first batch of 12 private sector mutual funds was given “in-principle approval” by the Securities Exchange Board of India.The history of mutual funds in India can be broadly divided into four distinct phases as shown in Figure 6 (https://www.amfiindia.com/research-information/mf-history) –
 | Figure 6. History of mutual funds in India (amfiindia.com) |
8.1. First phase - 1964-1987
- Unit Trust of India (UTI) was established in 1963 by an Act of Parliament. It was set up by the Reserve Bank of India and functioned under the regulatory and administrative control of the Reserve Bank of India. In 1978, UTI was de-linked from the RBI and the Industrial Development Bank of India (IDBI) took over the regulatory and administrative control in place of RBI. The first scheme launched by UTI was Unit Scheme 1964. At the end of 1988, UTI had Rs. 6,700 crores of assets under management.
8.2. Second Phase - 1987-1993 (Entry of Public Sector Funds)
- 1987 marked the entry of non-UTI, public sector mutual funds set up by public sector banks, Life Insurance Corporation of India (LIC) and General Insurance Corporation of India (GIC). SBI Mutual Fund was the first non-UTI mutual fund established in June 1987, followed by Canbank Mutual Fund (Dec 87), Punjab National Bank Mutual Fund (Aug 89), Indian Bank Mutual Fund (Nov 89), Bank of India (Jun 90), Bank of Baroda Mutual Fund (Oct 92). LIC established its mutual fund in June 1989 while GIC had set up its mutual fund in December 1990. At the end of 1993, the mutual fund industry had assets under management of Rs. 47,004 crores.
8.3. Third Phase - 1993-2003 (Entry of Private Sector Funds)
- With the entry of private sector funds in 1993, a new era started in the Indian mutual fund industry, giving the Indian investors a wider choice of fund families. Also, 1993 was the year in which the first mutual fund regulations came into being, under which all mutual funds, except UTI were to be registered and governed. The erstwhile Kothari Pioneer (now merged with Franklin Templeton) was the first private sector mutual fund registered in July 1993. The 1993 SEBI (Mutual Fund) Regulations were substituted by a more comprehensive and revised Mutual Fund Regulations in 1996. The industry now functions under the SEBI (Mutual Fund) Regulations 1996.The industry evolved self-regulation to promote confidence among investors under the aegis of the Association of Mutual Funds of India (AMFI) incorporated on August 22, 1995 as a non-profit organisation. With the objective of ensuring healthy growth of mutual funds, the SEBI (Mutual Funds) Regulations, 1996 aimed at bringing out standards in Net Assets Value (NAV) calculation, accounting practices, exemption from listing of schemes, remuneration to Asset Management Company’s (AMC), fixation of a band of seven percent between purchase and repurchase prices.The number of mutual fund houses went on increasing, with many foreign mutual funds setting up funds in India and also the industry has witnessed several mergers and acquisitions. As at the end of January 2003, there were 33 mutual funds with total assets of Rs. 1,21,805 crores. The Unit Trust of India with Rs. 44,541 crores of assets under management was way ahead of other mutual funds.
8.4. Fourth Phase - since February 2003
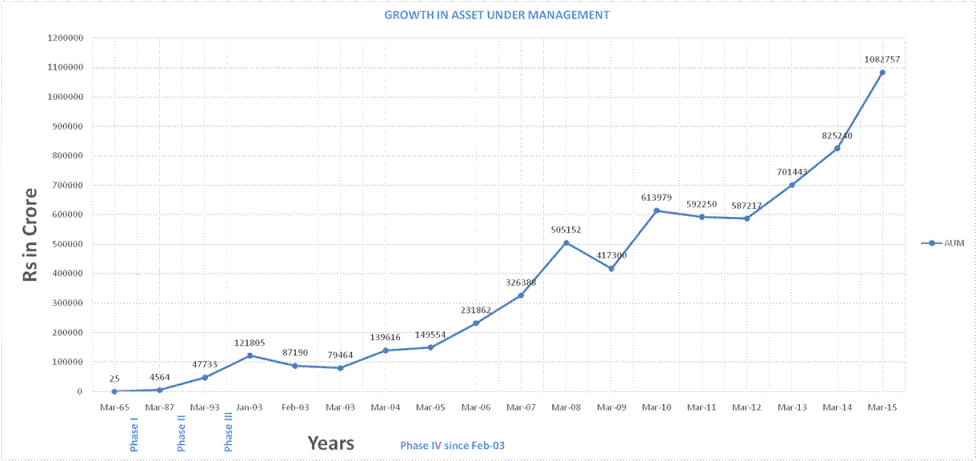
- In February 2003, following the repeal of the Unit Trust of India Act 1963, UTI was bifurcated into two separate entities. One is the Specified Undertaking of the Unit Trust of India with assets under management of Rs. 29,835 crores as at the end of January 2003, representing broadly, the assets of US 64 scheme, assured return and certain other schemes. The Specified Undertaking of Unit Trust of India, functioning under an administrator and under the rules framed by Government of India and does not come under the purview of the Mutual Fund Regulations. The second is the UTI Mutual Fund, sponsored by SBI, PNB, BOB and LIC. It is registered with SEBI and functions under the Mutual Fund Regulations. With the bifurcation of the erstwhile UTI which had in March 2000 more than Rs. 76,000 crores of assets under management and with the setting up of a UTI Mutual Fund, conforming to the SEBI Mutual Fund Regulations, and with recent mergers taking place among different private sector funds, the mutual fund industry has entered its current phase of consolidation and growth. As per the data given by Securities and Exchange Board of India (SEBI) for the transactions on stock exchanges by mutual funds for the period of April 2008 – March 2009, the net investment in Equity funds was Rs. 6,983 crores & net investment in Debt funds in the same time period was Rs. 81,803 crores (as per the data compiled by the SEBI on the basis of reports submitted to SEBI by the NSE & the BSE). There was a net outflow of Rs. 19,215 crores in 2010-11 by private sector mutual funds as compared to Rs. 54,928 crores inflow in 2009-10. Public sector mutual funds and UTI mutual fund also witnessed net outflow of Rs. 13,555 crores and Rs. 16,636 crores in 2010-11 as compared to net inflow of Rs. 12,499 crores and Rs. 15,653 crores in 2009-10 respectively. The Figure 7 indicates the growth of assets over the years.
 | Figure 7. Growth of AUM of mutual funds in India (amfiindia.com) |
9. Association of Mutual Funds in India
- The Association of Mutual Funds in India (AMFI) was established in 1993 when all the mutual funds, except the UTI, came together realising the need for a common forum for addressing the issues that affect the mutual fund industry as a whole. The AMFI is dedicated to developing the Indian mutual fund industry on professional, health, and ethical lines and to enhance and maintain standards in all areas with a view to protecting and promoting the interests of mutual funds and their unit-holders.AMFI continues to play its role as a catalyst for setting new standards and refining existing ones in many areas, particularly in the sphere of valuation of securities. Based on the recommendations of AMFI, detailed guidelines have been issued by SEBI for valuation of unlisted equity shares. A major initiative of AMFI during the year 2001-02 was the launching of registration of AMFI Certified Intermediaries and providing recognition and status to the distributor agents. More than 30 corporate distributors and a large number of agent distributors have registered with AMFI. The AMFI Guidelines and Norms for Intermediaries (AGNI) released in February 2002, gives a framework of rules and guidelines for the intermediaries and for the conduct of their business. AMFI maintains a liaison with different regulators such as SEBI, IRDA, and RBI to prevent any over -regulation that may stifle the growth of the industry. AMFI has set up a working group to formulate draft guidelines for pension scheme by mutual funds for submission to IRDA. It holds meetings and discussions with SEBI regarding matters relating to mutual fund industry. Moreover, it also makes representations to the government for removal of constraints and bottlenecks in the growth of mutual fund industry. AMFI conducts investor awareness programmes regularly. AMFI also conducts intermediary’s certification examination. As of July 2002, 2,140 employees and 3,200 distributors have passed the certification examination conducted by AMFI. AMFI is in the process of becoming a self- regulatory organisation (SRO). It has set up a committee to set the norms for AMFI to become an SRO.
10. Statement of the Problem
- The Indian mutual fund industry finds itself in an economic landscape which has undergone rapid changes over the past three years. The industry achieved a high water mark when it doubled its AUM from Rs. 3.6 trillion in FY2007 to Rs. 6.13 trillion in FY2010 – clocking an impressive growth rate of 16.2% per year. Since then the Indian economy (coupled with the emerging economies) has faced a slowdown. From an average GDP growth rate of 8-9% during the 2008-2011 years, the Indian economy is now growing at a lackluster 4.8% growth rate in Q2 2013. Coupled with a steep decline in the value of the Indian rupee, the mutual fund industry now finds itself in a capricious global economic environment. However, there is strong reason to believe that the Indian mutual fund industry has not yet seen its global peak and if proper measures are taken, the industry could get back on its former growth path. One of the biggest challenges that the mutual fund industry faces is the lack of healthy participation from a large part of the country (Chakrabarti et al, 2014 SEBI).It is well known that mutual funds offer their investors benefits difficult to obtain through other investment vehicles. Benefits such as diversification, access to equity and debt markets at low transaction costs and liquidity are some such advantages. Given these benefits, one would imagine that Indian households, characterized with gross domestic savings of close to 28% of the total GDP (World Bank, 2012), one of the highest in the world, would flock to invest their savings in mutual funds. However, a recent report (PWC, 2013) points out that the distribution of assets under management (AUM) across cities is highly skewed in favor of the top fifteen (T-15) cities of India. There has been a debate in the mutual fund industry that the abolition of entry load has reduced the incentives for the distributors to go after new clients. The restriction of entry load on existing and new mutual funds in 2009 affected the functioning of the mutual fund industry and leading fund houses and distributors had to restructure their business and operating models in order to arrive at a profitable solution. However, researchers (Anagol & Kim, 2012) who have examined the claim that abolition of entry loads had hampered the penetration of mutual funds have found no evidence behind such claims. Apart from the macro economic factors, the anecdotal evidence says that Indian mutual fund industry is incapacitated by the lack of proper distribution channels, entry loads, investor awareness, governance and risk management, technology and low retail participations (PWC, 2013).As the household sector’s share in financial assets is expected to go much higher in the country’s savings, it is of utmost importance to show a right path to individual investors. With an emphasis on increase in domestic savings and improvement in deployment of investible funds into the market, the need and scope for mutual fund operations have increased and is expected to increase tremendously in future. Mutual funds seek to serve those individuals, who have the inclination to invest but lack the background, expertise and sufficient resources to diversify their investment among various sectors. Even though mutual fund industry is growing, still there is a long way to go (Srinivasan, 2007). The penetration level in rural areas is not very high. The funds have grown more because of the changing demographic profile. More number of investors, particularly youth, whose disposable income has gone up, opt mutual fund to enter securities market indirectly. India’s financial system holds an important key to the country’s future growth trajectory. Regular and long term inflow of funds in the capital markets is required to fulfil the capital demand of various sectors of the economy. The source of these funds lies in household savings. Historically, India is a country of savers with high savings rate (around 30 percent of GDP). As per a July 2011 report by National Council of Applied Economic Research (NCAER), there are 227.84 million households in India. Of these, only 10.74 percent households are investors (households that invested in any of government bonds, bonds issued by undertakings such as IDBI, SBI, GAIL, etc., debentures of private companies, equities of private companies, mutual funds and derivatives), while 89.26 percent households are non-investors i.e., savers (households that invested only in post office and other similar savings, pension schemes, public insurance schemes, bank deposits, commodities, real estate, precious metals etc.). Even among the savers, the report states that nearly 93 percent of the savers choose to save only in traditional avenues i.e. post office savings, life insurance and bank deposits. This clearly reflects that for long term savings requirement, households look forward to traditional avenues.Indian investors have little information to take prudent investment decisions. Such information drought is the breeding ground for misguidance and the investor is likely to be inspired by the agents to opt for a particular scheme without an in-depth analysis. The information drought regarding performance of mutual funds in India is perhaps a major cause for the Indian mutual fund industry for not attaining the status of their counterparts in U.S.A., U.K. and other developed countries. An average investor obtains investment advice and practical information from investment outlets, such as business magazines and web sites. However, the information on performance of mutual funds over a period of time is scantily available for all the investors. The present work is an attempt to fill up the lacuna and help investors to make meaningful investments. Therefore, the present study attempts to bring out the performance of the two largest ELSS mutual funds of India. The mutual fund industry has gained momentum in 1993 with the entry of private sector in the wake of liberalization and globalization. Further, the industry has gained a coveted status after the implementation of the SEBI (Mutual Funds) Regulations 1996. Of the varied category of mutual fund schemes, ELSS mutual funds are expected to offer the advantages of tax savings, diversification, market timing and selectivity. An ELSS scheme has to generate capital appreciation for its unit-holders by investing a substantial portion of its corpus in high growth equity shares or other equity related instruments of corporate bodies, apart from offering the tax benefits to the holders. The principal objective of ELSS schemes is to ensure maximum capital appreciation and maximize tax savings. ELSS Mutual funds continue to be a popular investment choice (Garg M, 2014). This is evident from the fact that the first ELSS was launched in 1993 and today, the investors have more than 35 ELSS to choose from (Chakrabarti et al, 2014). The total corpus of ELSS in India, as on October 31, 2007 is Rs. 15,000 Cr as stated on the SEBI website (sebi.gov.in). The corpus of HDFC Tax Saver (Growth) Fund is Rs. 4,525.59 Cr and is ranked 4th as on November 2014 in terms of annual performance. On the other hand, the corpus of SBI Tax Advantage Series I (Growth) is Rs. 394.83 Cr and is ranked 14th as on November 2014 in terms of annual performance.
11. Significance of the Study
- The Indian mutual fund industry finds itself in an economic landscape which has undergone rapid changes over the past three years. The industry achieved a high water mark when it doubled its AUM from Rs. 3.6 trillion in FY2007 to Rs. 6.13 trillion in FY2010 – clocking an impressive growth rate of 16.2% per year. Since then the Indian economy (coupled with the emerging economies) has faced a slowdown. From an average GDP growth rate of 8-9% during the 2008-2011 years, the Indian economy is now growing at a lackluster 4.8% growth rate in Q2 2013. Coupled with a steep decline in the value of the Indian rupee, the mutual fund industry now finds itself in a capricious global economic environment. However, there is strong reason to believe that the Indian mutual fund industry has not yet seen its global peak and if proper measures are taken, the industry could get back on its former growth path.The advantages of having an active participation by retail investors in mutual fund are not just limited to financial inclusion. It has been shown in past studies that institutional investors (in the form of mutual funds) ‘herd’ towards small-cap and mid-cap stock which offer growth prospects thereby increasing the depth and breadth of capital markets (Wermers, 1999). Institutional buying and selling of stocks also increases the price-adjustment process in capital markets and under right conditions institutional investors tend to decrease stock price volatility. All these effects are desirables as far as financial markets are concerned.
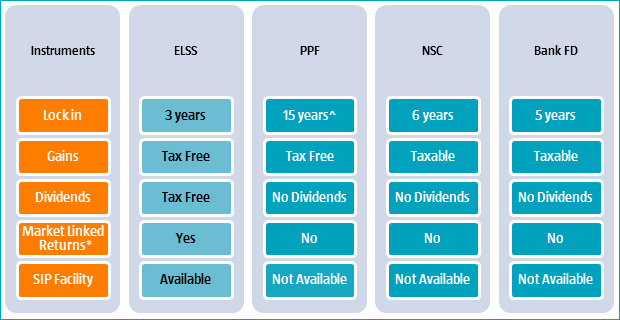 | Figure 8. Saving instruments vis-à-vis ELSS funds (mutualfundresearch.com) |
12. Need for the Study
- The Indian mutual fund industry (IMFI) is one of the fastest growing and most competitive segments of the financial sector. As of August 2013, the total AUM stood at Rs. 7.66 trillion. However, growth rates of AMCs have come down from the peak levels seen in the early 2000s. One of the biggest reasons behind this is the lack of healthy participation from a large part of the country. This lack of penetration can be due to two reasons. One is the low demand of mutual funds from the public outside the major cities. This low demand in turn could be caused by low levels of financial literacy, cultural attitudes towards savings and investments etc. Secondly, there is low supply of mutual funds from AMCs outside the major cities. The low supply could be due to perceived lack of demand from the general retail investor or due to lack of available manpower in these areas.It is well known that mutual funds offer their investors benefits difficult to obtain through other investment vehicles. Benefits such as diversification, access to equity and debt markets at low transaction costs and liquidity are some such advantages. Given these benefits, one would imagine that Indian households, characterized with gross domestic savings of close to 28% of the total GDP (World Bank, 2012), one of the highest in the world, would flock to invest their savings in mutual funds. However, a recent report (PWC, 2013) points out that the distribution of assets under management (AUM) across cities is highly skewed in favor of the top fifteen (T-15) cities of India. The T-15 cities contribute to 87% of the entire AUM in the country. (PWC, 2013).Tax-saving investment options come into focus towards the end of financial year, as the time draws near to finalize end of the year tax saving declarations. Investors revisit the best possible options and choose the one that makes most sense. Equity-linked saving schemes (ELSS) form a part of the tax saving investment basket as they not only reduce the tax outgo but are also an efficient long-term investment tool. Although being equity linked means that ELSS investments come with some market risk, yet, in choosing a tax saving investment with the intention to remain invested for 3-5 years or longer, ELSS is the most efficient choice. Mostly, funds in the ELSS category are considered only for tax saving. However, these are managed as diversified equity funds with a long-term investment outlook.Traditional tax-saving investments like PPF and fixed deposits don’t have the capacity to earn inflation-beating returns. The equity exposure that ELSS funds have allows them to do this. Sure, equity can be risky but that is in the short term. Over longer periods, the risks are mitigated and the invstor can earn higher returns as well, even if the investor may not invest entire tax-saving investment portfolio in ELSS funds on a long investment horizon. Since investors are advised to invest largely in ELSS funds, it is important for them to keep an eye on their investments as well. ELSS funds come with a lock-in of three years, but an investor can stop investing in a poor performer even before the lock-in ends. Hence, it becomes important to have an periodic check of funds’ performance and replace the bad ones with better options. At the same time, you continued investment in ELSS funds, even through a bad phase of the market, ensures reaping the long-term benefits that they can offer.ELSS mutual fund is the best way to participate in equities. It is ideal investment option for small investors as it is a simple way of investing in stock markets coupled with tax savings. If one wants a taste of equities to boost overall portfolio returns, there is nothing like ELSS which combines section 80 C tax benefit with the returns of the equity funds.
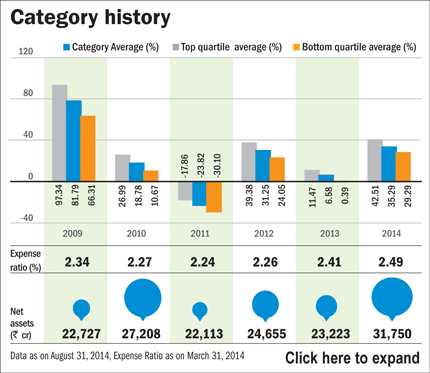 | Figure 9. Performance of ELSS funds in India in terms of returns, expense ratio and AUM from 2009 to 2014 (mutualfundresearch.com) |
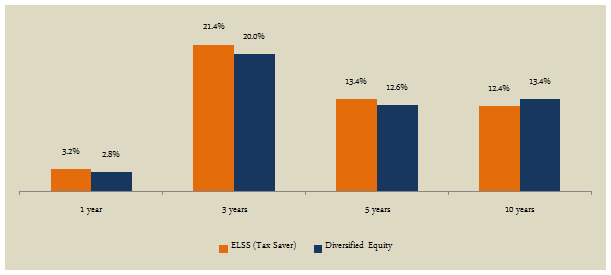 | Figure 10. Performance of ELSS funds vis-à-vis diversified equity as on Q4, 2014 (valueresearch.com) |
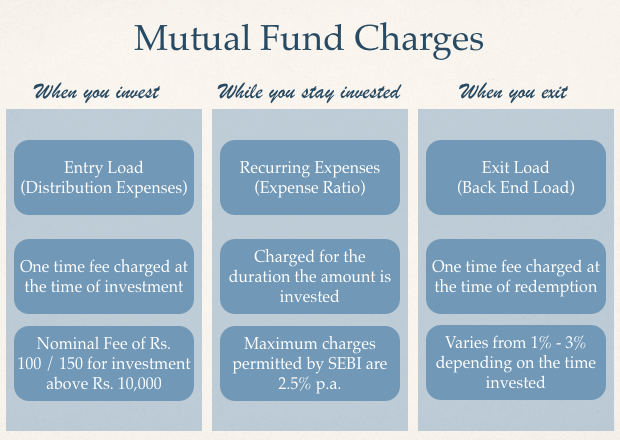 | Figure 11. Mutual fund charges (investopedia.com) |
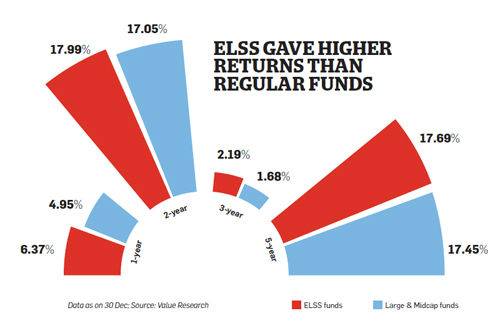 | Figure 12. Performance of ELSS funds vis-à-vis large & midcap funds as on Q3, 2014 (valueresearch.com) |
13. Proposed Theoretical Model for ELSS Mutual Funds Risk-Returns
- Risk is variability in future cash flows. It is also known as uncertainty in the distribution of possible outcomes. A risky situation is one, which has some probability of loss or unexpected results. The higher the probability of loss or unexpected results is, the greater the risk. It is the uncertainty that an investment will earn its expected rate of return. For an investor, evaluating a future investment alternative on the basis of rate of return is very important (Sprinkle, 1971). ELSS mutual fund risk management includes processes that identify, analyse, respond to, track and control any risk that would prevent the ELSS fund from achieving its business objectives. These processes should include reviews of project level risks with negative implications for the fund portfolio, ensuring that the project manager has a responsible risk mitigation plan. Additionally, it is important to do a consolidated risk assessment for the portfolio overall to determine whether it is within the already specified limits. Since ELSS fund portfolios and their environments are dynamic, the investors should review and update their portfolio risk management plans on a regular basis through the fund life cycle.On the basis of this discussion, a theoretical model is proposed to understand the factors which affect the risk dimensions associated with the ELSS mutual funds. The model also takes into consideration the dimensions of risk-return relationship as both the risk and the risk-return relationship affect the returns of the ELSS mutual funds; which ultimately affects the buying behaviour of the small investors of the ELSS mutual funds. Demographic variables are also important factors in this model as they affect the overall risk taking and risk absorbing capability of the small investors. The model can be shown as below –
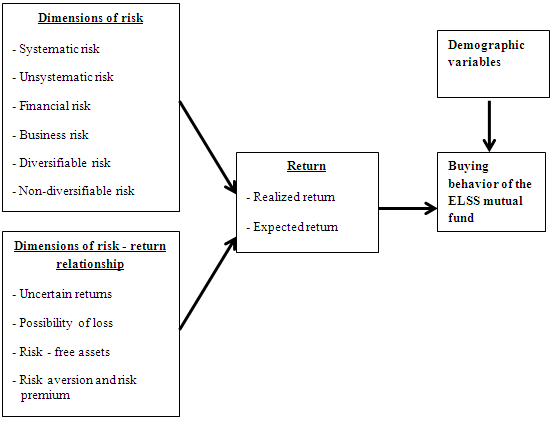 | Figure 13. Proposed theoretical model |
 The market risk-to-return ratio is effectively the market risk premium and by rearranging the above equation and solving for E(Ri), we obtain the expected return of ELSS mutual fund as follows -
 Where, E(Ri) is the expected return on the ELSS mutual fundRf is the risk-free rate of interest such as interest arising from government bondsβi (the beta) is the sensitivity of the expected excess asset returns to the expected excess market returns, or also
  E(Rm) - is the expected return of the market E(Rm) - Rf is sometimes known as the market premium (the difference between the expected market rate of return and the risk-free rate of return).E(Ri) - Rf is also known as the risk premiumRestated, in terms of risk premium, we find that -
 which states that the individual risk premium equals the market premium times β.Here, the expected market rate of return is usually estimated by measuring the arithmetic average of the historical returns on a benchmark market portfolio (e.g. S&P 500). The risk free rate of return used for determining the risk premium is usually the arithmetic average of historical risk free rates of return and not the current risk free rate of return. The above mathematical equation can be modified to include size premium and specific risk. This is important for investors in privately held companies who often do not hold a well-diversified portfolio. Examples of such investors are the ELSS mutual fund investors. The equation is similar to the traditional CAPM equation with the market risk premium replaced by the product of beta times the market risk premium –
 Where, E(Ri) is required return on security iRf is risk-free rateRPm is general market risk premiumRPs is risk premium for small sizeRPu is risk premium due to company-specific risk factorSecurity market line (SML)The SML essentially graphs the results from the capital asset pricing model (CAPM) formula. The x-axis represents the risk (beta), and the y-axis represents the expected return. The market risk premium is determined from the slope of the SML. The relationship between β and required return is plotted on the securities market line (SML), which shows expected return as a function of β. The intercept is the nominal risk-free rate available for the market, while the slope is the market premium, E(Rm)− Rf. The securities market line can be regarded as representing a single-factor model of the asset price, where beta is exposure to changes in value of the market. The equation of the SML is -
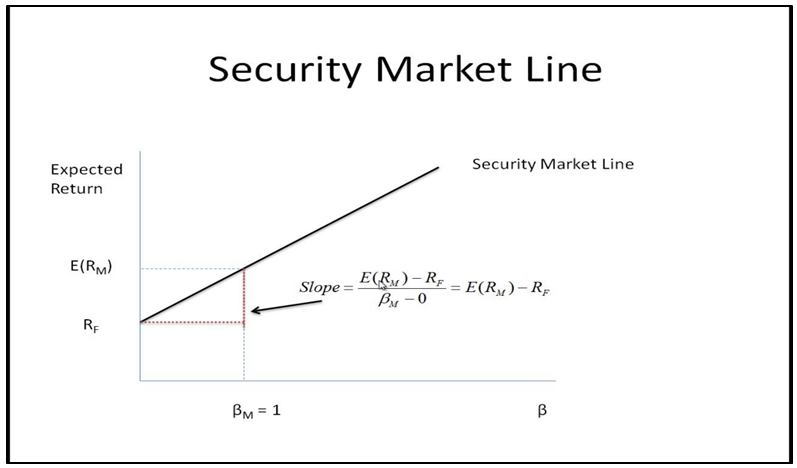 | Figure 14. Security market line |
14. Managerial Implications
- The findings on secondary data have brought out a number of managerial implications for the ELSS mutual fund industry at large. Considering that grievance redressal has effect on investor satisfaction and the perception of the investor of ELSS mutual fund providers, it becomes imperative that the funds should treat the investors fairly all the time. The complaints raised by the investors should be dealt with courtesy and in time. Any grievances should be treated efficiently and if not resolved, the investor should be made aware of his further consumer rights in the bank. After sales service is equally important as it manifests in an increase in positive perception about the ELSS mutual fund. The fund should be welcoming to the investor all the time and respect investor’s choice with all energy and enthusiasm. After sales service is the key to keep the investment closed and the investors satisfied, resulting in further investment. The ELSS mutual funds have to build up the procedures and train their employees so as to build and sustain a healthy and long-term relationship with the investors and with tax payers in particular. The tax payers are usually burdened with tax related procedures and paper work, so, a little help from the ELSS mutual fund providers will go a long way in putting the tax payers at ease and gain their confidence for investment in ELSS mutual funds.
15. Conclusions
- In India, mutual funds have a lot of potential to grow. Mutual fund companies have to create market innovative products and frame distinct marketing strategies. Product innovation will be one of the key determinants of success. The mutual fund industry has to bring many innovative concepts such as high yield bond funds, principal protected funds, long short funds, arbitrate funds, dynamic funds, precious metal funds, and so on. The penetration of mutual funds can be increased through investor education, providing investor oriented value added services, and innovative distribution channels. Mutual funds have failed during the bearish market conditions. To sell successfully during the bear market, there is need to educate investors about risk-adjusted return and total portfolio return to enable them to take informed decision. Mutual funds need to develop a wide distribution network to increase its reach and tap investments from all corners and segments. Increased use of internet and development of alternative channels such as financial advisors can play a vital role increasing the penetration of mutual funds. Mutual funds have come a long way, but a lot more can be done. Equity markets for a long time were a bastion for institutional investors and high net worth individuals only. The high risk return profile of equity investments was an attraction for retail investors as well. But it was only with the advent of mutual funds that they entered the stock markets in a big way. Mutual funds in India, and all over the world, have been a hit with small investors. They have provided a better yielding avenue to such investors who want to invest in the stock markets, but are not backed by substantial savings to do so. Earlier investors had to buy a minimum of 5, 10, 50 or 100 shares, depending on the face value and the company, if they made an investment in the equity markets, and this inhibited small middle class investors whose requirement was to make investment out of their small savings. The situation has changed now, with dematerialization of shares, allowing investors to buy and sell a single unit, the high prices of a few shares like Infosys, and Wipro do not allow the investors to take advantage of such attractive investments. But trading of fractional share, as has been already permitted in the US, will do away with that constraint too.Internet trading in ELSS mutual funds eliminates the hassles of running around the broker, uncertainty over the exact price of purchase, writing out cheques and giving instructions to depository participants (a broker with a demat account). An investor can do his own research on the net before making a deal. The websites offering e-broking have all the information needed to make an informed purchase or sale. Till recently, such information was the exclusive preserve of big investors. Internet trading in India is expected to account for 10 per cent of the trading volume of the stock exchanges in a year and would grow to 25 to 30 per cent in the next few years (AMFI, 2013). A mutual fund is a corporation, which pools together investor’s money, and buys stocks or bonds on their behalf. Investors participate in it by purchasing shares of the entire pool of assets, to diversify their investments. The capital gains or dividends from these securities are then distributed to unit holders or the investors of the fund. Mutual funds in India were brought in by the government in 1964 as UTI, the largest mutual fund in the country, to encourage small investors in the equity market. UTI has an extensive marketing network of over 35, 000 agents spread over the country. The UTI funds have performed relatively well in the market, as compared to the Sensex trend. However, the same cannot be said of all mutual funds. Nowadays, an average person / investor is more aware and educated about the equity markets than ever before. The stock markets have become a regular topic of discussion. Hence, the advantage that mutual funds provided of the fund manager’s expertise in investing, is no longer the mutual funds’ selling proposition. The biggest shock to the mutual fund industry during recent times was the insecurity generated in the minds of investors regarding the US-64 scheme. The Indian investors are largely unaware of the nuances of mutual fund schemes. This debacle proved that even fund managers who should know better get swayed by movements in capital markets and take investment decisions which go awry when the mood in the market changes. Though this scheme was bailed out with considerable cost to exchequer, not every mutual fund may be as big and fortunate that the government has no option but to bail out the scheme, as UTI.Many funds currently have NAV less than the face value, partly reflective of the fact that mutual funds are not as fool proof as was earlier believed. Hence, investors have to be careful with their investment decisions, as they are not guaranteed by the Government, Reserve Bank of India or any other government agency. A large number of such schemes have run into trouble, and though mutual fund industry is in the growth phase, with many new entrants and mergers between existing players, investors need to keep a wary eye on developments as their own money is involved. Most people invest in mutual funds for one simple reason. They are a convenient and cost effective method of obtaining diversification and professional management. The risk factor is also considerably low. This is because mutual funds hold anywhere from a few securities to several thousand, over a number of investments. What’s more, mutual funds generally buy and sell securities in volume, which allow investors to benefit from lower trading, management and research costs. It is also felt that many investors invest in MFs more for convenience than to avail themselves of the fund managers’ expertise. Studies in the US show that well-managed funds get good inflows of money and grow rapidly, though interestingly, poorly managed funds, while not getting funds, also did not lose money. This is indicative of a built-in inertia in the investors’ attitude. With folio services like allowing the investor to buy fractional shares, trade execution and accounting function of a MF can be automated and become very convenient for investors. Since providing these services is not expensive, one might see these functions becoming highly commoditised. In the demat environment, there is no reason why fractional shares cannot be processed. With technology, today an investor also has access to key information, which was earlier only a manager’s privilege. Investors may be more inclined to invest in select portfolios rather than to go by the MF route.
 Abstract
 Reference
 Full-Text PDF
 Full-text HTML