-
Paper Information
- Paper Submission
-
Journal Information
- About This Journal
- Editorial Board
- Current Issue
- Archive
- Author Guidelines
- Contact Us
Management
p-ISSN: 2162-9374 e-ISSN: 2162-8416
2015; 5(6): 161-174
doi:10.5923/j.mm.20150506.01

Change Request Impacts towards Construction Projects in Yemen- An Empirical Study
 Abstract
 Reference
 Full-Text PDF
 Full-text HTML
Murlidhar A. Lokhande1, Farouk Saifyahya Ahmed2
1Professor, at Department of Commerce, Dr, B.A.M.U, Aurangabad, Maharashtra, India
2Research scholar at Department of management science, Dr, B.A.M.U, Aurangabad, Maharashtra, India
Correspondence to: Farouk Saifyahya Ahmed, Research scholar at Department of management science, Dr, B.A.M.U, Aurangabad, Maharashtra, India.
| Email: |  |
Copyright © 2015 Scientific & Academic Publishing. All Rights Reserved.
This work is licensed under the Creative Commons Attribution International License (CC BY).
http://creativecommons.org/licenses/by/4.0/

The linear construction projects of YEMEN are the basis of the study, focusing on the requirement of change orders in the several stages of the projects. The work presented here is the statistical analysis of the responses obtained from the from construction industry of YEMEN, which is through a set of potential survey questioner. The aim of the statistical assessment explored here is to assess the change impact consequences and possible directions of prevention. In our earlier research article, we defined the overall survey in 3 dimensions towards finding the severity and scope of the change request impact, consequence certainty of the change request impact and the preventive strategies followed to avoid the consequences of the change request impacts. The overall 21 benchmarking functional and non-function construction standards were defined in our earlier contribution, which were used to prepare questioner to obtain the construction industry opinion, beliefs and practices through the said three dimensions of the survey. In this article, we explored the statistical assessment of the responses to the survey questioner obtained from the construction industry of the YEMEN. The data analysis decision for custom options is usually made with series of individual questions that have custom Likert options as response from participants. Since the responses to our custom Likert questions are unique and stand-alone, hence the analysis of these responses is done as Likert-type items. Modes, medians, and frequencies. And moreover, the designed series of questions lets to measure a particular trait by combining the responses, hence the mean and standard deviation also considered to describe the scale.
Keywords: Construction project management, Change request, Change order management, Change formation path analysis,Dynamic configuration management, Construction planning, Change request management, General construction, Engineered construction, Likert-Scale
Cite this paper: Murlidhar A. Lokhande, Farouk Saifyahya Ahmed, Change Request Impacts towards Construction Projects in Yemen- An Empirical Study, Management, Vol. 5 No. 6, 2015, pp. 161-174. doi: 10.5923/j.mm.20150506.01.
Article Outline
1. Introduction
- Change request on a construction project is a work that added to or deleted from the original scope of work of a contract which alters the original contract amount or completion date, unavoidably a change request represents a problem on the project in terms of additional cost, or additional time or both. Change requests play a significant role in construction because they have a great impact on cost, schedule, quality, safety, and productivity. So, they are one of the major causes of project failure.Approximately every construction project throughout its lifecycle confronts with numerous changes which frequently bring about cost and schedule overruns quality defects along with various unfavorable impacts. Actually changes happen due to the uniqueness of each construction project as well as restricted resources available for planning such as time, money and manpower. The formal way of implementing of changes in the project is by the Change request which authorizes the contractor to execute defined changes in the project. These changes are often the origin of project disputes and future claims.Change request is the most critical part in any construction project, as they are occurring by any parties which involved in it. Therefore, causes which influence change request and its effects on construction project are very much critical for any construction firms. Impact of change request on construction projects and effective management of change request is required to be done. They may change from project to project, place to place, time to time and also with respect to the type of work.
2. Related Work
- Change requests in construction projects occurs against work implemented, construction approach, quantity of the work and result in changes of amount of resource associated to labor and material. The construction industry accepts these change requests as a part of the process and follows amicable strategies to handle these change requests.The study by Thomas and Napolitan [2], Ibbs [3], states that clients task of change management becomes challenging due to the wide differences in the causes of change orders. In the paper [4], Leonard et al. give the causes of change orders as of 3 types such as, errors and omission in the design, changes in the design, and unfamiliar conditions not foreseen. The study of Johnson [5] gives 4 different conditions and states that the cause for change orders could be any one of them. The factors given are, the geographical conditions documented before and the actual different conditions found below the surface later, the differences that appear contrary to assumed conditions in the work of re-modelling prevailing building, client change requests, and finally reviews of regulatory mechanism.The causes of change orders in construction projects have been studied by different researchers who have given several strong reasons behind the change orders. A study [6] by Hsieh et al. takes into account, ninety different successfully implemented public construction projects in Taipei metropolis, Taiwan. The change orders recorded of projects finished prior to year 2000 are reviewed with a comprehensive orderly classification of the causes affecting the change orders. The causes are classified first into 2 categories, i.e. technical and administrative causes and further grouped into 9 sub categories. A ranking is given to the change orders based on their impact levels of 7 factors and 34 causes. A study based on Taiwan highway construction projects by Wu et al. in the paper [7] focuses on the Second National Highway construction project. The review collected all the project management approved and issued change orders and analysed change orders of 1038 in total. The analysis finds 34 different causes which are classified into 4 groups based on who has introduced the change in terms of, owner, design consultant, on-site construction unit, or external parties which also comprises of all other parties not belonging to the first 3 groups.In the paper [8] a review of 865 construction projects by Hanna et al. finds that in 87 per cent of the completed projects, 6413 different sizes change orders implemented. The study finds the causes of change due to, insufficient field investigations, uncertain specifications, plan errors, or changes or mistakes of the design by the engineers consulted and concluded that of the total 6,413 change orders one-third of them were avoidable.The paper [9] conducts a survey of huge size building construction projects in YEMEN’s eastern province by Al-Dubaisi. The study attempts to determine the major reasons behind the change orders and their level of impact and states the primary reason of change orders are the owner initiated changes in the plans and the secondary reason being changes in material or procedure or both.The study by Wu et al. in the paper [10] observes that the construction delays and cost escalations in maximum number of public construction projects is mostly due to change orders which impact morale, quality, and result in disputes legally. Similarly a study by Finke in the paper [11] states the change orders impacts on the working condition may be, deviation of resources, weakening of skilled labour, congestion in the work places, stacking of trades, discrepancies in supervision, disruptions in continuity of work, and hence overall delay in all the activities.A categorization of the impacts of change, divides the change effects into two types, direct effects and indirect effects. A direct effect of a project change for instance is rework in a project which is a major cost factor impacting a project, sometimes nearly 10-15% of the total project cost, as stated by EPSRC (Engineering and Physical Sciences Research Council) [12]. An indirect effect also impacts the cost and schedule of the project according to the changes in the project. A second type of classification of the effects of change orders, categorizes [13] the effects into two types, direct effects and consequential effects, which is by the CII (Construction Industry Institute). The effect as a result of a change causing impact in the same project scenario where the change has been implemented is a direct effect, whereas the effect due to a change resulting in an impact in another project scenario and not in the same scenario in which the change was implemented is known as a consequential effect. These two types of effects due to a change have impacts of cost or time or both.In the paper [14] by Assaf and Al-Hejji, a survey of YEMEN states different kinds of project of construction, attempts to find the causes of delay and establishes that according to the projects stakeholders the change orders are the most general cause of delay. A survey of similar nature in Jordon by Al-Moumani [15] and in Hong Kong by Chan et al. [16] finds the change orders to be the major reason of delay in construction projects.The study of change effects on labour productivity in the paper [17] by Leonard reviews 90 claim cases of different contracts in every aspect. The author categories the cases into, civil/architectural and mechanical/electrical groups and depicted the percentage loss of productivity as a function of the percentage of the change related total work hours. The study finds productivity loss of 10-20 per cent for every 4-5 fold increase in percentage of work hours expended related to change.The work of Hanna and Gunduz in the paper [18] for controlling of change orders, suggests minimizing change orders processing time or reduction in the time in-between a change order’s initiation and subsequent approval, which according to them will result in lesser loss of productivity.An approach for decreasing changes of design in the paper [19] developed by Westmoreland is based on identifying in the review process most of the design changes, and suggests incorporating two criteria which are, first a recheck of the plan followed by a review of the specifications and second a review of the constructability. In minimizing rework, specifically related to design changes by Love in the paper [20], shows the strategies that can be implemented such as, freezing the scope of the design, value management (VM), constructability analysis, and teambuilding. The work by Love et al. [21] for decreasing the rework in construction projects mostly as a result of the common change orders, offers several suggestions such as, client and end-user requirements determination, comprehension and mitigation of change with suitable strategies, the change and errors potential determination in terms of risk assessment based on contract documents auditing, and enhancing skills and knowledge with the help of programs providing training.
3. Research Objectives and Methodology
- The study aim is exploring the change requests of construction projects of linear model implemented in YEMEN and includes all projects of all regions in the state. Apart from this main objective other definitive objectives are, (1) identifying the most significant causes, (2) determining the most authoritative party of all, (3) identifying the most significant impacts of all, and (4) determining the best practices for change order management and control.Based on the literature review results and the above research objectives, a survey is designed with questionnaire for construction projects owners, consultants and contractors. The MoT (Ministry of Transport and MoWE (Ministry of Water and Electricity) are part of the owners surveyed in all the branches in the entire province of YEMEN State. The consultants certified in design and projects supervision by the owner group are surveyed. The contractors surveyed are those who have been rated by the YEMEN Contractors Classification Agency as grade I or II top contractors. In every sub-population sample, the size is calculated using the explorative data analysis [22] and the data is analysed based on different methods of statistical analysis with predictive analytics SPSS™ software and tools such as Excel™.
4. Analyzing Likert Response Items
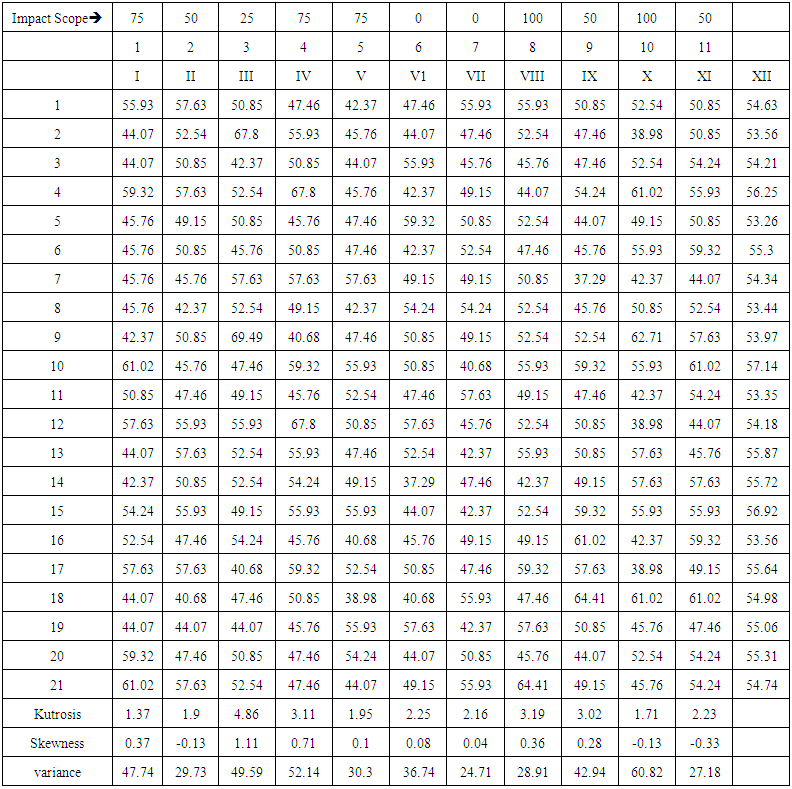
- To properly analyze Likert data, one must understand the measurement scale represented by each. Numbers assigned to Likert-type items express a "greater than" relationship; however, how much greater is not implied. Because of these conditions, Likert-type items fall into the ordinal measurement scale. Descriptive statistics recommended for ordinal measurement scale items include a mode or median for central tendency and frequencies for variability. Additional analysis procedures appropriate for ordinal scale items include the chi-square measure of association, Kendall Tau B, and Kendall Tau C.Likert scale data, on the other hand, are analyzed at the interval measurement scale. Likert scale items are created by calculating a composite score (sum or mean) from four or more type Likert-type items; therefore, the composite score for Likert scales should be analyzed at the interval measurement scale. Descriptive statistics recommended for interval scale items include the mean for central tendency and standard deviations for variability. Additional data analysis procedures appropriate for interval scale items would include the Pearson's r, t-test, ANOVA [40], and regression.The exploration of the survey responses, the scope of negative impacts of change requests and possible recommended remedies.The survey Questioner used were explored in [43]. The target audience and the scope of the survey was explored in our earlier contribution [43]. According to the responses given by the clients, the possible consequences of count 21 against change requests and their impact index under dimensions of impact severity, impact scope, impact factor and the impact of recommended remedies were assessed and explored in the form of tables, bar and box charts.The impact index was is measured by
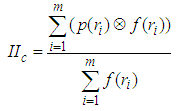 Here in the above equation
 is impact index of the consequence
  is impact percentage allotted to response
  and the
  frequency of the response
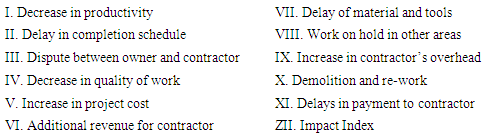
4.1. The Impact Index Analysis of the Responses to Survey 1
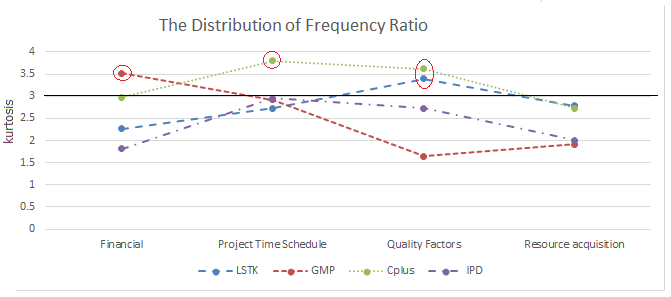
- The response factors of the survey 1 are financial, Project Time schedule, Quality and Resource acquisition. The max impact (above the average impact) is observed from the consequences represented as query no 1, 2, 3, 4, 5, 6, 7, 9, 10, 12, 13, 15, 16, 18, 19, 20 and 21 in survey questioner (refer [43] for questioner details) and consequences referred by query no 8, 11, 14 and 17 also not negligible though they are lesser than the mean of the impact index but nearer to that. These consequences referred by query no 8, 11, 14 and 17 are found to be less significant since the current project management practices making projects well-ordered in regard to these consequences. The response against all queries are with similar frequency towards the impact factors called financial, Project Time Schedule and Quality Factors, but in the case of resource acquisition the clients are having divergent opinion, which can be concluded through the kurtosis observed (this factor is having kurtosis more than 3 and that represents the divergence of the clients response [42]) (see fig 1). The observations from the response frequency of all clients towards survey 1, also indicating that the frequency ratios towards the factors finance, Project Time Schedule and quality factors are fit but in the case of resource acquisition few responses are emerged as outliers (see figure 2). The response frequency ratio against factors financial, project time schedule are highly influenced against the consequences of the change requests and the third factor quality is having negligible impact, which in in account under the condition like if finance and scheduled time not influenced, but the last factor resource acquisition is not at all influencing the impact (see fig 3). The similar strategy of assessment carried out on the responses given by the different client types.
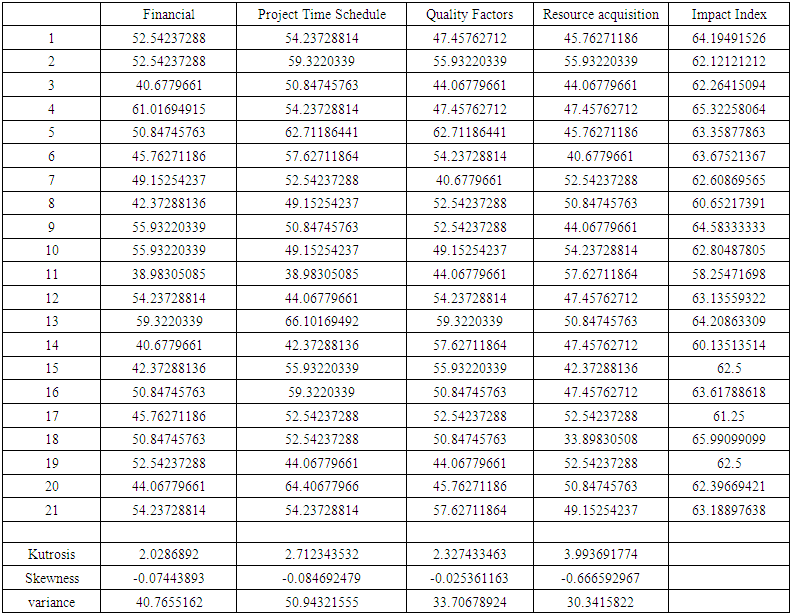 | Table 1. Response Frequency from all clients against survey 1 and impact index |
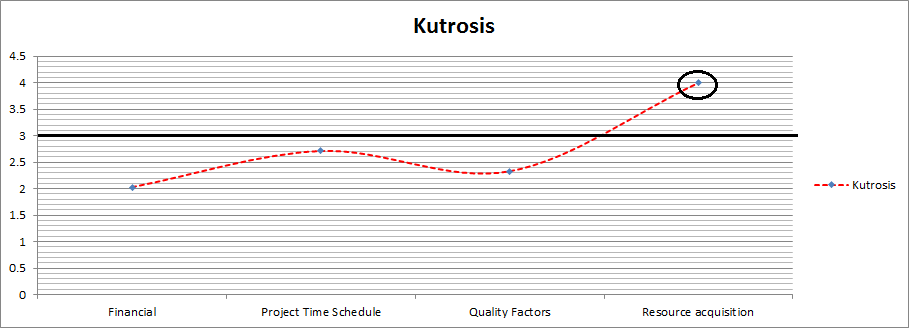 | Figure 1. The kurtosis observed for factors financial, Project Time Schedule and Quality Factors and resource acquisition from the responses of all clients against survey 1 |
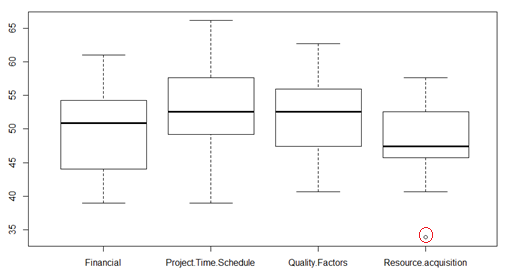 | Figure 2. The outliers observed for factors financial, Project Time Schedule and Quality Factors and resource acquisition from the responses of all clients against survey 1 |
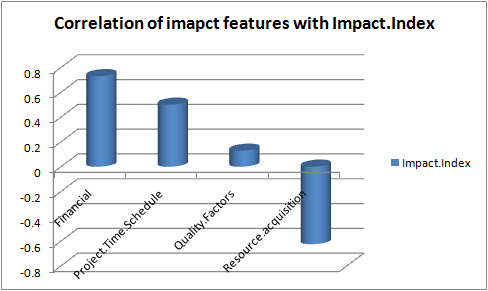 | Figure 3. The correlation observed for factors financial, Project Time Schedule and Quality Factors and resource acquisition to impact index from the responses of all clients against survey 1 |
 | Figure 4. The kurtosis observed for factors financial, Project Time Schedule and Quality Factors and resource acquisition from the responses of different clients against survey 1 |
4.2. Impact Index Analysis of the Survey 2
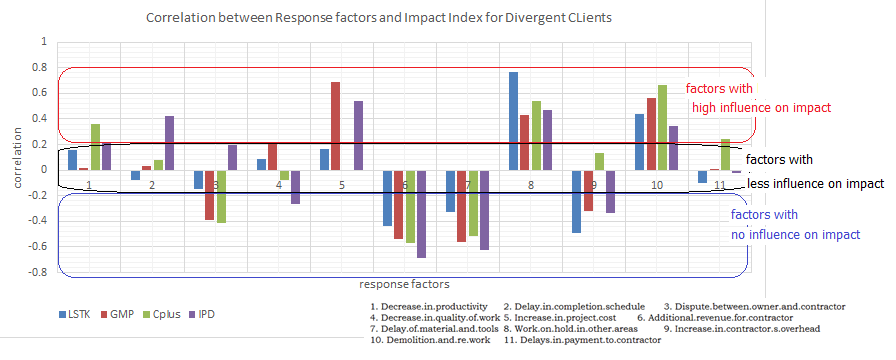
- The number of response factors of the survey 2 are 11 (see reference [43] for detailed exploration of each factor and see figure 5 for listing). The max impact (above the average impact) is observed from the all consequences represented as queries in survey questioner [43]. The response against all queries are with similar frequency towards the survey 2 except to Likert options 3, 4, 8 and 9, which is due to the diversification of the clients opinion against the queries 3,4, 8 and 9 in survey 2. This is concluded through the kurtosis observed (see fig 5). The observations from the response frequency of all clients towards survey 2, also indicating that the frequency ratios towards the all factors are fit except to factor 3 since the few responses to the query 3 are emerged as outliers (see figure 6). The response frequency ratio against queries 1, 2, 4, 5, 9, 10 and 11 are highly influenced against the consequences of the change requests and the frequency of response given to query 8 is having minor influence on change request consequences and the frequency of responses to queries 3, 6 and 7 are not at all having influence on change request consequences (see fig 7). Further empirical study for each client level also concluding the similar impacts (see fig 8 and fig 9).
 | Table 2. Response Frequency from all clients against survey 2 and impact index |
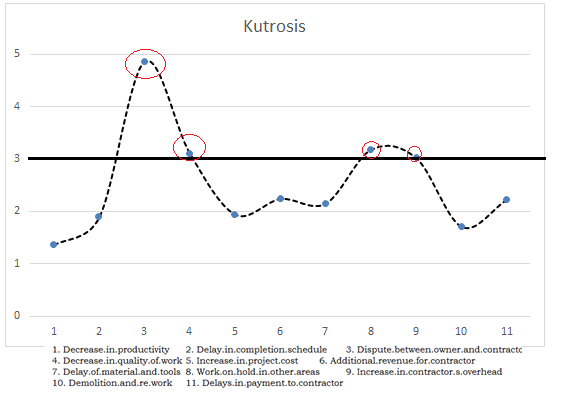 | Figure 5. The kurtosis observed for all 11 factors from the responses of all clients against survey 2 |
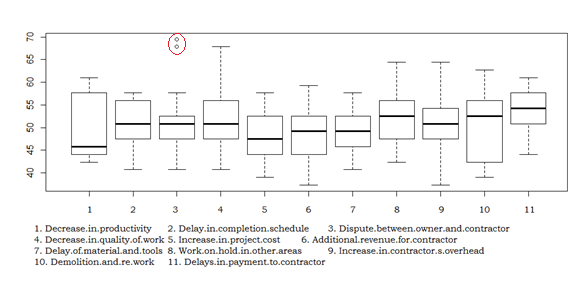 | Figure 6. The outliers observed for all 11 factors from the responses of all clients against survey 2 |
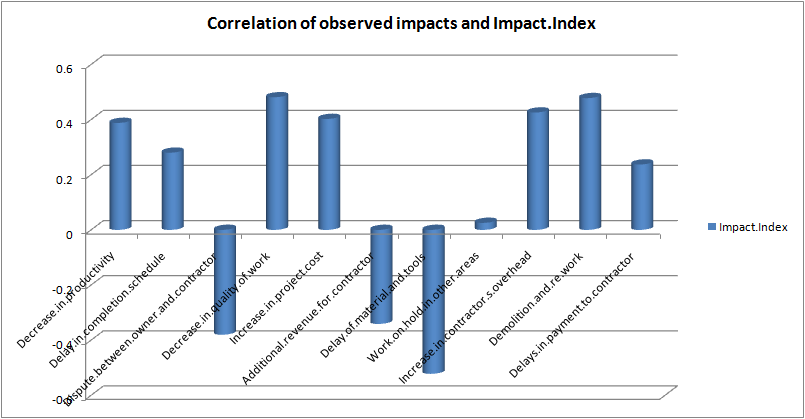 | Figure 7. The correlation observed for all 11 factors to impact index from the responses of all clients against survey 2 |
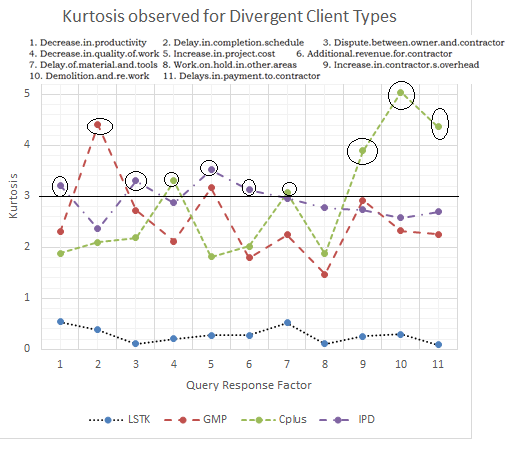 | Figure 8. The kurtosis observed for all factors from the responses of different clients against survey 2 |
 | Figure 9. The influence of response factors towards impact index observed from responses against survey 2 given by different clients |
4.3. Impact Index Analysis of the Survey 3
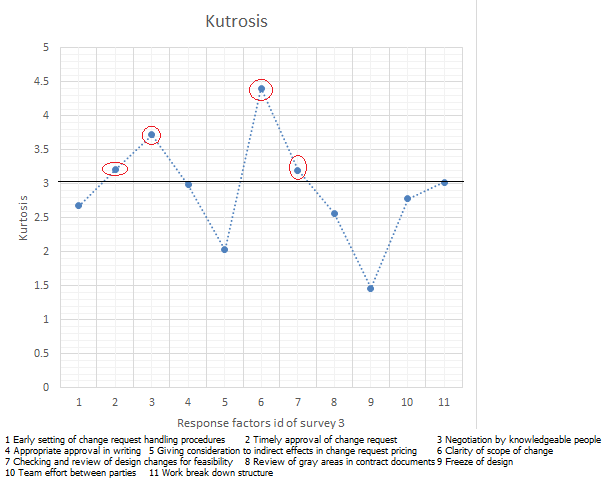
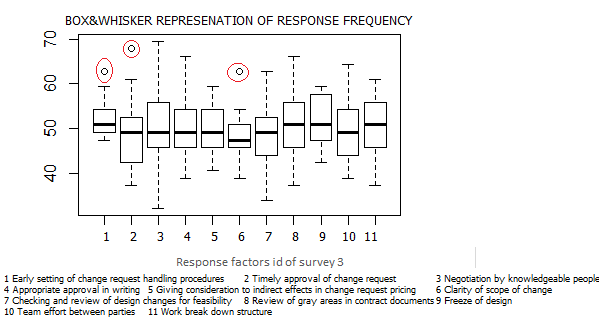
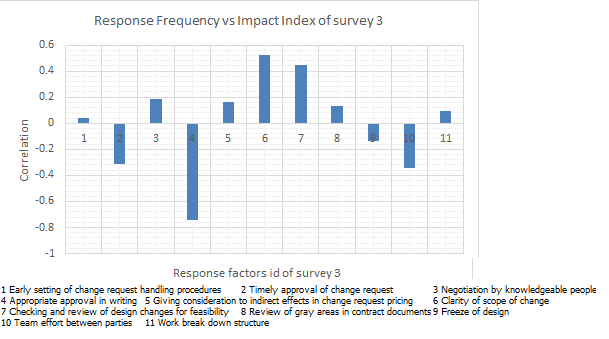
- The number of response factors of the survey 3 are 11 (see [43] for detailed exploration of each factor and see figure 10 for listing). The max impact (above the average impact) is observed from the all consequences represented as queries in survey questioner [43]. The responses (see table 3) against all queries are with similar frequency towards the survey 3 except to Likert options 2, 3, 6 and 7, which is due to the diversification of the clients opinion against the queries 2, 3, 6 and 7. This is concluded through the kurtosis observed (see fig 10). The observations from the response frequency of all clients towards survey 3, also indicating that the frequency ratios towards the all factors are fit except to factors 1, 2 and 6, which is since the few responses to the queries 1, 2 and 6 are emerged as outliers (see figure 11). The response frequency ratio against queries 3, 5, 6, 7, 8 and 11 are highly influenced against the prevention factors to the consequences of the change requests and the frequency of response given to query 1 is having minor influence on impact index and the frequency of responses to queries 2, 4, 9 and 10 are not at all having influence on impact index (see fig 12). Further empirical study for each client level responses to survey 3 also concluding the similar impacts.
 | Table 3. Response Frequency from all clients against survey 3 and impact index |
 | Figure 10. The kurtosis observed for all 11 factors from the responses of all clients against survey 3 |
 | Figure 11. The outliers observed for all 11 factors from the responses of all clients against survey 3 |
 | Figure 12. The correlation observed for all 11 factors to impact index from the responses of all clients against survey 3 |
5. Conclusions
- The large construction projects are highly influenced by the frequent change requests that are due to partial information, conventions and subjective practices of the construction authorities. Due to the acceptance of these change requests, the construction projects effected by the consequences like cost overrun, time overrun and poor quality. Hence the change management is crucial issue in construction projects and can be balanced with well administrative process towards construction project agreement between project owner and construction company authorities. The sensitive factors of the requirements and the information given by the project owner can be analyzed if and only the change causes are explored properly. Hence in this regard the information regarding the causes of change requests and their impacts observed by the industry experts is collected through survey strategy and the same is analyzed statistically to conclude the cause of change requests and their impacts. This statistical assessment revealed that (i) the working relation between principal parties in the construction process should be good. The involvement of project owners during the design and construction is mandatory, (ii) the most common method for compensation is the Negotiated fixed price (lump sum) and cost is the most driving factor for change order, (iii) the order of principle parties in a construction project towards a change request frequency is owner, consultant and last is construction authority. The majority of causes those initiate change requests are improper synchronization between construction authority and consultant, design flaws and over looked factors in design, engineering significances, dynamic plan and design changes by the owner of the project, (iv) The observations from the statistical analysis indicating that approximately 45% of the change request impact leads to project cost overrun, 30% leads to schedule overrun 11% leads to quality underrun and rest 14% is reflecting many of these three impacts. These impacts much of the time leads to disputes between principle parties. Henceforth, it is obvious to quote that the fair and professional relation between principle parties leads to productive and effective change request management, which includes forecasting the change proneness and their impacts, also the productive discussion between principle parties to handle the foreseen change, (v) prior agreements between principle parties about the change order management will helps to avoid disputes between principle parties of the construction project and last but not least (vi) An evaluation check list can be prepared by the construction authority, which is based on their past exposure in change request management helps all principle parties to set right the flaws in requirement exchange.