-
Paper Information
- Paper Submission
-
Journal Information
- About This Journal
- Editorial Board
- Current Issue
- Archive
- Author Guidelines
- Contact Us
Management
p-ISSN: 2162-9374 e-ISSN: 2162-8416
2014; 4(5): 112-122
doi:10.5923/j.mm.20140405.02
Getting the Message: Front of Package Labeling
 Abstract
 Reference
 Full-Text PDF
 Full-text HTML
Gregory P. Clare1, Katie Burghardt2
1Design, Housing, and Merchandising, Oklahoma State University, Stillwater, U.S.A.
2Human Nutritional Sciences, Oklahoma State University, Stillwater, U.S.A.
Correspondence to: Gregory P. Clare, Design, Housing, and Merchandising, Oklahoma State University, Stillwater, U.S.A..
| Email: |  |
Copyright © 2014 Scientific & Academic Publishing. All Rights Reserved.
The nutrition fact label has been on foods in the United States since the 1990 Nutrition Labeling and Education Act. Many countries have started utilizing front of package labels to inform consumers more quickly, and highlight the nutritional risks and benefits of food items. The purpose of this focus group study was to determine what food label designs are most appealing to consumers and label modifications that would be most effective in encouraging better nutritional choices. Results revealed that having labels on the front of packages was not as important as improving the information on the current nutrition facts panel.
Keywords: Message framing, Consumer behavior, Nutrition, Packaging, Labelling
Cite this paper: Gregory P. Clare, Katie Burghardt, Getting the Message: Front of Package Labeling, Management, Vol. 4 No. 5, 2014, pp. 112-122. doi: 10.5923/j.mm.20140405.02.
Article Outline
1. Introduction
- The U.S. Nutrition Labeling and Education Act of 1990 standardized the nutrition information found on manufactured food items (U.S. Food and Drug Administration, 1990). The nutrition facts label is monitored and regulated by the Food and Drug Administration. Food labels are intended to educate individuals about the nutritional components of different foods (Levy & Fein, 1998). It was also expected that the Act would allow consumers to make more informed food choices (Levy & Fein, 1996). Levy and Fein (1998) suggested that nutrition labels can be used to compare similar foods products, evaluate claims present elsewhere on the product, decide if a product is too high or low in something for an individual diet, or track what a particular food contributes to daily intake. Calories, calories from fat, total fat, saturated fat, cholesterol, sodium, carbohydrate, dietary fiber, sugars, protein, vitamin A and C, calcium, and iron have to be present on the Nutrition facts label (Drewnowski et al., 2010). Despite a plethora of nutrition information and tools such as the nutrition facts panel being readily available in the United States, obesity and chronic diseases still continue to rise (Berning et al., 2010).Following a more healthful diet can decrease the risk for many diseases, including heart disease, high blood pressure, osteoporosis, diabetes, and some cancers (Soederberg Miller & Cassady, 2012). When used correctly, consumers can determine the amount of total fat, calories, sodium, carbohydrates, sugars and protein in a product by reading the nutrition facts label (Post et al., 2010). The study conducted by Post et al. (2010) revealed that when an individual with a chronic disease is directed by a health professional to read the label, there is a 50% chance that the patient will do so. Post et al. (2010) also found those who read food labels consumed less energy, saturated fat, carbohydrates, and sugar. They also consumed more fiber (Post et al., 2010). Another study conducted by Balasubramanian and Cole in 2002 found that individuals who are highly motivated and less knowledgeable benefit more from the Nutrition Labeling and Education Act than other groups (Balasubramanian & Cole, 2002). They also found that participants paid closer attention to “negative” items on the panel such as fat and sodium than “healthier” nutrients (ex: calcium and vitamins).
2. Why do Consumers need to Understand the Nutrition Facts Panel?
- With a great deal of emphasis on disease prevention and nutrition in the United States today, it is important that consumers make the necessary steps to lead healthy lives. This increase in health awareness has led to an increase in a marketing emphasis on nutrition. It is important for consumers to know how to read the Nutrition Facts Panel so that they are able to muddle through marketing slogans and tactics to understand for themselves if a product is healthful or not. A study by Colby et al. (2010) revealed that 49% of products contain some sort of nutrition marketing. Of this amount, 48% of the products were actually high in saturated fat, sodium and/or sugar (Colby et al., 2010). A study conducted in the UK found that while participants were aware of product claims, when a sugar reduction claim was not accompanied by a reduction in calories the participants felt deceived (Patterson, Sadler, & Cooper, 2012). This type of marketing can also lead to the halo effect, or a situation in which a consumer consumes more of a food because he or she believes it is healthy because of the claims (Zank & Kemp, 2012). A study conducted by Roe et al. (1999) on the impact of health claims found that consumers focused on health information placed on the front of a product, and gave greater weight to the health claim than to the Nutrition Facts Panel (Roe et al., 1999). Therefore, consumers need to be aware of how to use the Nutrition Facts Panel, and not accept a product as nutritionally sound because of the product’s nutrition marketing.Understanding and knowing how to use the Nutrition Facts Panel can lead to a healthier life. A study over trans-fat information on food labels by Jasti & Kovacks (2010) found that trans-fat and low fat diet importance awareness were positively correlated with a higher amount of label use, as well as observance of trans fat information. Those who did not use the label or look at trans-fat information consumed higher amounts of fried foods (Jasti & Kovacs, 2010).
3. Negative Aspects of the Current Nutrition Facts Panel
- Although many consumers feel that nutrition labeling is important, many do not use the labels when making food purchases. In a fast paced world, many feel they simply don’t have time to read and analyze the information provided on the current nutrition facts panel (Berning et al., 2010). People with more time available to spend at a grocery store are more likely to use nutrition labels, but many do not have this luxury (Drichoutis et al., 2006). Many shoppers are also more interested in product price unless they attach importance to nutrition (Drichoutis et al., 2006). According to Graham et al. (2012), some aspects of the current nutrition label may prevent consumers from effectively understanding the information presented. When the literature review on studies conducted using eye tracking on nutrition labels was completed, Graham et al. (2012) concluded individuals use labels more often when they are put in the middle of a product, health components are listed in order by relevance, there is not too much going on visually around the label, the contrast and orientation of the label is increased, the size of the label is increased, and supplemental tools to enhance the label are included (Graham et al., 2012). Another study found that when short health claims are located on the front of a package and all nutrition information is listed on the back, consumers are able to process the information more effectively and are more likely to believe the information (Wansink, 2003).A large number of consumers don’t completely understand how to interpret the information provided to them. Many consumers may not always understand what amounts of nutrients are considered unhealthy. Individuals in 56 countries have reported a misunderstanding, and even a mistrust of food labels (Soederberg, Miller & Cassady, 2012). A study conducted to create a labeling system in university dining found that focus group participants had a lack of nutrition knowledge, and only associated healthfulness with salads and sandwiches (Pohlmeier et al., 2012). A simplified way for consumers to compare healthy and unhealthy options on the label could increase nutrition knowledge.
4. Success Using the Current Nutrition Facts Panel
- While it seems a good deal of Americans don’t understand or have time to use labels, previous research has shown between 45 and 80% of adults have reported using nutrition facts (Ollberding et al., 2010). Another study conducted with university students found 44% of students used nutrition information often or always when buying an item for the first time (Driskell et al., 2008). Label use has also been shown to correlate with better dietary patterns (Ollberding et al., 2010). The final results of the study revealed 61.6% of study participants used the Nutrition Facts panel, 51.6% read the ingredients list and 47.2% observed serving size (Ollberding et al., 2010). A study conducted by Cook et al. (2011) explored whether people with morbidities are more likely to use the Nutrition Facts Panel than those without morbidity, or individuals with only one morbidity. The two morbidities taken into consideration were high blood pressure and high cholesterol, both of which are high risk factors for heart disease. Participants with both conditions were more likely to use the Nutrition Facts Panel than those with normal cholesterol and blood pressure levels, as well as participants with only one condition. They also found that those with only one condition were more likely to use the label than individuals with normal levels (Cook et al., 2011). Another study conducted by Lewis et al. (2009) also found that individuals with chronic diseases (hypertension, hypercholesterolemia, at risk for or having diabetes, being overweight and heart disease) had greater knowledge of nutrition and were more likely to use the Nutrition Facts Panel to observe specific nutrients (Lewis et al., 2009). A study conducted on older Americans by Macon et al. (2004) also found that men 71-80 with a heart related problem were more likely to use food labels than men or women of other ages with a similar diagnoses (Macon et al., 2004). While these studies reveal that the Nutrition Facts Panel is being used to help with symptoms of chronic disease, it is important that the panel be used as a prevention tool as well. Users of nutrition facts labels often have diets lower in fat and cholesterol, eat more fruits and vegetables, and have a higher level of nutrition understanding (Misra, 2007). Therefore, a gap needs to be bridged between those who understand the information and those individuals who do not. Providing nutrition information in a simplified, comprehensive manner could increase the chance of consumers using nutrition facts as a tool, and therefore increase health and overall nutrition understanding.
5. Front of Package Labeling
- Front of package labeling has taken off quickly in Europe. In the United Kingdom, the Food Standards Agency has developed a front of package label resembling a traffic light to indicate the presence of certain nutrients (Switt, 2007). In the U.S., health claims, nutrient content claims, and structure/function claims are regulated. Some health claim topics permitted include fluoride and the risk for dental problems, saturated fat, cholesterol, trans-fat and the risk for heart disease, and whole grain foods and the risk for heart disease and certain cancers (U.S. Food and Drug Administration). Nutrient content claims must meet certain standards to be able to use terms such as “high potency” and “antioxidant” (U.S. Food and Drug Administration). Nutrient content claims also include terms such as “low fat”, “low sodium”, and “contains 100 calories”.Although the FDA regulates the Nutrition Facts Panel and health claims in the United States, some front of package labels companies have placed on the front of their products are not regulated. Most producers choose to include only information they feel makes their product more marketable, such as high fiber levels, low sodium levels, the amount of protein, the low amount of sugar, etc. A study conducted by Levin and Gaeth in 1988 found that when meat packaging was labeled as “75% lean” or as “25% fat” consumers favored the packages labeled as “75% lean” (Levin & Gaeth, 1988). These findings offer some evidence of why companies want to present their products favorably. Front of package labels are also not being put on all products a company produces. Front of Package labels are often found on “diet” or “light” options. Labels are left off of products that have little nutritional significance such as chips or cookies. Summarizing certain nutrition information in the form of front of package nutrition labels could help consumers make better nutrition choices (Vyth et al., 2009). Pointing out the negative aspects of a product may be the best way to translate the healthfulness of a product. Some front of package labeling systems currently being used include percentage guideline daily amounts, traffic lights, percentage guideline daily amount schemes that include nutrients per portion, and the “Facts Up Front” Label. There are also summary systems used that provide a nutritional score. Some of these systems include the NuVal system in the United States, the keyhole symbol used in Sweden, Denmark and Norway, and the guiding stars shelf tag system used in the U.S. (Hersey et al., 2013). The guiding stars system is a similar concept to what the Institute of Medicine’s Committee on Examination of Front-of-package Nutrition Rating Systems and Symbols is considering (Hersey, et al., 2013). The committee is recommending a summary icon that shows calories and ranks products on a three point system. Nutrients taken into consideration would include saturated and trans fats, sodium, and added sugars. This icon would be standardized and required on all products. Exposing people to different methods of highlighting nutritional labeling formats like the NuVal and traffic light system from different countries which may be unfamiliar to U.S. consumers may provide information about the perceived value of the label designs. The traffic light system is gaining popularity in the United Kingdom, and the United States is taking notice. One study conducted in the United Kingdom found consumers wanted the amount of nutrients associated with a red light to be reduced. This study also allowed the investigators to learn that consumers are most concerned with sodium and saturated fats (Balcombe et al., 2010). This study revealed once consumers could understand the nutrients, they wanted the foods available to them to be healthful. Something similar to this might benefit the U.S., a country with high obesity rates, and a generally confusing nutrition fact label. The nutrition facts on foods need to be transformed into a more efficient tool for consumers.
6. Significance of Front of Package Label Research
- It has been determined in previous research that sex, income and education level are general indicators of nutrition label use (Campos et al., 2011). Many studies, including one conducted by Grahm and Laska (2012) show that labels are more likely to be used by individuals that already value healthy choices. Label use has been linked to healthy dietary intake. Factors about the label itself may also increase the likelihood of its use. Label size, color scheme and location can also increase or decrease the chance of a nutrition label use (Bialkova & van Trijp, 2010). While price is also generally considered a major factor in the purchase of groceries, one study conducted in the UK found price did not have a negative effect on label use (Petrovici et al., 2010). As stated before, obesity is a major problem in the United States, and many consumers believe the nutrition information provided on foods needs to be simplified. Many companies are currently using their own forms of simplified front of package labeling, but these labels are generally used as a marketing ploy and only highlight what the producer wants them to. Companies do not want to only focus on the negative aspects of the product as a standardized labeling system might, but highlight positives they think will trigger customers to purchase the product. They are also not being included on all products produced by the companies. These labels need some regulation so that the wellbeing of the consumer is being emphasized as the number one priority.
7. Research Questions
- 1. What does nutrition label information mean to consumers?2. How do consumers describe effective nutrition labels?3. How would consumers label packaging with nutrition labels?The significance of this research is that there is still a very small amount of research available concerning front of package labeling in the United States. While marketing research is a very important tool in studying front of package nutrition labels, more nutrition researchers should take an interest in these labels. Front of package labels could be an important tool in nutrition education and prevention of obesity and chronic disease among consumers. This is why research should be conducted on these labels. Front of package labels should be transformed into something helpful, instead of being used by big companies to influence profits. The health of Americans could greatly improve from modification of front of package labels. Before a standardized labeling system can be created, it must be determined what labels U.S. consumers will be responsive to. Another question would be: what information are consumers most concerned about? What nutrients need to be included on a front of package label? A great deal of research still must be conducted to determine what consumers will actually look at and respond to so that label designs produce optimal behavioral effects to improve healthy food choices. MethodsThe preliminary study consisted of qualitative research methods utilizing focus groups to obtain preliminary data to better understand how front of package labels influence the choices of consumers. The pretest consisted of four steps, and a laddering approach was used. The laddering design consisted of each step or “rung” of the ladder being more detailed, with the first “rung” being extremely general, and the final “rung” providing the answer to our main study questions. Our goal was to gradually increase the participants’ cognitive evaluation of nutrition labels by moving from general label considerations to the participant’s ultimate control of the size and placement of labels on consumer packaged goods through a label design drawing activity. ParticipantsTwenty individuals who attend a large university in the south were recruited to participate in the focus groups. A week was set aside and interested individuals were asked to provide availability so that actual meeting times could be set. Four sessions were scheduled. Group members were college-aged Design, Housing and Merchandising students who were rewarded with course credit for their participation. A convenience sample was used for the study and was composed of eighteen to twenty nine year old female college students in a merchandising program who make their own food purchasing decisions and are frequent grocery shoppers. The homogenous sample of female college students provided insights into a group of people that will be useful when designing future quantitative research exploring label perceptions of a representative sample of food consumers. Focus Group SessionsThe focus group sessions were approximately forty-five minutes in length, and each stage required participants from five to fifteen minutes to complete. Video and audio recordings were used during each focus group section and reviewed to uncover information that may have been missed during the sessions. Each focus group had four to five participants. Participants spoke often and openly during the focus groups. The facilitator sought feedback from a few individuals who were more reticent by asking if they had any information to add to the discussion. In these instances, participants agreed with or repeated something another group member said, or provided new ideas and opinions. Review of video tape of the sessions indicated that participants periodically sought help from a fellow participant setting next to them by asking questions about procedures to follow, but not on specific responses to record on their worksheets during research stages two to four. Participants completed fill-in booklets during two stages of the focus, and there was no video evidence that participants copied the responses of fellow participants into their test booklet by observation of peer responses. Stage One4. The group sessions began with the first stage, which consisted of general questions on nutrition, nutritional concerns, nutrition fact labeling, and nutrition label use to help participants begin focusing on nutrition label concerns. The following are the questions asked: 1.) When grocery shopping, what influences the choices you make? 2.) What are your nutritional concerns when shopping? 3. In your opinion, what makes a product healthy? 4.) How do you use nutrition labels? 5.) What aspects of nutrition labels are helpful to you? 6.) Is there anything you feel could be altered on nutrition labels and why? Audio responses to these questions were recorded and later transcribed into Microsoft Word. The stage one questions were designed to address research question 1: What does nutrition label information mean to consumers?Stage Two1. After the discussion portion was completed, participants were shown sixteen pictures of currently used front of package and supplementary nutrition fact information from Europe on PowerPoint slides. This slide section began with an instruction slide, which stated: “ For the following slides, please write the first three words that come to mind when viewing this picture”. They were given worksheets with the pictures on them and verbally asked to write the first three words that came to mind about each label on a provided worksheet. The students were given about thirty seconds of time to view each slide and write down three words. The principle investigator kept track of the time with a stopwatch. After the sixteenth slide viewing was complete, worksheets were collected. The focus group facilitator then proceeded immediately to the next stage.. The stage two activity was designed to address research question 1: What does nutrition label information mean to consumers?Stage Three1. Once participants had completed the sixteen slides, they were asked to look at another set of twenty pictures and provided a new booklet to complete. The stimuli pictures were obtained from the local chain grocery store who gave the researchers permission to photograph various departments in the store. The 20 pictures presented to participants were taken of foods in the organic/natural foods section in both refrigerated and non-perishable food store fixtures. The purpose of this next laddered activity was to provide a sample of some “real world” front of package labeled items with local context to participants contrasted to the European front of package label stimuli in Stage two. Pictures were mostly of cereals, muffins, and other frozen breakfast items. Some of the pictures were of the entire front of the box, some of highlighted nutrition information, and some of front of package nutrition labels. Participants were provided with the following instruction: “For the following slides, write two words about what you like most about the label, and write two words about what you like least about the label”. The participants were then verbally prompted to write two things they liked about each picture, and two things they did not like about the label design on a provided worksheet. About forty seconds were provided for each slide. The stage three activity was designed to explore research question 2: How do consumers describe effective nutrition labels?Worksheets were collected at the end of the slide show, and the session proceeded to stage four.Stage FourStage four consisted of two steps. Participants were provided with a picture of an exploded box that depicted the top, bottom, front, back, left and right of a general packaged food box (See exploded box picture in the appendices). In the first step, the participants were asked to mark on the box where they would put a nutrition label, what size it would be, and were asked to put as many nutrition labels as they felt would be helpful and appropriate on the hypothetical box diagram to assist a consumer’s evaluation of nutrition information. They were given about sixty seconds to complete their label placement designs before the pictures were collected. 5. Next, in the second step, participants were provided with another box picture and asked to draw where a single nutrition label should be placed, and the size of the label. This task sought to understand how and where an optimized design of a single label would be executed and how placement was prioritized by participants with limited choices compared to multi-label front of package designs they had viewed during the previous two stages of the focus groups. The participants were given sixty seconds to complete their label drawing before the pictures were collected. The stage four activity was designed to better understand research question 3: How would consumers label packaging with nutrition labels?This was the final activity completed in the focus groups. Upon completion participants were thanked for participating in the focus groups and dismissed from the session.Preliminary Study AnalysisThe results from the slideshows were assessed using Excel and SPSS to determine frequencies and evolving patterns based on similar responses in the four stages of the focus groups. The data from the preliminary study will be used to create an experimental design to better understand consumer label preferences based on some of the major evolving themes uncovered in the focus group response triangulations. Trustworthiness of the interpretation of data was achieved through independent analysis by the research team of evolving dimensions followed by combination of all dimensions and agreement by the researchers about the relative rank of evolving themes. Stage OneQuestions used in stage one were designed to obtain information about what the participants find important nutritionally (what would be most important to them on a front of package label), and what their opinions are of the current nutrition labels. The focus group conversations were recorded and transcribed to text. Keywords were then aggregated and analyzed in Excel to identify repetition and patterns of words around central themes. A preliminary coding scheme was derived by the researchers. Once the coding scheme was reviewed and agreed upon, a final codebook was made. Codes were collected and then coded by themes by the principal investigator and co-researcher. The themes were then mapped into a mindmap model and analysed (Figure 1).Once organized in Excel and mapped, the findings from stage one were examined. There were some areas of nutrition information that groups seemed to focus on a great deal. Calories were discussed often, and many said they looked at them on the nutrition facts panel. Carbohydrate grams were also brought up frequently. Study participants also said they used nutrition information to plan out grocery shopping trips ahead of time to meet their health goals. Also, participants expressed a desire to see improvements in the current nutrition facts panel. The following are comments from focus group participants:S5: “You have to have an eighth grade reading level here, so they should write nutrition labels at that level”S2: “If they were brighter colors I think people would notice them more. More visually appealing and I would pay more attention to them.”S5: “I think that how they have really small print what ingredients are in there like red dye 40 and stuff like that. I think that needs to be bigger. So that way people will know what’s in their food.”Four main nutritional components discussed by participants were identified. They were fat, sugar, protein, and sodium. Preservatives and additives were also brought up several times. The following are some quotes from participants related to nutritional components:S3: “The energy you will have and I also look at the carbohydrates and fat content as well. I really don’t look at the calorie content, in the end; it’s what nutrition you are getting out of it. But if the carbs are really high I will try to stay away from that. But if it’s a good kind of fat I will choose that food.”S1: “I focus on sugars as part of healthier choices and want low amounts of sugar. I try to look for things, like if I want something sweet I look for a piece of fruit and not a big chocolate bar with tons if sugar in it.”Group participants also discussed serving sizes often. Calculating portion information was the main aspect discussed. Participants mentioned that simplifying the way that serving sizes and portions are expressed would make nutrition labels easier to use. The following are direct quotes from participants concerning serving sizes:S2: “I look at serving sizes. I mean, I think society as a whole doesn’t know serving sizes, and I am really bad at it too, but I am trying to look at them more.”S5: “Sun Chips are my weakness. I was sitting there eating them and then I looked at the back and I realized I ate over half the servings.”S4: “I like to look at the serving size and see just how many servings are in the package. Like my boyfriend will cook the entire package and I tell him this is meant to feed six people and you need like half of that.”In each of the focus groups, there was one participant who said they did not particularly care about nutrition facts and did not use the information on packages. The following are quotes from some of the individuals who don’t usually look at nutrition information:S1: “Honestly, I never look at them.”S3: “I look at them if I am buying something new, but if I buy it often, I never look at it every time.S4: “I don’t pay much attention to the ingredients. I just buy what I like.”
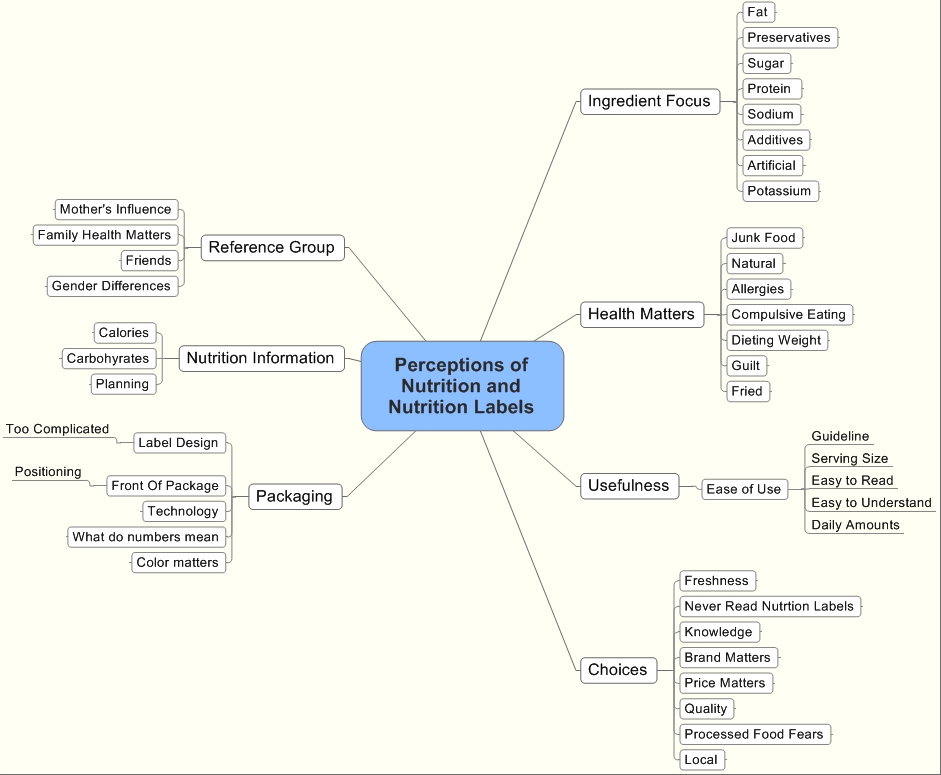 | Figure 1. Stage 1 Mind Map |
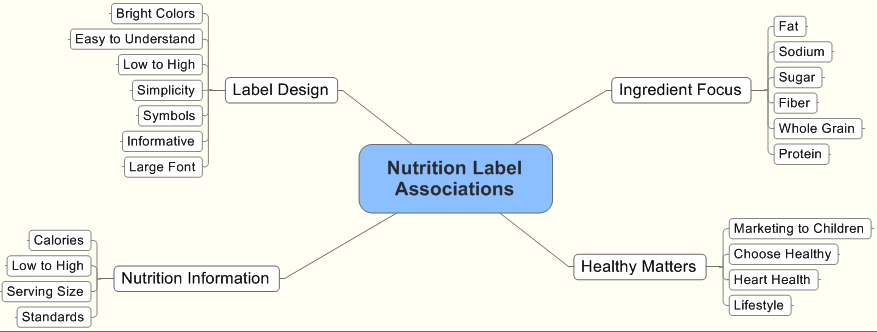 | Figure 2. Stage 3 Mind Map |
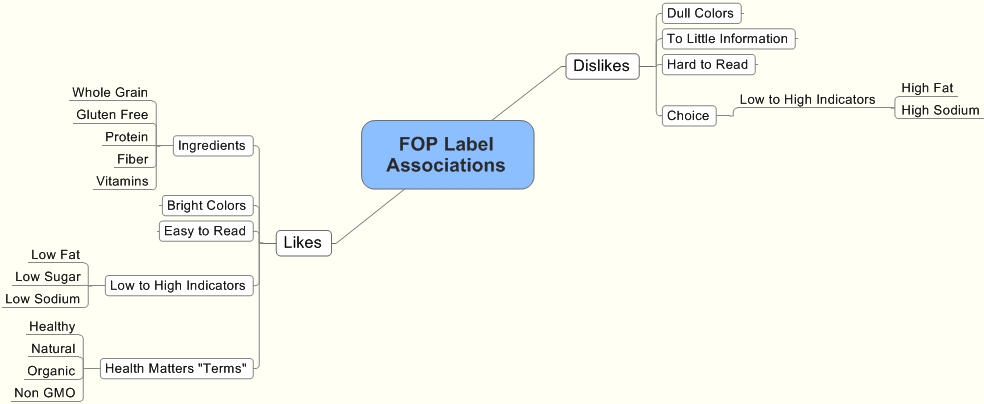 | Figure 3. Stage 3 Mind Map |
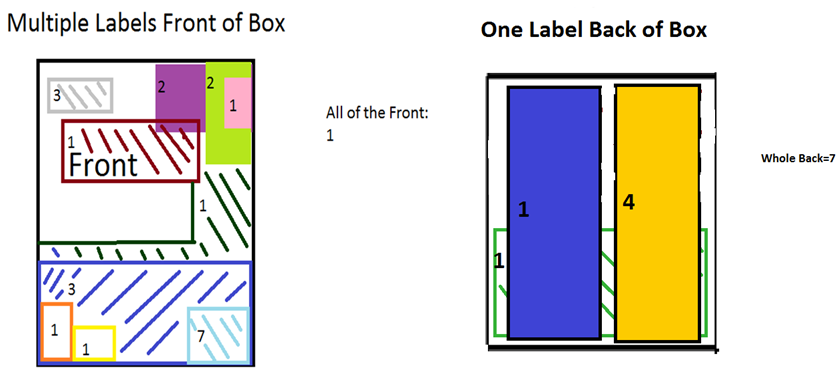 | Figure 4. Stage 4 Mind Map |
8. Reflection
- Upon compiling all of the focus group data results, it was found that four major areas seemed to influence consumer perceptions of nutrition information labeling. We mapped out these influential areas in a model. They include: attitudes and emotions about food, the health impact of the food, seeking out particular nutrition information, and the perceived usefulness of a label. It was also apparent that words such as “natural” and “organic”, as well as words such as “low” or “high” were influential to the participants when determining healthfulness. Color, used in the front of package labels, as well as ease of use also influenced the participants.What these findings revealed to us is that while participants feel a front of package label would be a nice addition if more than one label is present on an item, the back of the package is still ideal if only one label is present. These findings support the previously discussed study by Wansink (2003) in which he found having a short health claim present on the front of the package along with the full nutrition information on the back allowed consumers to process the information more effectively (Wansink, 2003). However, most would like to see the back of package label to be more prominent than the current nutrition facts label. After reviewing the word repetition data and the box picture data, it was felt individuals are not particularly concerned with front of package labeling. The main focus of the individuals in the focus groups turned out to be actual nutritional composition of food sources, the ease of label use, and how the nutrition information was relayed to the consumer. Having a label on the front did not come up often in the written, or spoken portions of the focus groups. Therefore, for a future study, it was chosen to focus on the simplification and improvement of traditional back of package nutrition facts labels. By doing so, it was hoped that consumers would use the information more often, and that the information provided would influence consumers to make more healthful choices.
9. Limitations
- Several limitations were encountered throughout the course of this study. First, the sample used for our preliminary qualitative study, as well as our larger quantitative study were not representative of the entire U.S. population. The preliminary study group was recruited from a college campus and a homogenous sample was selected to better understand a group of consumers to assist in creating future quantitative studies of nutrition label perceptions. Participants were entirely female and were between the ages of eighteen and twenty-nine. Future research should seek to measure a more representative sample in which different groups of consumers delineated by factors such as age, gender, ethnicity, educational background, and income use labels in addition to their preferences for front of package label variants to standard FDA nutrition label designs.
Appendix
 | Figure A1. Control Stimuli Example |
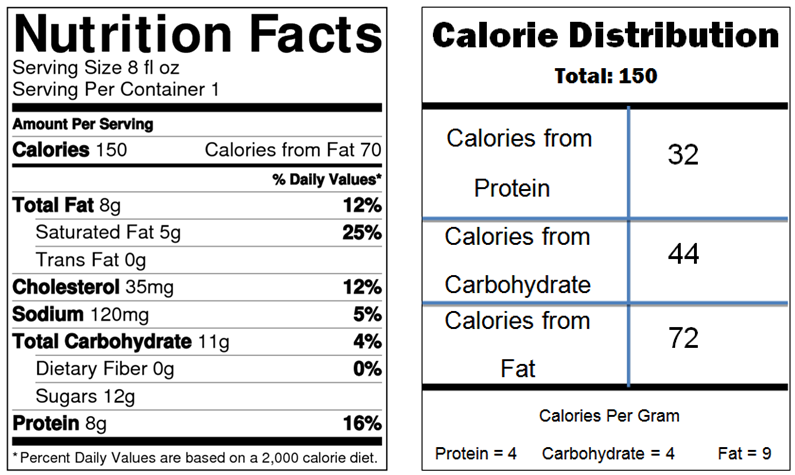 | Figure A1 (cont’d). Calorie Label Modification Example |
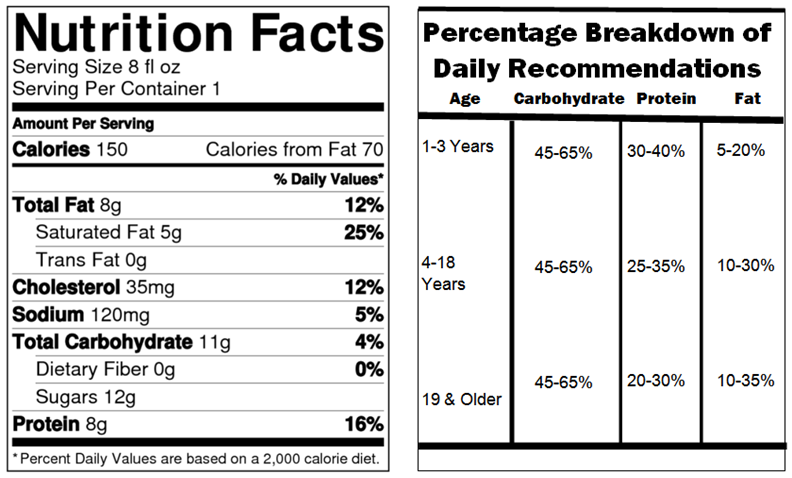 | Figure A1 (cont’d). Percentage Breakdown Label Modification Example |