Daniel J. Fonseca1, Gary P. Moynihan2
1Department of Mechanical Engineering, The University of Alabama, Tuscaloosa, USA
2Department of Civil, Construction and Environmental Engineering, The University of Alabama, Tuscaloosa, USA
Correspondence to: Daniel J. Fonseca, Department of Mechanical Engineering, The University of Alabama, Tuscaloosa, USA.
| Email: |  |
Copyright © 2014 Scientific & Academic Publishing. All Rights Reserved.
Abstract
This paper discusses the development and implementation of a computer-based system to assist automotive engineers in the selection of work procedures and the computation of the associated total build-up time. Once the detailed design was approved by the customer, programming of the standard process time values analysis system began. It was followed by a comprehensive system test, as well as development of both user and maintenance manuals. Before implementing the program, the information system underwent a comprehensive series of tests. The tests checked for system accuracy and efficiency. Carefully designed scenarios were entered into the system and the output confirmed for correctness. Upon completion and verification of the system, the software was installed at the plant. The developed vehicle standard process time values analysis system is capable of discerning between value-adding and non-value adding time activities as well as interpreting different code rules for aligned work procedures.
Keywords:
Automotive, Standard times, Optimization, Informtion systems
Cite this paper: Daniel J. Fonseca, Gary P. Moynihan, Development of a Vehicle Time Values Information System, Management, Vol. 4 No. 4, 2014, pp. 90-97. doi: 10.5923/j.mm.20140404.02.
1. Introduction
Conventional time standards historically have focussed on measuring direct labor. Labor standards are durations, determined by accepted industrial engineering techniques, required by a trained average worker to complete a specific task, according to a prescribed method [1]. They may be derived by observing the activity performed under actual working conditions, or through analysis of historical operational data [2]. Accepted techniques include work sampling, time and motion study, predetermined time systems, and modeling. The physical layout of the workstation and related locations required to accomplish the activity are taken into consideration as well as the material handling activities between workstations. After the most efficient sequence of motions and actions have been determined and documented, the pattern frequently is translated into a predetermined time system, and then checked once again to ensure that it reflects all required work elements [1].The development of standards data is an ongoing task, perpetuated by changing work methods, tooling, equipment, and workplace configurations. As standards data are developed for a specific combination of these factors, they must be updated when any of these factors change in order to reflect the detailed work elements currently required. The importance of accurate standards, and their relevance to manufacturing, has long been acknowledged [3, 4]. Thus, the industrial engineering techniques mentioned are further specified in a variety of industry and government documents, such as the Military Standard (MIL STD) 1567 series. These standards provide a structured approach to determining and using labor standards for projecting and planning production [5]. The issue of accurate labor standards was considered so critical to the successful planning and execution of government contracts, the Department of Defense began to mandate MIL STD 1567A compliance during the 1980's.Calculations supporting a production plan, such as those inferred by MIL STD 1567A, utilize setup and run times. Although detailed work elements for a given task are observed, analyzed, and documented, they are stored at summary levels of setup and run for further usage. Setup is considered to be the time required to convert from producing one specific item type (e.g. part number) to another. Run time is the duration to produce one item from the same part number group. It is in this level and format that standards are normally stored in a file (frequently referred to as the router) for subsequent use in computer-based planning systems. This utilization normally involves the calculation of an extended standard, calculated by combining the setup and run times with the lot size (obtained from the bill of materials, and representing a planned quantity delivered to the workplace) as noted in Equation 1: | (1) |
The extended standard represents the time necessary to complete the task on one part within the incoming lot [1]. This duration is then multiplied by the required number of parts by an MRP/ERP system in order to derive a projected production schedule [6]. The extended standard may be similarly used to establish levels of equipment and manpower necessary to support a production plan. However, despite the most accurate labor standards, the resulting plan may be in error due to the failure to fully consider other operational time aspects. For example, some manufacturing operations may be of an extended duration, but do not require an operator's constant presence to monitor the process. In these cases, the production planners must distinguish the time for an operator to load, monitor, and unload parts, as well as the machine cycle time beyond the labor component. In many cases, current measures of machine processing time do not consider the interval during which the equipment must be committed, as during an operator load/unload sequence, or when the part is cooling down but not actually being processed. These may result in subsequent, and quite significant errors when calculating labor/equipment requirements or part schedules [7].This problem has been recognized in varying degrees. He et al [8] investigated scheduling as a function of processing times. They state, "The job dispatching environment often requires the use of processing time estimates which are inexact and deviate from the true processing times." He and his colleagues developed a dynamic job shop simulation model focusing on the effects of inaccurate processing time estimation regarding scheduling. They agree that a new method of time estimation is needed. The analysis by Zargar [9], regarding the effect of rework on the cycle time, similarly noted the inaccuracy inherent in the existing method of utilizing setup and run times. He recognized that cycle time should be calculated differently. Zarger proposed four different approaches to calculate the expected cycle time, and analyzed how these four different methods affect production planning.In response to this observed deficiency, some computer-based planning systems have included an additional data element, referred to as process time, to supplement the setup and run fields [10]. Process time refers to the duration of equipment use. However, it is seldom clear if this field represents additional time beyond the labor-oriented set-up and run, or an overlap. A clearer definition and guidelines are needed. An alternative approach has been to formulate operations research models for production planning utilizing a more detailed level of the time duration components. For example, Kang, Kim and Rhee [11] applied factors specific to die manufacturing in a multiple linear regression model. The model calculated standard time as a function of variables such as tolerance, planar work, internal and external angles, grinder change, and testing. Dillenberger, Escudero, Wollensak and Zhang [12] developed a scheduling and assignment model that utilized resources divided into storable and non-storable categories, minor and major setups, and primary and secondary weighting factors. These efforts were directed at very specific problem domains. A more generic approach is needed. The detailed work elements are established during the formulation of the standards data. Manufacturing operations may be richer and more complicated than the conventional setup and run fields imply. A different data level construct needs to be established to address these deficiencies.
2. Approach
The College of Engineering, at the University of Alabama, was contacted by a major automobile manufacturer. Their Pre-Process Engineering group requested support for the development of a computer-based system to assist company engineers in the selection of work procedures as well as the computation of the associated build-up times. The requested system needed to be capable of discerning between value-adding and non-value-adding time activities, as well as interpreting different code rules for their aligned work procedures. Subsequent meetings with company personnel determined the following system requirements:• The system must be very user-friendly• Input and output to the system should be in a standard Microsoft compatible format•The program has to run on a platform compatible to that of the Internet •The system must allow simultaneous data entering by multiple users•The system needs to be equipped with a help facility that provides online information on the program usage as well as activity codes definitionsFurther, the Pre-Process Engineering group indicated that the system needed to be developed within a 12 to 14 week horizon. Adequate documentation for the use and maintenance of the systems was also to be provided as part of this effort.Previously engineers and workers at the manufacturing facility employed a manual hardcopy method to perform standard process time analysis (Figure 1 – Actual standard times not shown in figure due to a confidentiality agreement with the client company). Each employee carried a printout of multiple tables called the standard process values card, and used it as a quick reference and as a database for analysis. The developed computer-based system’s ultimate goal was to serve as an automated alterative to the use of such a standard process values card.Due to the client’s request for a short timeline, a modified rapid application development (RAD) approach was applied. As noted by Turban and Aronson [13], rapid application development (also referred to as rapid prototyping) consists of performing analysis, design, and implementation concurrently, and in repetitive iterations. The primary benefits of RAD are that the client can observe actual system functionality quickly, and thus provide feedback for subsequent improvement [13]. In practice, however, these rapid prototyping approaches are frequently misunderstood and misused. RAD should not replace conventional structured system analysis (particularly regarding the development of complex interfaces with external systems and databases)., but should be applied to judiciously expedite the development process.The first phase of the research consisted on the design of the system from the user’s perspective. A functional system design (FSD), based on traditional systems design methodology, was constructed from consultation with the company’s engineers and potential users of the system. The design was first conceived with sufficient detail to support the actual programming of the system. In conjunction to the initial development of the FSD, a review of the available developmental software platforms was coordinated with the manufacturer’s management to determine the software to be used for the construction of the system.
3. System Overview
The standard process time values analysis system was developed through a Microsoft Excel/Visual Basic coding combination. Excel’s built-in functionality and user friendly design made it an appealing choice. Visual Basic was implemented to complete difficult logic and coding sequences that go beyond Excel’s capabilities. Using Excel and Visual Basic eliminated the need to purchase any additional developmental computer hardware or software. Security issues were handled by the company’s Information Technology Department. Having the company’s IT Department handle this area ensures system and network compatibility, and a sufficient level of protection controlled by management. The information system uses embedded data provided by the manufacturer to provide task information and execute calculations. Task codes, descriptions, and specifications are all taken from an Excel file consisting of the company’s Standard Process Values. Thus meaning information used in the system appears as it currently does to employees using the standard process values card.
4. Input and Processing Specifications
Input for the system comes from two sources: Standard Process Values tables and the user. The system uses data from the Standard Process Values card (see Figure 1) to provide standardized task codes and descriptions, and calculate time values for analysis.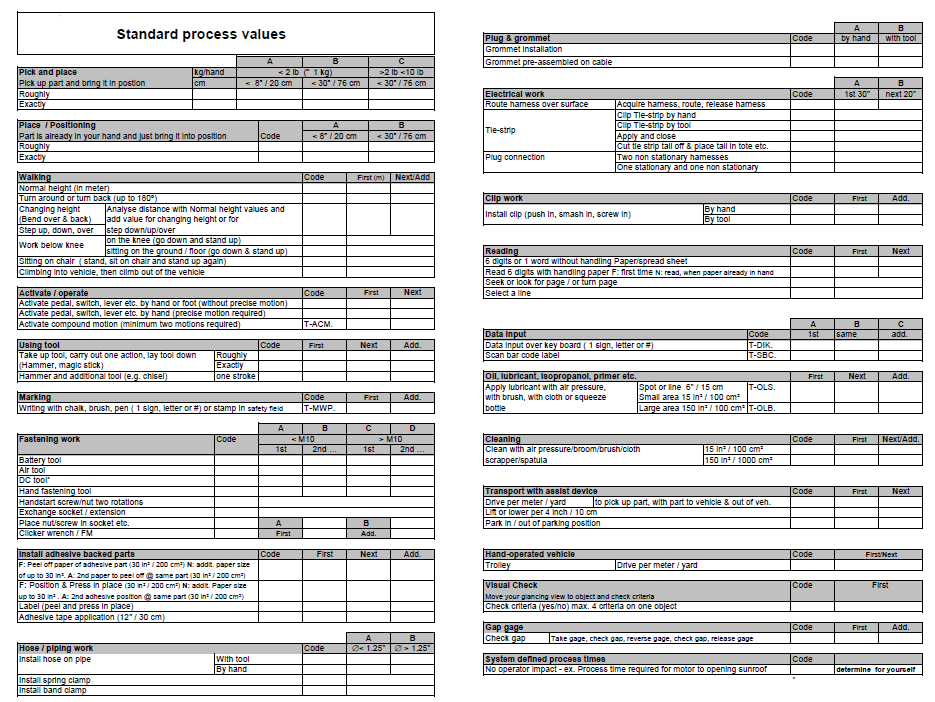 | Figure 1. Standard Process Time Values Card |
The user provides input to the system when selecting which tasks to list; deciding whether an activity is value or non-value added; and customizing task descriptions.The first option of the Main Menu (Figure 2) is “Create New Assembly Time Analysis”. This option must be selected if the user wishes to create a completely new analysis. Selecting this button prompts the “New Analysis” dialogue box to appear. This box has drop down menus for Shop, Line-Area, and Orientation.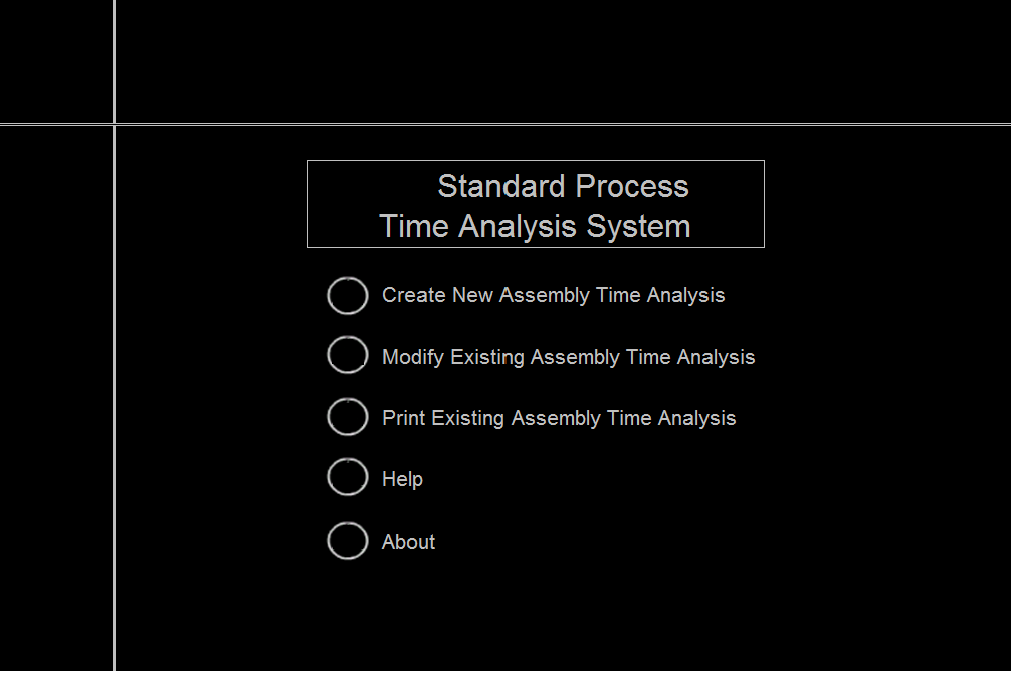 | Figure 2. Main Menu |
Initially, the drop down menu for Line-Area is missing (Figure 3). Once a Shop has been selected, the Line-Area drop down menu appears, containing all Line-Area options for the selected Shop (Figure 4). Station entries must be typed into the dialogue box manually. Orientation has a drop down menu containing all relevant options. Status refers to an analysis’s role as Active or Planning. An Active analysis is used as an account of current shop floor operations. Since only one Active analysis exists for each operation in the facility, there is no version option available. A Planning analysis does not reflect current shop floor operations; rather it is a proposed or experimental analysis. Since many Planning analyses can exist for an actual or fictitious operation, the user is asked to designate a version number to the new Planning analysis. Selecting “OK” at the bottom of the dialogue box sends users to the actual analysis screen.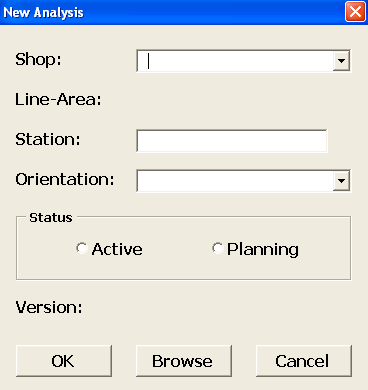 | Figure 3. New Analysis Dialogue Box Lacking Line-Area Drop Down |
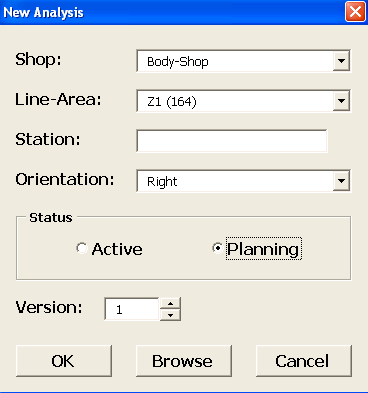 | Figure 4. New Analysis Dialogue Box with All Menu Options Displayed |
The second option on the Main Menu screen is “Modify Existing Assembly Time Analysis”. This option is selected if the user wishes to edit or change a pre-existing analysis. Selecting this option prompts a “Modify Analysis” dialogue box, similar to the “New Analysis” dialogue box, to appear (Figure 5). If the user knows the exact name of the file to be modified, he/she can simply select the appropriate Shop, Line-Area, Station, and Orientation, and whether it is an Active or Planning analysis (Planning analysis would also require knowing the version number). Pressing “OK” opens the appropriate file.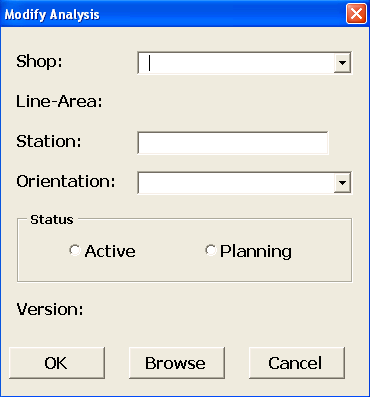 | Figure 5. Modify Existing Analysis Dialogue Box |
The third option on the Main Menu screen is “Print Existing Assembly Time Analysis”. This option should be selected if the user wishes only to print out a pre-existing analysis. Selecting this option prompts a “Print Existing Analysis” dialogue box, similar to the “New Analysis” dialogue box, to appear (Figure 6). The user is asked to enter their name at the top of the dialogue box. The user’s name will appear on the printout for identification purposes. The user must specify the number of copies to be printed. Finally, the user must specify the Shop, Line-Area, Station, Orientation, Status, and Version (if applicable) of the analysis. If the user already knows this information, the dialogue box can then be filled out, and the “OK” button pressed to print the analysis.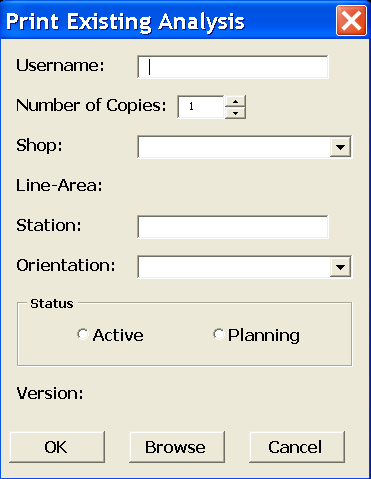 | Figure 6. Print Existing Analysis Dialogue Box |
The fourth option on the Main Menu is “Help”. The user selects this button if further clarification is needed to successfully operate the program. A Help menu appears when this option is selected (Figure 7). Three options are available on the Help menu. The first is “Training Manual”. Selecting this option prompts the Company’s Training Manual containing task descriptions and time analysis information to appear. The second option is “Standard Process Values Card”. Selecting this option prompts the Standard Values Process Card to appear (Figure 1). The third option is “User Manual”. Selecting this option prompts this user manual to appear. The user can then navigate through the various topics depicted in this manual.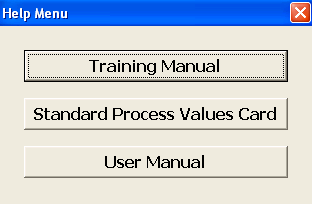 | Figure 7. Help Selection Screen |
Finally, the final option on the Main Menu is “About”. Selecting this option prompts a brief description of the program to appear.
5. Output Specifications
When creating a new analysis, the user is presented with a prompt requesting information about the location of the task, both in the plant and on the vehicle. This information clearly identifies where the operation is being performed. The prompt also asks for the status of the analysis. Active indicates the analysis is reflecting operations currently used in the production line. Planning indicates the analysis is a hypothetical situation the user wishes to investigate. The user is also asked to identify which version of the analysis is being constructed—e.g., the first version, the second version, etc. Figure 8 depicts this location, status, and version prompt.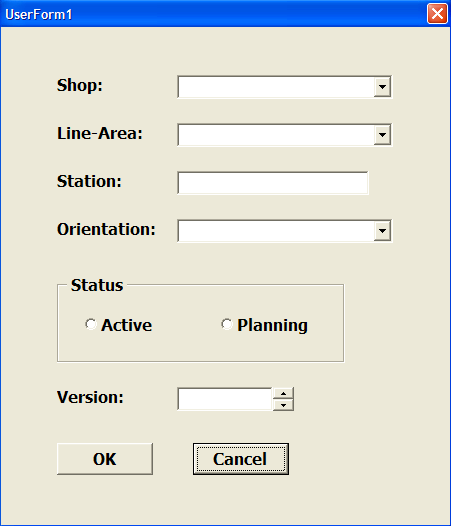 | Figure 8. Location, Status, and Version Prompt |
When the user is working with a new or existing analysis and wishes to add an operation, selecting an “Add Position” button generates a screen that displays all classifications of actions from which the user may choose (see Figure 9).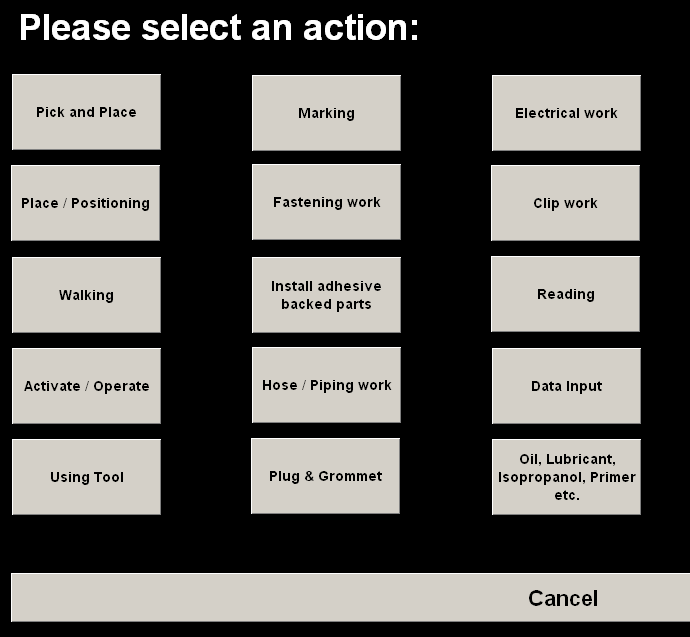 | Figure 9. Excerpt of Action Selection Screen |
Selecting one of the action buttons seen in Figure 9 creates a user prompt box that lists all the possible forms for that particular action. Figure 10 depicts the prompt box seen when the “Pick and Place” button is selected. 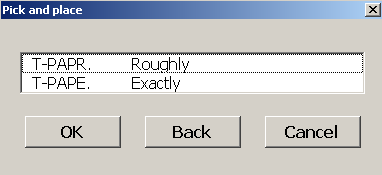 | Figure 10. Example of Operation Selection Prompt |
The operation code and a standardized description of the operation uniquely identify each action. Once the user selects a particular action, another prompt box appears. This box requires the user to select to the duration of the action and specify its frequency. Figure 11 shows the time and frequency prompt box for action T-PAPR.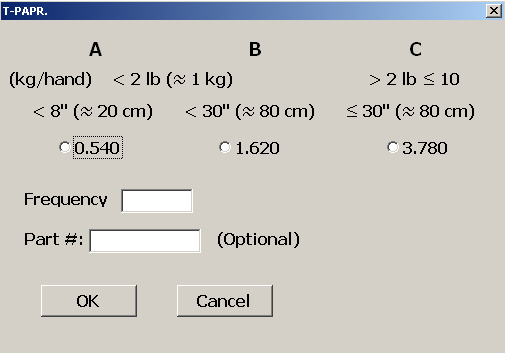 | Figure 11. Example of Time and Frequency Prompt |
6. Verification and Validation
Verification is the process of checking that the system has been developed according to the specifications, and that it is error-free. Verification evaluates the system for its completeness and correctness. “In general, the demonstration of consistency, completeness, and correctness of the software at each stage and between each stage of the development life cycle is involved in the verification” [14]. A set of predetermined verification tests were employed to determine the integrity of the individual system functions. Variations on these structured tests, as described by Kroenke [6], were applied. A series of unit, module, and system tests were successfully completed using contrived data. Expected functionality was normally observed in the results of the test cases. A structured procedure, for problem resolution, was conducted upon the detection of any errors [14].The unit testing phase consisted of evaluating each program separately. Unit testing is a structured approach to locating errors in a program, determining the ways that it may fail, and finally correcting all identified errors in order to create a more robust system. The graphical user interface tests confirmed that the individual programs’ abilities to accept a variety of input values from the user, communicate these values to the application programming interface, and display the final output. The subsequent module-level tests were designed to assure the functionality of combined programs within a given module. These were successfully evaluated to determine if data and control are passed properly between their respective programs. System testing evaluates “the functioning of the information system as a whole. It tries to determine if discrete modules will function together as planned, and whether discrepancies exist between the way the system actually works and the way that it was conceived” [14]. Six system test scenarios verified this combined functionality and integration. Actual data, obtained from the automotive manufacturer, was then applied in a replication and extension of the previous six test scenarios. Validation is the process of ensuring that the system performs the functions identified in the requirement definition, and determines whether the system actually solves the original business problem and the purchasing manager’s needs. Validation also evaluates the system to ensure compliance with design requirements. “Validation is the determination of the correctness of the final program or software produced from a developed project with respect to the user’s needs and requirements. Validation is usually accomplished by evaluating each stage of the software development life cycle” [14]. Face validation by four independent domain experts, as well as a predictive validation, were conducted successfully, consistent with the procedures described by Laudon and Laudon [14]. Face validation is a technique by which a system is evaluated “at face value” by experts in the problem domain. Three domain experts reviewed the software and accompanying documentation. The reviewers were asked to consider the business logic (e.g. if all parameters considered significant were addressed to a level deemed adequate) as well as the programming aspects. Feedback from the validators concluded that the system could provide practical benefits. Predictive validation utilizes case studies from either the literature or real world situations [13]. Case studies, with supporting data, were obtained to the extent possible to map to the prototype’s requirements. Comparison of the system output with the documented case studies further supported this validation.
7. Comments on Final System and Its Shortcomings
As shown by the validation process, the system is successful in meeting its main goal of facilitating the assembly of a new model for the car manufacturer. However, in its present form, it has two major shortcomings. The first one involves its limited scope. Its database includes only predetermine times associated to one and only one vehicle model. Once this particular car model is phase out, on average vehicle models are completely redesigned every five years, the constructed standard process time value analysis systems will be obsolete. The other shortcoming is its inability to conduct probabilistic what-if scenarios. All standard times input given by the client company are deterministic, i.e. fixed values. If these were made stochastic by defining a mean and a standard deviation for each predetermine times, the system could then be provided with a Monte Carlo-based sensitivity engine for more meaningful what-if assessments.
8. Conclusions
The standard process time values analysis system was envisioned to assess work procedures, estimate their associate times, and compute a total build time for a particular production model vehicle currently being assembled at a major car manufacturer located in the Southeast of the United State. The program uses the current manufacturer’s standard process values, which are kept in a database embedded in the software, to perform all needed computations. Input and output reports to and from the system were configured in a standard Microsoft compatible format. The system is networked-based, and it was designed to utilize the client company’s existing hardware, software, and communications assets to the fullest extent possible. Before implementing the program at the facility, the information system underwent a comprehensive series of tests. The tests checked for system accuracy and efficiency. Carefully designed scenarios were entered into the system and the output confirmed for correctness. Once the system successfully completed the testing phase, it was implemented onto the company’s computer network. Field tests on-site at the plant again checked the system for accuracy and efficiency.The first trial (i.e. beta version) of the system was delivered in eight weeks, with the final version implemented within the 14 week horizon originally requested. The system is currently in use at the automobile manufacturing facility. Follow-on work has been discussed, with the addition of graphical visualization capabilities of the process flow (e.g. walking paths, with distances, between production operation steps) suggested as a system enhancement.
References
| [1] | Freivalds, A., and Niebel, B. W. (2013) Niebel's Methods, Standards, & Work Design. (13th Edition), McGraw-Hill Science/Engineering/Math. |
| [2] | Gilleard, John D. (1992) 'The Creation and Use of Labor Productivity Standards among Specialist Subcontractors in the Construction Industry.' Cost Engineering Vol. 34, No. 4, pp. 11-16. |
| [3] | Ostwald, Phillip F. (2001) 'Product Cost Analysis and Estimating.' In Handbook of Industrial Engineering: Technology and Operation Management, ed. Gavriel Salvendy, pp. 2295-2316. New York: John Wiley and Sons, Inc. |
| [4] | Castillo-Matias, Aura. (2001) 'Work Measurement: Principles and Techniques.' In Handbook of Industrial Engineering: Technology and Operation Management, ed. Gavriel Salvendy, pp. 1409-1462. New York: John Wiley and Sons, Inc. |
| [5] | United States Department Of Defense (1983) 'Military Standard 1567A.' Washington, D.C.: U.S. Government Printing Office. |
| [6] | Kroenke, D.M. (2013). Using MIS (6th Edition). Prentice Hall. |
| [7] | Dos Santos, Jose Ricardo (1995) 'Re-tayloring the Shop Floor: a New Approach to Methods and Time Standards.' Industrial Engineering Solutions Vol. 27, No. 5, pp. 42-44. |
| [8] | He, Yumin, Milton L. Smith, and Richard A. Dudek (1994) 'Effects of Inaccuracy of Processing Time Estimation on Effectiveness of Dispatching Rules.' Proceedings of the Third Industrial Engineering Research Conference, Atlanta Georgia, May 18-19, pp. 308-313. |
| [9] | Zargar, Ali M. (1995) 'Effect of Rework Strategies on Cycle Time.' Computers and Engineering Vol. 29, No. 1-4, pp. 239-243. |
| [10] | Bauer, A., R. Bowden, J. Browne, J. Duggan And G. Lyons (1991) Shop Floor Control Systems: From Design to Implementation. London: Chapman and Hall. |
| [11] | Kang, Kyung-Sik, Tae-Ho Kim, and Il-King Rhee (1994) 'The Establishment of Standard Time in Die Manufacturing Process Using Standard Data.' Computers and Industrial Engineering Vol. 27, No. 1-4, pp. 539-542. |
| [12] | Dillenberger, Christof, Laureano F. Escudero, Artur Wollensak, and Wu Zhang, (1994) 'On Practical Resource Allocation for Production Planning and Scheduling with Period Overlapping Setups.' European Journal of Operational Research Vol. 75, No. 2, pp. 276-286. |
| [13] | Turban, E. and Aronson, J.E. (2005). Decision Support Systems and Intelligent Systems (6th ed.) Pearson/Prentice Hall. |
| [14] | Laudon, K. C, and Laudon, J.P (2012). Essentials of Management Information Systems (10th Edition). Prentice Hall. |
 Abstract
 Reference
 Full-Text PDF
 Full-text HTML