Qian Yubin1, Tao Xiaoming1, Wang Yan2, Xiao Lingyun2
1College of Automobile Engineering, College of Management, Shanghai University of Engineering Science, Shanghai, 201620, China
2Defective Product Administrative Center, AQSIQ, Beijing, 100088, China
Correspondence to: Qian Yubin, College of Automobile Engineering, College of Management, Shanghai University of Engineering Science, Shanghai, 201620, China.
| Email: |  |
Copyright © 2014 Scientific & Academic Publishing. All Rights Reserved.
Abstract
Based on the domestic vehicle recall data for ten years, the features such as recall data, defect reason, defect type, defect risk, risk cause and service life are analyzed. The five defect types which are design, manufacture, assembly, calibration and identification and three defect risks which are occupant injury, vehicle crash and firing are put forward to. The data show that the main three defect causes are design and manufacture and assembly. The most important defect types are structurally deficient, inadequate accuracy and fastening for above-mentioned three corresponding causes. The recall rate owning to the vehicle crash risk is more than the two other risks. The highest risk of occupant injury cause for recall times is airbag failure, and thus for recall numbers is door and window failure. The highest vehicle crash and firing corresponding risk causes are power losing and fuel leaking. The optimum time is within three years for service life and the range of producing years. The rate of recall times is similar linear decrease within three years.
Keywords:
Domestic vehicle recall, Vehicle defect, Defect cause, Risk of accident
Cite this paper: Qian Yubin, Tao Xiaoming, Wang Yan, Xiao Lingyun, A Study on Vehicle Defect Characteristics Based on Domestic Recall Data, Management, Vol. 4 No. 2, 2014, pp. 50-57. doi: 10.5923/j.mm.20140402.03.
1. Introduction
General Administration of Quality Supervision, Inspection and Quarantine (AQSIQ), Development and Reform Commission, Ministry of Commerce and General Administration of Customs jointly issued the Defective Vehicle Product Recall Regulation on March 15, 2004. The regulation was officially implemented on October 1. Defective Vehicle Product Recall Ordinance has been passed at 219th executive meeting of the State Council of China on October 10, 2012. The ordinance took effect on January 1, 2013.According to the new ordinance, the defect, which is caused by design, manufacture, identification and other causes that widespread in the same batch, type or category of vehicle products, refers to the situation that vehicle products do not meet national and industry standards to protect the personal and property safety or other unreasonable risks that endanger the personal and property safety. Recall means a series of activities that vehicle producers take measures to eliminate defects for its vehicle products that have been sold.As to defect vehicle products, producers should recall them in accordance with the ordinance. When producers don’t implement recall, product quality supervision department of the State Council should command them to recall in accordance with the ordinance. Business operators who provide sales, leasing and maintenance of vehicle products shall immediately stop saling, leasing and using of defective vehicle products and assist producers to recall them as soon as they are informed of existence of the defect.
2. Literature Review
Liu Xin (2014) makes comparison of vehicle recall system in China and developed countries from vehicle recall system legal basis, legislative level, recall mode, penalty and points out some existing problems of our current vehicle recall system and at last explores its improvement measures. Wang Dong (2014) finds main reason of defects and eliminating measures by analyzing recall vehicle type and feature analysis. Xie Qingying(2013) analyzes defect vehicle recall system from legislative level, legal consequence and supervision system perspectives by analyzing current regulations and learning from defect product recall of the United States. Zhang Weiliang, Xiao Lingyun, Liu Yahui (2013) analyzes the form of steering system fault defect and its impact. Then he puts forward a risk assessment guideline of vehicle steering system defect. Han Weibin, Chen Junyi (2012) researches recall vehicle, number of parts, recall number of different years, recall vehicle number of different countries. Cheng Ziwei (2012) analyzes internal and external factors to stimulate the quickly establishment of vehicle recall system. Shen Ming, Wang Yunsong, Liu Hongxi (2008) analyzes ten recall data of Europe and the United States. Their research result may provide useful technical support to defect prevention of vehicle products and risk management. Huang Guozhong, Wang Yan, Wang Dan (2007) summarizes a suitable vehicle defect risk assessment index system. Zheng Guohui (2005) analyzes causes of product quality defect and ways to improve social welfare based on microeconomics theory.
3. An Overview of Domestic Vehicle Recall Bulletin
Cumulative recall times reach to 482 and cumulative recall numbers reach to 9.934 million from June 18, 2004 to April 11, 2013. The distribution of recall times and recall numbers of ten years is shown in Figure 1.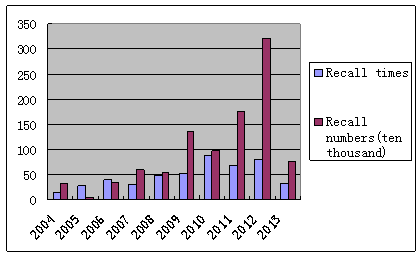 | Figure 1. Distribution of recall times and recall numbers |
From initial 13 recall cases, nearly 328,000 vehicles in 2004 to 80 recall cases, nearly 3,211,000 vehicles in 2012, recall times and recall numbers of 10 years show increasing trend. The impact of China's vehicle recall has increased annually. Recall vehicle numbers reach to the highest proportion before the new ordinance taking effective. Compared with 14,000 recall cases and nearly 660 million recall vehicles of 42 years according to recall system in the United States, we should further improve.We count passenger bus that has less than 7 seats as saloon car and construction vehicle, tractor as truck. The distribution of recalled vehicle models is shown in Table 1. The subject of recalled vehicles is saloon car because of the big car market volume in the same batch. While passenger bus defects will lead to destructive security risks, both producers and authorities should focus on passenger bus defect recall.Table 1. Distribution of recall times and recall numbers of different vehicle model
 |
| |
|
NHTSA recall vehicles include saloon car, truck, bus, recreational vehicle, motorcycle and moped. Based on accident statistics and risk assessment, two types of components such as child seats and tires are classified separately. Recalled vehicle types are mainly concentrated on truck and passenger bus in China. There is no defect recall case of child safety seat. Tire defects are caused by excessive use of fantuijiao, which will lead to tire bulge, leaking and other risks and affect traffic safety. There are 2 types of cars (nearly 12,000 cars) that are recalled due to tire defect on April 15, 2011.
4. An Distribution of Common Defect Assembly
Specific contents and forms of vehicle defect recall are different, but the assembly conform distribution pattern. 400 million vehicles and 200 million defective parts of American recall, we classify 24 different assemblies. According to fault tree analysis principle and vehicle construction vehicle structure assembly classification, recall involves six parts. They are body, electronic appliance, transmission, engine, brake & wheel and steering & suspension. The specific distribution is shown in Table 2.Table 2. Distribution of vehicle recall times and recall numbers caused by assembly
 |
| |
|
Higher recall frequency is, higher risk severity is, which means the site prone to security failures. Thus arouses great attention of manufacturers and governments.As is showed in Table 2, the highest proportion of engine recall times is 28%, followed by 21% of body. The highest proportion of recall vehicle numbers of the body is as high as 30%, followed by 26% of the engine.Decomposition of the subsystem may get distribution of defective parts. Six sub-systems distribution charts that constitute body defect are showed in Figure 2. They are seat belt, airbag, seat, window, door and other body.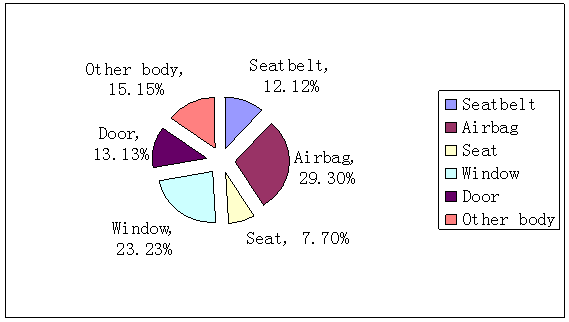 | Figure 2. Distribution of recall times caused by body defect |
Distribution of airbag defect is showed in Figure 3, which is made by different location of airbag. The highest proportion of recall times is front driver airbag defect DAB, followed by passenger airbag PAB.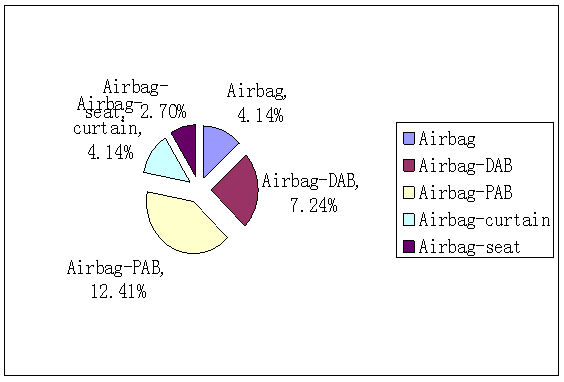 | Figure 3. Distribution of recall times caused by different airbag defect |
We can get gas generator, pouch, pouch suture, inlay belt, airbag cover and harness connector by further decomposition of airbag defect.Currently producers discover defect and recall most of vehicles, while competent authorities (AQSIQ) investigate and recall part of vehicles. Through National Automobile Accident In-depth investigation system (NAIS) survey, we find that in actual accident cases, airbags have such defects as DAB overall flying flip or logos flying. Thus, by accidents depth survey finding defect may have an effective complement to producer’s voluntary recall and AQSIQ’s recall.
5. Analysis to Common Causes of Defects
5.1. Classification of Defect Causes
According to the definition of ordinance, design, manufacture and identification reasons are the main causes of defects in the recall. Some reasons causing defect may have both design reasons and manufacture reasons, we classify by main reasons. Calibration defects belong to design defect according to the ordinance and its main feature is "updating software to eliminate safety hazards" as maintenance measures. Manufacture defects can be subdivided into manufacture defects and assembly defects according to the ordinance.Combined with defect description of recall bulletin, defect causes can be divided to design, calibration, manufacture, assembly and identification defects. Distribution characteristics are shown in Table 3.Table 3. Distribution of recall times and recall numbers caused by deficiency causes
 |
| |
|
The proportion of recall times caused by design causes is 39%, while the proportion of recall vehicle numbers reaches to 63%. The proportion of recall times caused by manufacture and assembly defects is 33%, 22% respectively and the proportion of recall vehicle numbers is 20%, 12% respectively. The highest defect cause of maximum recall numbers is design defect.Data show that effective means to control defects is to improve the level of product design and strengthen the quality control aspects of production process, including reliability testing, verifying design, manufacture processes etc. Improving product design level, strengthening quality management of OEMs and supporting business and defect retroactive, establishing liability recovery system contributes to help vehicle manufacturers to control operational risks and reduce losses caused by recall.
5.2. Characteristics of Design Defect
There are arrangement defect, interference, structural defect, insufficient strength, lack of life, margin defects of design defect type. Distribution of recall times and recall vehicle numbers is shown in Table 4.Table 4. Distribution of recall times and recall numbers caused by design defect
 |
| |
|
Three ranking defects of recall times and recall vehicle numbers are structural defects, interference and insufficient strength. The proportion of recall times is 49%, 30% and 11% respectively and the proportion of recall vehicle numbers is 67%, 14% and 13% respectively. Thus, structural defects are the most important manifestations of design defects, far more than other types of design defects.
5.3. Characteristics of Manufacture Defects
There are material defect, molding defect, process defect, welding defect, inadequate accuracy, lack of strength and quality defect of manufacture defects. Recall times and recall vehicle numbers are shown in Table 5.Table 5. Distribution of recall times and recall numbers caused by manufacture defect
 |
| |
|
The proportion of recall times caused by material defect, molding defect, process defect and welding defect is close to 20%, while the proportion of recall vehicle numbers caused by inadequate accuracy is as high as 41%, followed by the proportion of recall times caused by process defect, whose proportion is 20%.
5.4. Characteristics of Assembly Defect
There are fastening, over tightened, missing equipment, bad seal, mistakenly loaded, insufficient adhesion and assembly stress of assembly defect. Distribution of recall times and recall vehicle numbers is shown in Table 6.Table 6. Distribution of recall times and recall numbers caused by assembly defect
 |
| |
|
The proportion of recall times caused by fastening and mistakenly loaded is 37% and 33% respectively, while the proportion of recall times caused by the remaining assembly defect is 3% and 9% respectively. The proportion of recall vehicle numbers is as high as 74%, which is the main type of assembly defect.
6. Type Analysis of Defect Consequences
There are four potential risks which are caused by various types of defects. They are occupant injury, vehicle crash, firing and other risks. The distribution is shown in Table 7. Improving vehicle crash risk shows the highest proportion of recall times and recall vehicle numbers. They are 64% and 74% respectively, which is much higher than occupant injury and firing risks.Table 7. Distribution of recall times and recall numbers caused by different risks
 |
| |
|
There are five main reasons that lead to occupant injury risk. They are seatbelt failure, door and window failure, airbag failure, seat failure and other reason. The distribution is shown in Table 8. The proportion of recall times caused by airbag failure is 51%, which is much higher than seatbelt failure, door and window failure and seat failure. The highest proportion of recall vehicle number is caused by door and window failure. It is 62%, followed by 25%, which is caused by airbag failure. Table 8. Distribution of recall times and recall numbers caused by occupant injuries
 |
| |
|
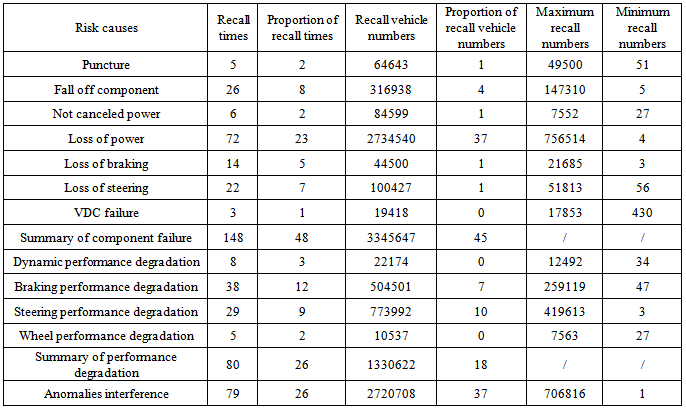
There are three level indicators reasons that lead to vehicle crash risk. They are component failure, performance degradation and anomalies interference, whose distribution is shown in Table 9. The proportion of recall times is 48%, 26% and 26% respectively and the proportion of recall vehicle numbers is 45%, 18% and 37% respectively.Table 9. Distribution of recall times and recall numbers caused by vehicle crash
 |
| |
|
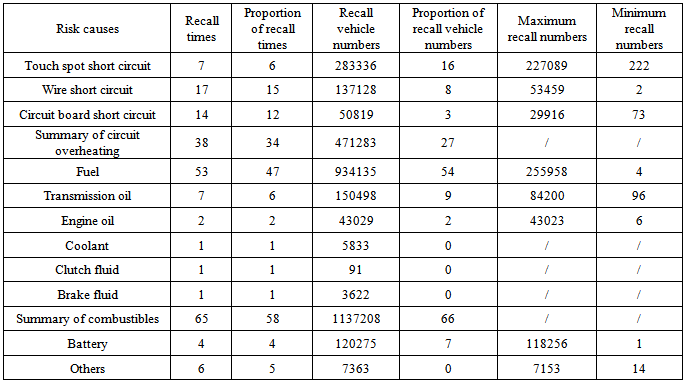
Component failure is divided into puncture, fall off component, not canceled power, loss of power, loss of braking, loss of steering and VDC failure. Performance degradation is divided into dynamic performance degradation, braking performance degradation, steering performance degradation and wheel performance degradation. The proportion of recall times and recall vehicle numbers caused by loss of power is 23% and 37%, which is much higher than other reasons caused by component failure.There are four level indicators reasons that lead to firing risk. They are overheating circuit, fuel leaking, batteries and other reasons. The distribution is shown in Table 10. The proportion of recall times and recall vehicle numbers caused by overheating circuit and fuel leaking is 34% and 58% respectively. The proportion of recall vehicle numbers is 27% and 66% respectively.Table 10. Distribution of recall times and recall numbers caused by firing risk
 |
| |
|
Overheating circuit is divided into touch spot short circuit, wire short circuit and circuit board short circuit. The proportion of recall times caused by wire short circuit and circuit board short circuit is 17% and 14% respectively. The proportion of recall vehicle numbers caused by touch spot short circuit is 16%, which is much higher than the proportion caused by wire short circuit and circuit board short circuit. Fuel leaking causes are divided into fuel, transmission oil, engine oil, coolant, clutch fluid and brake fluid. The proportion of recall times and recall vehicle numbers is 47% and 54% respectively, which is much higher than the proportion caused by other combustible liquid leakage.
7. Type Analysis of Defect Consequences
The distribution of recall vehicles of service life and production time span is shown in Table 11. The proportion of recall times within one year’s service life is 33% and the proportion of 1-2 years is 20% and the proportion of 2-3 years is 11%. Therefore, the recall times within 3 years are similar linear decrease and recall times of 3 years are 67%. To sum up, vehicles within 3 year’s service life are recall body.Table 11. Statistics of usage and production span years
 |
| |
|
Similarly, according to the range of producing years, the proportion of recall times within 1 year is as high as 48% and recall times within 3 years are similar linear decrease. Because recall times of 3 years are 84%, vehicles within 3 year’s production span are recall body.
8. Conclusions
Vehicle recall statistics data of Chinese vehicle recall network are direct material to analyze vehicle safety defect. We summarize the distribution of vehicle defect, causes, types, risk of consequence, reasons of risk, service life from a large number of cases. The characteristics are as followings:(1) The highest recall frequency is engine assembly, followed by body part of vehicle assembly. The highest recall frequency of vehicle body part is airbags and door and window.(2) There are three causes that lead to vehicle defects. They are design defects, manufacture defects and assembly defects. Structural defect is the main type of design defect and the proportion of recall times and recall vehicle numbers is 49% and 67% respectively, followed by interference. The proportion of recall times of manufacture defect which is caused by inadequate accuracy, material defect, weld defect and process defect is approximately 20%. The proportion of recall vehicle numbers of manufacture defect caused by inadequate accuracy and process defect is 41% and 20% respectively. Fastening is the main type of assembly defect and the proportion of recall times and recall vehicle numbers is as high as 37% and 74% respectively.(3) Vehicle crash risk is mainly caused by different type of defects and the proportion of recall times and recall vehicle numbers is as high as 64% and 74% respectively. Loss of power is the main cause of vehicle crash risk. Airbag failure and door and window failure is the main cause that lead to occupant injury risk. Loss of power and fuel leaking is the main cause of vehicle crash risk and firing risk.(4) 1-3 years of service life and production time span are the main defect recall times. The proportion of recall times is similar linear decrease.It is good for vehicle companies to do defect prevention and risk management, good for government to provide technique and data support by carrying out vehicle defect investigations and vehicle recall management, good for the public and vehicle insurance relevant units and individuals to recognize vehicle defects and provide car defect risk control and improve vehicle product safety from characteristics of vehicle defects, which is got from vehicle recall data analysis. Eventually it is good to eliminate or reduce incidence of traffic accidents.
ACKNOWLEDGEMENTS
This research is supported by NATIONAL AUTOMOBILE ACCIDENT IN-DEPTH INVESTIGATION SYSTEM (NAIS) and Opening Fund of Chang’an University under Grant number CHD2011SY011 and Science Foundation of Shanghai University of Engineering Science under Grant number A-0903-13-01052.
References
| [1] | Liu Xin. A comparative study on automobile recall system[J]. Law Expo, 2014,02:63-64. |
| [2] | Wang Dong. Defect analysis of domestic vehicle recall[J]. Automotive and Parts, 2014,07:52-55. |
| [3] | Xie Qingying. Legal framework discussion of defective automobile recall system[J]. Modern business,2013,07:92-93. |
| [4] | Zhang Weiliang, Xiao Lingyun, Liu Yahui. Risk assessment criteria of automotive steering system defect and automotive recall case[J]. Automotive Safety and Energy Journal, 2013, 04:361-366. |
| [5] | Han Weibin, Chen Junyi. Status analysis of domestic vehicle recall [J]. Jiamusi University Journal(Natural Science), 2012, 01:77-78. |
| [6] | Cheng Ziwei. Research on motivation of automobile recall system establishment[J]. Chizhou College Journal, 2012,01: 56-59. |
| [7] | Shen Ming, Wang Yunsong, Liu Hongxi. Research on characteristics of vehicle defect based on European and American recall data. Automotive Engineering, 2008, 30 (11),1023-1027. |
| [8] | Huang Guozhong,Wang Yan, Wang Dan. Research on automobile defect risk evaluation index system[J]. World standard information, 2007,12:44-48. |
| [9] | Zheng Guohui. Economic analysis on vehicle defective product implementing recall system [J]. Journal of Chinese Construction Machinery,2005,02:233-236 |
| [10] | General Administration of Quality Supervision, Inspection and Quarantine(AQSIQ). Defective vehicle product recall regulations [M]. Beijing: China Metrology Publishing House, 2004:98. |
| [11] | China Vehicle Recall Net domestic vehicle recall bulletin: http://www.qiche365.org.cn/index/recall/recall.jsp. |
| [12] | Qian Yubin, Chen Lihua, Liu Haoxue. Features of 200 Chinese road accidents that kill more than 10 people and prevention recommendations [J]. Journal of Preventive Medicine. 2008, 42 (6); 384-387. |
| [13] | Wang Yan, Wang Yunsong. Vehicle recall status and defect mode research. Automotive Engineering, 2008, 30 (11); 1018-1022. |


 Abstract
 Reference
 Full-Text PDF
 Full-text HTML


