-
Paper Information
- Previous Paper
- Paper Submission
-
Journal Information
- About This Journal
- Editorial Board
- Current Issue
- Archive
- Author Guidelines
- Contact Us
Management
p-ISSN: 2162-9374 e-ISSN: 2162-8416
2013; 3(3): 174-183
doi:10.5923/j.mm.20130303.06
Innovative Capacity of Italian Manufacturing Firms
Alberto Ferraris
Department of Management, University of Turin, 10134, Italy
Correspondence to: Alberto Ferraris, Department of Management, University of Turin, 10134, Italy.
| Email: |  |
Copyright © 2012 Scientific & Academic Publishing. All Rights Reserved.
In the current scenario of high technological competitiveness and environmental complexity, the innovation capacity of manufacturing firms is one of the principal key driver for competing on the global markets. The context is increasingly dominated by strong and growing competition between companies from all over the world so, manufacturing firms are forced to move the focus of competitive advantage on innovation. This paper focuses on innovative capacity of Italian manufacturing firms over the period 2007-2009 from three different points of view. First, the investments in technological equipment, plant, machinery and ICT; second, the R&D expenditures; third, the way that firms finance their innovation activity and investments. Analyzing a sample of 524 European manufacturing firms from these three different points of view, several findings emerge from the comparison of firms in different countries. Most Italian companies have a good basic ICT supply, but they invest relatively less than the average in new infrastructure, machinery and equipment. Investments in innovation and R&D are stronger, although funding strategies are unbalanced towards traditional debt instruments and they are more undifferentiated considering the final objectives of the investment. The research concludes with interesting managerial implications which provide a conceptual interpretation of the phenomena and prescribe actions to policy makers.
Keywords: Manufacturing Firms, Innovative Capacity, Sources Of Financing
Cite this paper: Alberto Ferraris, Innovative Capacity of Italian Manufacturing Firms, Management, Vol. 3 No. 3, 2013, pp. 174-183. doi: 10.5923/j.mm.20130303.06.
Article Outline
1. Introduction
- The global economic situation seems to have different speeds. The IMF (International Monetary Fund) describes the current situation as a two-speed recovery phase, with a part of the world running and the other one gradually starting to walk again. The developed countries GDP grew by 2.5% in 2010 and 2.7% in 2011 while the GDP of emerging countries grew at a faster rate of 6.5% in 2010 and 7.1% in 2011. In the current recovery and growth framework there are mainly two obvious risks: on the one hand, those related to the fears about fiscal balance of some countries; on the other hand, those related to the dynamics of commodity prices, which seem to evolve faster in developing countries than in the developed ones because of the higher growth rate of GDP. In this context, the Italian economy seems to recover more slowly than the European countries. The GDP, in fact, increased by 1.3% in real terms in 2011 (after a decline by 5.2% in 2009), with a private consumption increase of just 0.6%. The difficulties in the labor market, which still did not convincingly turnaround after the crisis, cause a weak consumer demand. So, with reference to the situation of enterprises, the starting point is given by the dynamics of manufacturing; after the sharp decline in 2009 and the gradual recovery observed in most of 2010, the dynamics of manufacturing seems to have lost impulse in the latest period (2011). It is possible to better understand the dynamics of manufacturing firms after the crisis, investigating two different aspects: the production index and the confidence indicator[1].The international comparison with the other EU countries (especially compared to Germany) does not provide comforting indication; it is clear the different “rhythm” of Italy. In fact, it is evident not only in the historical period before the crisis, but also in the expansion phase that followed. If Germany, for example, registered an increase by 23.9% in the production index from the lowest point of March 2009 to January 2011, Italy shows in the same period a growth by just 9.8%.Another relevant way to examine the economic current framework is to take the confidence indicator into consideration. EU Commission data[2] suggest that all the EU countries touched the lowest point during the crisis in April, 2009. Considering the pre-crisis levels, German companies are more confident today than during the peak of the previous economic cycle (end of 2006 - first half of 2007); French companies have more or less the same confidence, while Italy and even more Spain are still far apart. The distance in March 2011 between the lowest level (Spain according to the data in this case) and the highest one (Germany) is 25 percentages points, the biggest difference since 1991. In Italy, the manufacturing output, the confidence indicator and the profit trend, show a less brilliant dynamic compared to the other countries. The recovery from the shock of 2009 seems slower. It looks like the Italian manufacturing firms lack a “sprint”; the innovative activities are probably the key factor to affect a faster recovery.Then, in this particular scenario, the innovative capacity of manufacturing firms became very important[3]. Innovative capacity relates to the firm’s capacity to engage in innovation, for example having the right tools and/or basic conditions for being innovators and successfully compete in the current scenario. The best performing manufacturing firms are increasing their investments in technology modernization to face the challenges coming from the crisis[4]; as a consequence they are introducing new product and process technologies[5]. This paper focuses on innovative capacity of Italian manufacturing firms from three different points of view. First, the amount of investments in technological equipment, in plant, machinery and ICT; second, the R&D expenditures, third, the way that firms finance their innovation activity and investments. So, this paper has the purpose to investigate these different aspects and to compare them with other European Regions in order to obtain some policy implications. The paper is organized as following: Section 2 will examine the literature, then, the paper will describe the research methodology (Section 3). Section 4 (Findings) will show a qualitative analysis of the main topic under investigation, showing different aspects of innovation activity of Italian manufacturing firms. Finally, Section 5 offers a conclusion.
2. Literature Review
- The literature on this theme is very wide and show many aspects related to competition, strategy, innovation, control, governance and management. Manufacturing was considered as the main source of technological innovation and hence as the key driver for productivity growth, and not surprisingly innovation theory has been basically derived from the analysis of technological innovation in manufacturing[6]. However, since the 1980s a large number of scholars have studied innovation in services ([7-11]).According to the aim of this paper, the analysis of the literature will focus on two different aspects: a) the characteristics of innovation in manufacturing sectors; and b) the way that firms finance this kind of activities. Concerning the first aspect, many studies investigated the innovative capacity of manufacturing firms through econometric models ([4],[12],[13]) at a single national / regional level ([14-16]), while others are focused on different kind of relationship between innovative capacity and other determinants such as R&D cooperation ([17-19]) family control ([20],[21]) and exportation ([22],[23]).Concerning the second aspect, several scholar have deeply analyzed the financing point of view ([24-29]). So, this study tries to fit the existent lack of studies through a qualitative analysis of this two aspects comparing different countries/regions.
2.1. The Characteristics of Innovation In Manufacturing Sectors
- Wakelin[30] analyzed the relationship between productivity growth and R&D expenditure for 170 UK firms finding a positive and significant correlation.Reichstein and Salter[31] using a large scale survey of UK manufacturing firms found that firm size, the presence of formal research and development, and the use of suppliers as a source of knowledge all increase the chances that a firm will be a process innovator. Chudnovsky et al.[4] using panel data from innovation surveys in Argentina with information for 1992–2001 showed that in-house R&D and technology acquisition expenditures have positive payoffs in terms of enhanced probability of introducing new products and/or processes to the market. In turn, innovators attain higher productivity levels than non-innovators. The results also showed that large firms have a higher probability of engaging in innovation activities and of becoming innovators.Triguero and Córcoles[16] analyzed the persistence of innovation in a panel of Spanish manufacturing firms for the period 1990–2008. They found that R&D (input) and innovation (output) are highly persistent at the firm level. Also, regarding firm specific characteristics, they found that size and outsourcing have a positive impact on both processes and past innovative behavior was clearly more decisive in explaining the current state of R&D and innovation activities than external factors or firm-level heterogeneity.Hall et al.[12] using data on a large unbalanced panel data sample of Italian manufacturing firms found that R&D and ICT are both strongly associated with innovation and productivity, with R&D being more important for innovation, and ICT investment being more important for productivity. Examining the contribution of IT to innovation production across multiple contexts and analyzing annual information from 1987 to 1997 for a panel of large U.S. manufacturing firms Kleis et al.[13] found that a 10% increase in IT input is associated with a 1.7% increase in innovation output for a given level of innovation-related spending. This relationship between IT, research and development (R&D), and innovation production was robust across multiple econometric methodologies and is found to be particularly strong in the mid to late 1990s, a period of rapid technological innovation. This results has also demonstrated the importance of IT in creating value at an intermediate stage of production through improved innovation productivity. However, R&D and its related intangible factors (skill, knowledge, etc.) appear to play a more crucial role in the creation of breakthrough innovations. Instead, Becker[18] investigated the role of R&D cooperation in the innovation process—in context with other factors— and stated that the intensity of in-house R&D stimulates the probability and the number of joint R&D activities with other firms and institutions significantly. The importance of R&D cooperation has risen steadily as a consequence of the growing complexity, risks and costs of innovation[17]. Firms engaged in the innovation process are aware of the necessity of establishing R&D cooperation to obtain expertise which cannot be generated in-house. Collaboration with other firms and institutions in R&D is a crucial way to make external resources usable. Concerning the relationship with family control, Lichtenthaler and Muethel[21] using data from a sample of 119 German manufacturing firms showed that family involvement is positively related to dynamic innovation capabilities. Specifically, the degree of family involvement, which describes the owner family’s ability to influence firm behavior, is positively related to sensing innovation opportunities and to transforming a firm’s innovation processes, while it is insignificantly related to seizing innovation opportunities. The findings suggest that dynamic innovation capabilities are an important characteristic that differs between firms with varying levels of family involvement. Also, particular characteristics, such as a long-term orientation, illustrate that the activities of firms with family involvement differ from those of other firms[20]. With referred to export attitude, Nassimbeni[22] proposed a predictive model on the basis of an empirical investigation carried out on a sample of small units, exporters and non-exporters. They are compared in terms of technology and ability to innovate, besides a number of other structural factors. This study showed that the propensity of small units to export is strictly linked to their ability to innovate the product and develop valid inter-organizational relations.Regarding this topic Basile[23] analyzing the relationship between innovation and export behavior of Italian manufacturing firms in different exchange rate regimes stated that innovation capabilities are very important competitive factors and help explain heterogeneity in export behavior among Italian firms. However, the exchange rate evaluation reduces the importance of technological competitiveness in affecting exports because it allows also non-innovating firms to enter foreign markets. Moreover, he found that once new firms have entered the market, they continue to be exporters also when the exchange rate returns to its previous level (hysteresis) and concluded that the export intensity of innovating firms is systematically higher than that of non-innovating firms.
2.2. Sources of Financing
- Freel[24] investigated the funding environment facing product innovating small manufacturing firms and both supports and contradicts a number of “stylized facts” which have emerged over the last decade. Amongst the key findings it appears that, whilst innovators were no more nor less likely to have sought external funds, they were significantly less likely to have successfully accessed bank finance. This finding is of particular gravity since bank debt remains the primary source of external finance employed. Further, the author noted that the low use of genuine risk capital to fund product innovation and raised the question as to what extent this reflects supply or demand side deficiencies. The role of public subsidies, in the form of grant funding, is also investigated with some tentative evidence pointing to the role grants play in validating technology or as leverage to access further funds. Dahlstrand and Cetindamar[25] analyzed the dynamics of innovation financing by using the case of Sweden and showed the importance of government and venture capital in financing innovation. Hall and Lerner[26] found that, while small and new innovative firms experience high costs of capital that are only partly mitigated by the presence of venture capital, the evidence for high costs of R&D capital for large firms is mixed. Nevertheless, large established firms do appear to prefer internal funds for financing such investments and they manage their cash flow to ensure this. Evidence showed that there are limits to venture capital as a solution to the funding gap, especially in countries where public equity markets for venture capital exit are not highly developed. Magri[27] investigated small manufacturing firms in collecting external finance and highlighted special features in financial structures of small innovative firms, compared with firms of similar size that do not innovate. The evidence showed that small innovators rely less on financial debts and more on internal financial resources; no important differences appear for large firms. Another finding was that small innovative firms showed a lower investment sensitivity to cash flow than small non-innovative firms: it was more likely that the high incidence of internal financial resources allows them more flexibility in deciding their investments. No difference in investment sensitivity to cash flow, by innovative attitude, was found for large firms.Finally, Carboni[28] using a comprehensive firm level data set for the manufacturing sector in Italy, examined whether public funding affects the financial sources available for R&D and found that grants encourage the use of internal sources. The results also show some evidence of positive effects on credit financing for R&D.
3. Methodology
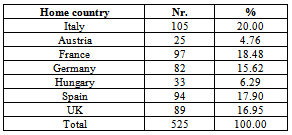
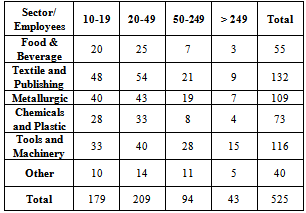
- It has been used data collected by GFK Eurisko systems through CATI (Computer Assisted Telephone Interview) and CAWI (Computer Assisted Web Interview) interviews to executive managers during the period 2007-2009. The sample consist of 525 manufacturing companies and their different home countries are indicated in Table 1.To better understand the characteristics of enterprises the sample is been divided by sector and company size, taking the main geographical areas of each country into account, Table 2 shows a descriptive statistics of the sample.It has been used a large firm-level data set which enabled to consider the level of innovative capacity of Italian manufacturing firms compared with the European ones. Innovative capacity is one of the most important factor that help manufacturing firms to face the challenges coming from this crisis and to compete in an international framework, so best performing manufacturing firms would increase their investments in technology modernization and innovation expenditures to introduce several new product and process technologies ([4],[5]).
|
|
4. Findings
- The importance of the manufacturing sector is widely recognized, so that innovation theory has been basically derived from the analysis of technological innovation in manufacturing[6]. Indeed the manufacturing was considered the key drive for productivity growth because of its strong influence of technological innovation.Within the manufacturing sector, this research revealed different results with referred to: (a) technological equipment and investments in plant, machinery and ICT, (b) the amount of research and development activity (R&D), (c) the financing of intangible assets and R&D investments More specifically:(a) technological equipment and investments in plant, machinery and ICT.This analysis shows that the use of ICT in enterprises is now widespread in the Italian industrial structure: more than 82.4% of Italian companies, in fact, has a broadband Internet connection. The use is higher among the big companies (93.1% of firms with more than 250 employees have it) but also among SMEs more than 80% have it. The international comparison, however, shows a slight gap between Italy and the average of the countries included in the survey, which concerns both large companies and SMEs (the average spread in seven countries is equal to 89.2%).The cost of connection is not the major impediment in the spread of broadband (only 7.3% of companies indicate it as a problem). Rather, the main obstacles are the perception that broadband is not necessary to the companies activity (as indicated by 34.4% of companies without broadband) and the lack of connectivity of the territory (as indicated by 23.1% of companies). This confirms that the “digital gap” is still an issue to be addressed in our country.However, the more complex ICT technologies are less widespread compared to the other European countries. For example, the e-commerce information systems are adopted only by 13.9% of Italian firms, compared to 33.1% of Austrian firms, 28.5% of German firms and 50% of United Kingdom firms. During the period 2007-2009 the percentage of Italian companies investing in plant, machinery and ICT was 80.5%, ranking far below the average of the seven countries considered (equal to 87.8%). In the international ranking, Germany, Austria and Spain are at the first places; share of companies engaged in investment are respectively 97.1%, 94.7% and 91.4%. (Figure 1).
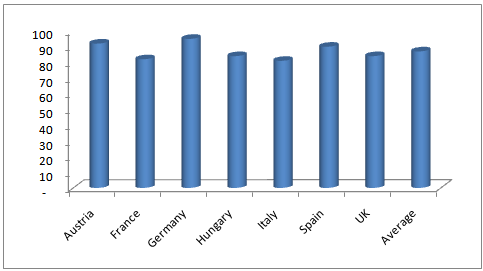 | Figure 1. Percentage of companies which have invested in technological equipment, plants, machinery and ICT in the 2007-2009 |
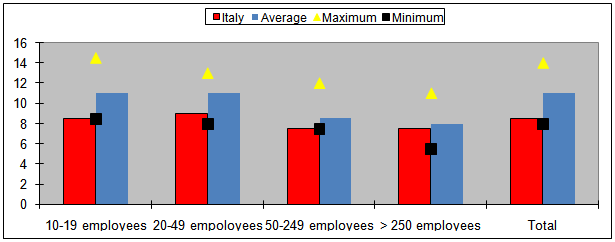 | Figure 2. Percentage on turnover of investments expenditures on plants, machinery and ICT in the 2007-2009 |
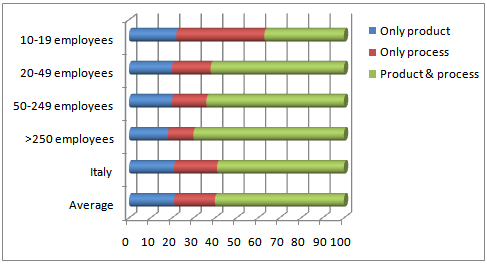 | Figure 3. Percentage of Italian firms that have introduced innovations in 2007-2009 by type |
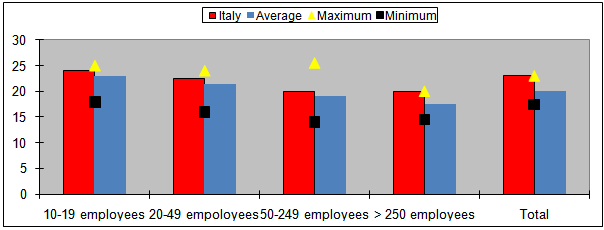 | Figure 4. Percentage of turnover achieved from innovative products sale in 2007-2009 |
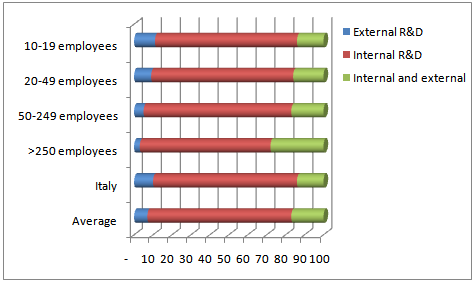 | Figure 5. Percentage of companies that perform R&D activities (by type) in 2007-2009 |
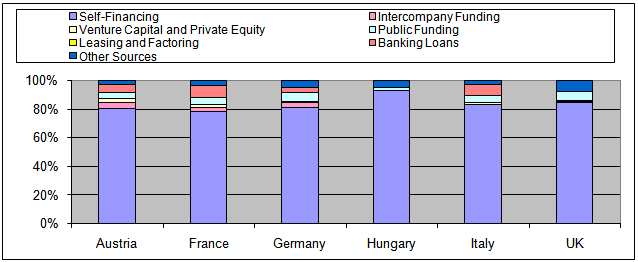 | Figure 6. Sources of financing of investments in plant, machinery and ICT in 2007-2009 (%) |
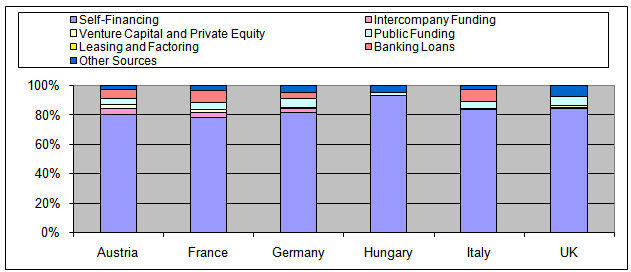 | Figure 7. Sources of financing of R&D in 2007-2009 (%) |
5. Conclusions
- In this paper I have investigated the level of technological equipment and investments in plant, machinery and ICT, the degree of research and development (R&D) activity and the way these kind of investments are founded across some European regions over the period 2007-2009.The paper focused on the innovative capacity of manufacturing firms and tries to explain the reason for the existent gap (in terms of turnover, confidential indicator and trend of profit) between the Italian companies and the European ones and tries to suggest some specific advices at policy makers level.The findings of this paper suggest that the basic technological infrastructure reached a widespread diffusion in the Italian industrial structure, as well as in the other countries considered. However, advanced ICT use is less common in Italy. Regarding the investments in equipment, machinery and ICT over the period 2007-2009, Italian companies appear to be less active compared to the other firms in the sample (both in terms of number and sales). However, the lower Italian propensity to invest is not combined with a stronger response to the 2009 crisis: 28% of Italian companies, in fact, report a decrease in tangible assets investments in 2009, compared to 33.1% in the total sample.On the contrary, regarding the technological innovation, the activity of Italy is above the average of the seven countries considered. A large part of the companies is involved in product and process innovations, although the simultaneously coexistence between the latter and the organizational changes is less evident. Moreover, Italian firms are largely engaged in R&D, confirming to prefer in-house R&D, but proving to be more prone to research and development outsourcing than the whole sample. University research, instead, is still poorly valued: even by international standards, there are very few Italian companies using universities as research providers.On the financing side (concerning the level of this analysis), self-financing is confirmed to be the preferred tool for investments in machinery, equipment and ICT in all the countries considered. However, in Italy, it covers a share lower than the sample mean of investment spending. Instead, the considerable use of leasing and factoring is typical of Italy. Furthermore, few Italian companies set a specific funding strategy for R&D expenditure and use less financial instruments than other foreign firms, such as France, Germany and Austria. Summarizing the main findings of this paper it is possible to state that Italian companies have a good basic ICT supply, but they invest relatively less than the average in new infrastructure, machinery and equipment. R&D investments are stronger, although their funding strategies are unbalanced towards traditional debt instruments and they are more undifferentiated considering the final objectives of the investment.This research results suggest two main policy implications: first, the stimulation of investment in technological equipment and plant, machinery and ICT through tax breaks. This would be particularly relevant for SMEs that have investment levels significantly below the best manufacturing firms in Europe; this situation is not strictly linked to the crisis but is closely linked to the Italian structural framework. Second, the provision of subsidized loans for innovation research and/or tax breaks and incentives for university research to ensure a proper diversification of funding sources.In future it may be interesting to find out and try to measure others factors that could influence the innovative capacity of manufacturing firms, such as: the quality of human resources or some country specific advantages that could improve and make more clear conclusions.
 Abstract
 Reference
 Full-Text PDF
 Full-text HTML