-
Paper Information
- Next Paper
- Previous Paper
- Paper Submission
-
Journal Information
- About This Journal
- Editorial Board
- Current Issue
- Archive
- Author Guidelines
- Contact Us
Management
p-ISSN: 2162-9374 e-ISSN: 2162-8416
2012; 2(4): 87-95
doi: 10.5923/j.mm.20120204.02
The Relationship Between Subsidiary Size and Subsidiary Autonomy in Turkish Outward Foreign Direct Investments
 Abstract
 Reference
 Full-Text PDF
 Full-Text HTML
İbrahim Anıl 1, Ozgur Cakir 1, Cem Canel 2, Rebecca Porterfield 2
1Marmara University, Faculty of Business Administration and Economics, Istanbul, Turkey
2UNC Wilmington, Cameron School of Business, Wilmington NC 28403, USA
Correspondence to: Cem Canel , UNC Wilmington, Cameron School of Business, Wilmington NC 28403, USA.
| Email: |  |
Copyright © 2012 Scientific & Academic Publishing. All Rights Reserved.
This study investigates the relationship between subsidiary size and subsidiary autonomy in forty-two Turkish companies investing directly in Central Asia, Russia and Balkan countries. Literature exists on the size-autonomy relationship among subsidiary companies in developed economies but little focuses on developing economies. The findings of the study indicate that autonomy levels among subsidiaries of Turkish companies involved in outward direct investment are similar to those of subsidiaries from developed countries.Experience in the target market significantly affected the autonomy levels of subsidiary companies. The relationship between autonomy and size is differentiated depending on the decisionlevels involved.
Keywords: Autonomy, Subsidiary Size, Ownership Advantages
Article Outline
1. Introduction
- Following the dissolution of the Soviet Union, many Turkish companies have sought opportunities for direct investment in the newly formed republics. Direct investments by Turkish companies and individual entrepreneurs usually take place in two forms ofcorporate structure: independent companiesor subsidiary companies managed by a central company. Extensive literature exists on the size-autonomy relationship among subsidiary companies in developed economies([1-4]). Factors such as international experience, brand and product image, use of technology and managerial information, experience in markets of the chosen country, quality of professional development programs, staff quality and product differentiation and development skills were measured as the starting advantages (ownership) of the firms([5-9]).The present study includedforty-twoTurkish companies with interests in seven different countries (Bulgaria, Romania, Uzbekistan, Kazakhstan, Turkmenistan, Kyrgyzstan and Russia).This study was conducted with the support of the Scientific Research Commission of Marmara University, Turkey. The link between autonomy and size was tested through the quadratic model developed by Hedlund[2], which was subsequently validated by the work of several researchers([1,3,4]).The level of company autonomy was tested by comparing the relative influence of the subsidiary or central company usingthirteen factors, and the size of the subsidiary company was defined by the number of workers[1].When explanatory factor analysis is applied to the thirteen autonomy criteria, the results are distributed under three factors. Each factor contains a different level of autonomy. Factors such as international experience, brand and product image, use of technology and managerial information, experience in markets of the chosen country, quality of professional development program, staff quality and product differentiation, and development skills were measured as the starting advantages (Ownership) of the firms([5-9]). Two of the three motives that Dunning used in his “Eclectic” approach exist among the investment motives of Turkish firms: seeking markets and seeking resources([6,7]). The present study uses two groupings since the companies in this region do not have the opportunity to engage in international growth[10] and therefore, seek strategic resources and opportunities to innovate. The results indicate that autonomy is greater among resource-seeking subsidiaries than market-seeking subsidiaries.Theresults are discussed with reference to resource-based theories([11-13]).Autonomy, as a variable of organizational structure, has been the focus of many studies within business literature. The determinants of organizational structure form an important axis of business studies. Decisions regarding centralization or autonomy are tools utilized by companies in order to solve problems or to evoke their sources to achieve their goals in the most effective way. When the goals are in question,it is intended to maximize profitability and reduce commercial risks[14]. Business activities conducted overseas involve greater risk because the activities are conducted in a different political and commercial environment from those of the home country. Effective management,in this case,is more difficult for the central company. Although the central company may wish to retain control of all decisions, commercial risk perception and the importance of the opportunities utilized by the subsidiary company are considered to determine the subsidiary company's level of autonomy.The autonomy levels of subsidiary companies have been the focus of studies within the field of international management since 1980. Previous researchers have attempted to define the determinants of subsidiary autonomy levels. Garnier[14] suggested that risk perception is a significant determinant in the autonomy of corporate subsidiaries and determined the relationship between the central and subsidiary company based on three distinct elements[14]. Previous studies have consistently found that the size of the subsidiary company is an important factor in establishing its level of autonomy[12]. Some studies concluded that the growth and conditions of the home country of the central company were determinants in subsidiary autonomy[2]. Birkinshaw and Hood[15] claimed that size is just one of the determinants of autonomy. Previous researchers have also studied the competency strategies of subsidiary companies[16] as well as the growth of resources administered and controlled by it[2] and the ways in which initial advantages affect autonomy[15]. Since business expansion requires the complexcoordination of processes and greater expert knowledge and experience, it may be necessary to have dependence on the central company[1].The autonomy level of the subsidiary company varies depending on the criteria by which it is measured.Other researchers utilized three, seven, and nine criteria andthey contained differences despite the similarities. Decisions regarding capital expenditure, appointment and evaluation of top level executives as well as the development of quality standards and the selection of suppliers do not have the same importance.This research utilized the results of thirteen criteria based on various types of decisions throughout different areas of the business and autonomy levels. Each decision is individually assessed with regard to strategic, functional and operational areas. The next section presents the methodology and research findings, and section three provides conclusions.
2. Methodologyand Findings
- The modelling framework of this research consisted of the direct investment of Turkish companies in seven foreign countries. Research samples representing different sectors were drawn randomly from members of the Association of Businessmen and the Commerce Office of Attaché. Surveys were administered in the seven countries with which direct investments were conducted by the Turkishcompanies.Data was collected via a questionnaire form with thirteen questions designed to measure the level of dependent degree on the central company. The questionnaire structure was similar to the one used by GlaisterandTatoğlu[17]. In this study, data from forty-two firms that directly invest in the seven countries was collected through surveys and in-depth interviews with the top executives.The population of this study was determined by Turkish Businessman Associations and Turkish trade attaches of each country. Each firm that had more than fifty employees was visited during the research resulting in the sample of forty-two firms.The survey utilizes a 5-point Likert scale where the lowest level is indicated by 1 and the highest level is indicated by 5. The thirteen factors are: 1)Capital expenditures, CAPEX2)Product development, PRODEV3)Strategy formulation, STRFOR4)Pricing strategy, PRISTR5)Marketing and sales, MNGSALE6)Quality standards, QUASTN7)Choice of suppliers, CHOSUPP8)Budgeting process, BUDPRC9)Dividend policy, DIVPOL10)Wage andlaborpolicy, WAGEPOL11)Training and development policy, TRAIPOL12)Selection, promotion and compensation of executives, SPCEXC13)Administration and supervision, ADMSUP.The organizational size variable was measured through the number of subsidiary workers. Although this variable was often utilized as a scale variable during the initial phases of the research, it was replaced with the categorical variable in the later phases.
2.1. Findings of Autonomy and Size Relations
- Each participating subsidiary company was asked about its dependence on the main company. Since dependence on the main company and autonomy are inversely related, autonomy levels are calculated based on the level of dependence on the main company. Table 1 presents descriptive statistics for the responses to the questions. In these responses, the higher mean values refer to lower autonomy.After the preparation of data was performed and the descriptive statistics were tabulated, factor analysis was carried out to test the validity of the questionnaire and to determine how many of the thirteen factors could be denoted in establishing a model for the dependence level. Here, each variablerefers to the related question.The results indicated that three different factors contribute to the measured dependence on the main company. These factors are the functional, the strategic,and the operational ones. Table 2 shows the results of the factor analysis.
| ||||||||||||||||||||||||||||||||||||||||||||||||||||||||||||||
| ||||||||||||||||||||||||||||||
|
|
| ||||||||||||||||||||||||||||||||||||||||
| |||||||||||||||||||||||||||||||||||||||||||||||||||||||||||||||||||||||||||||||||||
|
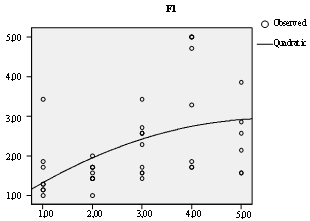 | Figure 1. Quadratic Trend in Factor I in terms of Size |
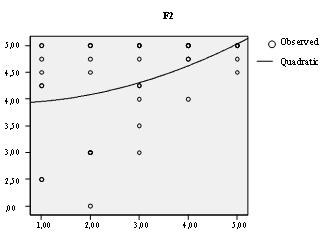 | Figure 2. Quadratic Trend in the Factor II in terms of Size |
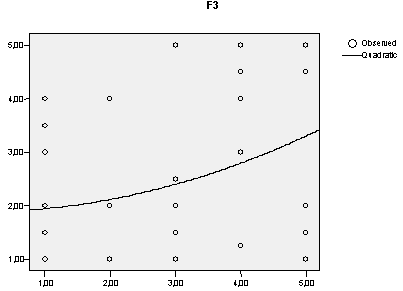 | Figure 3. Quadratic Trend in Factor III in terms of Size |
2.2. The Relation of the Destination Aim with the Level of the Dependence
- Among the investment motives of Turkish firms, it is possible to find two of the three motives that Dunning used in his “Eclectic” approach: investing to seek markets and to seek resources([6,7]). These two groupings are used in the present study.Differences were observed as a result of the classification performed according to the variable “the effect of the market size of the country, as a market-seeking motive in the investment decision”,which was the primary reason for establishing the subsidiary company. Similarly, the level of dependence differentiated in the classification conducted according to the effect of the variable “the facility of the access to the neighboring markets as a resource-seeking motive in the investment decision”. An independent sampling T test was utilized to test for significant differences for both variables for the subsidiary companies classified in these two groups. The results are presented in Tables9 and 10.A statistically significant difference was found at the 0.05 confidence level for factor 1, in terms of dependence, between the companies targeting market growth of the destination country and the others. The significance level was 0.006. No statistically significant difference was found at the 0.05 confidence level for factor 2, in terms of dependence, between the companies targeting the market growth of the destination country and the others. The significance level was 0.757.No statistically significant difference was found at the 0.05 confidence level for factor 3, in terms of dependence, between the companies targeting the market growth of the destination country and the others. The significance level was 0.121.No statistically significant difference was found at the 0.05 confidence level for factor 1, in terms of dependence, between the companies targeting the resources of the destination country and the others. The significance level was 0.867.There was a statistically significant difference at the 0.05 confidence level for factor 2, in terms of dependence, between the companies targeting the resources of the destination country and the others. The significance level was 0.027. No statistically significant difference was found at the 0.05 confidence level for factor 3, in terms of dependence, between the companies targeting the resources of the destination country and the others. The significance level was 0.864.
| |||||||||||||||||||||||||||||||||||||||||||||||||||||||||
| |||||||||||||||||||||||||||||||||||||||||||||||||||||||||
| |||||||||||||||||||||||||||||||||||||||||||||
2.3. Relationship between Ownership Advantage and Autonomy
- Based on self-identification in the survey, it is observed that the experienced firm groups’ average value of the independence on the main company in the destination country is higher than that of the relatively inexperienced firm groups. A T test of independent samples was conducted to establish whether this difference was statistically significant at the 0.05 confidence level.Factor 1 shows differences in terms of experience in the destination country. The significance level of the difference was 0.027 between the company groups that were experienced and those that were inexperienced. Factor 2 shows differences in terms of experience in the destination country. The significance level for factor 2 was 0.008 between the experienced groups and inexperienced groups in the destination country. Factor 3 shows differences in terms of experience in the destination country. The significance level for factor 3 was 0.031 between the experienced groups and inexperienced groups in the destination country. No significant difference was observed in terms of the other starting advantages of the ownership.
3. Conclusions
- The findings of the present study indicate that autonomy levels among subsidiaries of Turkish companies involved in outward direct investment are very similar to those of subsidiaries from developed countries. Findings also show that experience in the target market significantly affected the autonomy levels of subsidiary companies. The relationship between autonomy levels and size of Turkish companies is differentiated by their decision areas. In the area of strategic decisions, all strategic decisions measured remain within the control of the main company when the scale augments widely and the main company is highly effective independent of the size of the operations for all decision areas. Decisions concerning the designation of quality standards and selection of suppliers are taken with higher autonomy for subsidiaries and with lower autonomy for the main company within small scale subsidiary companies. The control of the main company increases in parallel with the augmentation of the scale and decreases the autonomy of the subsidiary company. The autonomy of subsidiaries declines with increasing organizational scale within larger-scale organizations.The main company retains a greater level of central control, thereby reducing the autonomy of the subsidiary. In terms of the decisions concerning the determination of politics belonging to the functional area, the control of the higher autonomy is in question for the small scale subsidiary companies and the control of the main company is lowest for large scale organizations. In terms of factors 1 and 2, when the five size categories are examined, the findings indicate that there is no difference in levels of autonomy between the smallest to the largest scale companies. The resultsprove that a compatible consequence with the quadratic modelling has derived.In cases where there is an experienced main company, central organization in the chosen country’s markets, in terms of the relation between scale and autonomy, it was found that the control of the main company is higher while that of the subsidiary is lower.The autonomy level of subsidiaries, whose firms take market growth as the basis for the selection of countries, is higher in the area of functional decisions. A significant difference was found in terms of the strategic decisions concerning the autonomy of subsidiaries of firms seeking resources within the chosen country, with greater decision-making retained at the main company.This research adds to the existing body of knowledge for developed and less developed economies by providing statistical insights on the impact of size and autonomy as related to outbound direct foreign investments. The results enhance understanding of these factors as related to both the motives of market expansion and resource utilization. Managers engaged in less developed economy countries will find decision processesin tandem with processes commonly understood in developed economies. Findingcommon mindsets in the complex world of international business is advantageous to global managers everywhere.
References
| [1] | Johnston S. And Mengüç B., “Subsidiary size and the level of subsidiary autonomy in multinational corporations: A quadratic model investigation of Australian subsidiaries”,Journal of International Business Studies, vol. 38, no. 2, 2007. |
| [2] | Hedlund, G., Autonomy of subsidiaries and formalization of subsidiary relationship in Swedish multinational corporations, in L. Otterbeck (ed) The management of headquarters: Subsidiary relationships in multinational corporations, Gower: Aldershot, 1981. |
| [3] | Paterson, S.L., and Brack, D.M., “The development of subsidiary-management research: Review and theoretical analysis”, International Business Review, vol. 11, no. 2, 2002. |
| [4] | Grover, V., Davenpont, T.H., “General perspectives on knowledge management: Fostering research agenda”, Journal of Management Information Systems, vol. 18, no. 1, 2001. |
| [5] | Hymer, S.H., The international operations of national firms, Cambridge, Mass. The MIT press. 1976. |
| [6] | Dunning, J.H., “Trade, location of economic activity and MNE: A search for an eclectic approach”, in; Ohlin, B., Hesselbaum, P.O. and Wijkman, P.M. (ed.) The International Allocation of Economic Activity, Macmillan, London, 1977. |
| [7] | Dunning, J.H.,Multinational enterprises and global economy, Addison-Wesley: Wokingham, 1993. |
| [8] | Dunning, H.J., “The eclectic paradigm as an envelope for economic and business theories of MNE activity”, International Business Review, vol. 9, no. 2, 2000. |
| [9] | Comison-zomoza C, Lapiedra-Alcami, R., Segarra-Cipres, M., Boronat-Naverra, M., “A Meta-analysis of innovation and organizational size”, Organization Studies, vol. 25, no. 3, 2004. |
| [10] | Makino, S., Lau, C.M., Yeh, R.S., “Asset-exploitation versus asset-seeking: Implications for location choice of foreign direct investment from newly industrialized economies”, Journal of International Business Studies, vol. 33, no. 3, 2002. |
| [11] | Hoskisson, E.R., Eden, L., Lau, M.C. and Wright, M., “Strategy in emerging economies”, Academy of Management Journal, vol. 43, no. 3, 2000. |
| [12] | Negandhi, A.R., and Baliga, B.R., Internal functioning of American, German and Japanese multinational corporations, in L. Otterbeck (ed) The management of headquarters: Subsidiary relationships in multinational corporations, Gower: Aldershot, 1981. |
| [13] | Cool, K. And Henderson, J., “Power and firm profitability in supply chains: French manufacturing industry in 1993”, Strategic Management Journal,vol. 19, no 10, 1998. |
| [14] | Garnier,G.H.,"Contextanddecision-makingautonomyintheforeignaffiliatesofU.Smultinational corporations", Academy of Management Journal, vol. 25, no. 4, 1982. |
| [15] | Birkinshaw,J.M.,andHood,N., "Anempiricalstudyofdevelopmentprocessesinforeign-owned subsidiariesin Canadaand Scotland",Management International Review, vol.37, no. 4, 1997. |
| [16] | Bartlett,C.C.andGhoshal,S.,"Tapyoursubsidiariesforglobal reach", Harvard Business Review,vol. 64, no. 6, 1986. |
| [17] | Glaiser, K.W., and Tatoglu, E., “Determinants of foreign direct investment in Turkey”, Thunderbird International Business Review, vol. 40, no. 3, 1998. |