Hong Seung Ko 1, Tomoko Shikama 1, Yuuhi Sai 2, Ken Niho 3
1The Kyoto College of Graduate Studies for Informatics, Kyoto, 606-8225, Japan
2Fuji Electric Device Technology Co., Ltd, Tokyo, 141-0032, Japan
3NTT Data I Corporation, Tokyo, 162-0824, Japan
Correspondence to: Hong Seung Ko , The Kyoto College of Graduate Studies for Informatics, Kyoto, 606-8225, Japan.
| Email: |  |
Copyright © 2012 Scientific & Academic Publishing. All Rights Reserved.
Abstract
Through the marketing issue of e-customers retention is very important in the e-business situation; there are very few suitable models concerned. As the proper model, Ko et al.[4] suggested the strategic e-customer relationship marketing (e-CRM) model for retaining e-customers. We consider that this strategic e-CRM model becomes a key issue in the e-customer retention. Therefore we consider that this strategic e-CRM model is needed to verify it’s validity. In this paper we analyzed the validity of this strategic e-CRM model supposed by the nomological validity method and the . As a result, we find out that this model has the practicality and the effectiveness as the e-marketing process model.
Keywords:
e-Customer Retention, e-Marketing Strategy, Communication Tool, e-Customer Relationship, e-CRM Model, Validity Analysis
1. Introduction
The development and widespread use of the internet in a short time is making the market of e-business a large scale. By the white paper on information and communications published by the government of Japan in 2006, the e-business global market scale grew 13 times during 5 year, and the annual average growth rate is more than 70%. Therefore, we can feel that the e-business has rapidly developed in the economic environment. However, it is highly regrettable that even though the e-business has accomplished with the rapid growth, the corresponding effective e-marketing strategy, especially for retaining e-customers has not been mapped out yet. As the main reason, there are several problems such as the difficulty on performing a marketing strategy on the internet, and the misuse of e-mail as the e-marketing tool.One reason of the difficulties on carrying out an e-marketing strategy is the gap between the online and the offline environments in the customer behavior. The one distinctive feature on the online as opposed to the offline environment is that not only the e-customer can easily and freely hop from the visited website to other global one by only one click but the e-customer is invisible. In other words, it is very difficult to retain customers on the online. circumstances concerned make the development of the effective e-marketing difficult. The e-mail is strategically utilized as the customer acquisition tool on the internet because cost is very cheap. According to the research on the comparison of cost per the type of communication tools by the Contact Babel[10], the cost of automated e-mail used generally is 0.25 dollar, whereas the interactive voice response (IVR) is 1.1 dollar and the telephone is 9.5 dollar[5]. That is, the cost of IVR is about 4.4 times of e-mail cost, and the cost of telephone is about 38 times. Therefore, we can soon find out that e-mail is the cost-effective tool. However, it causes a nuisance to the receiver because e-mail is used as a promotion tool to acquire new e- customers. This means that a lot of marketers induce the critical fault of merely replacing traditional direct mail by e-mail only because it is cheaper without considering the strategic e-marketing concept. As a result, most of the receivers treat the promotion e-mails as spam. In fact, according to the study report by Radicati Group Inc.[11], spam mails sent every day in 2006 became 122 billion messages, which is equivalent to about 70% of e-mail traffic, and by 2010, the spam rate will increase to 79%. In the situation that the spam mails are flooding, the distrust on e-mails sent from companies for getting e-customers has broadly spread to e-customers. More than all, the e-mail is no efficient way to get new e-customers. However, we consider that it is possible to make a best use of the essential e-mail strength by reviewing the use of e-mail. That is, a marketer must be use the e-mail to retain the e-customer rather than to acquire the e-customer. Generally, the customer retention is very important to improve profitable sales in companies as you can confirm it in the Pareto Principle. This well known phenomenon is the same matter in online situation. But it is very difficult to retain customers in the online as mentioned earlier. Accordingly, there are very few suitable models concerned Ko et al.[4] described that you should utilize e-mail as the means to encourage the mutual understanding and build a confidence with customers and companies in the e-business. And then they discussed the communication and relationship needed for developing long-term relation with e-customers. Furthermore, they discussed the segmentation of target e-customers that must be retained. Based on these considerations, they developed the strategic e-customer relationship marketing model. We think that this model is especially worthy of notice as the basic retention model in online. However, this strategic e-CRM model must be verified it’s validity. To verify the validity of this model, it is good to use in practice more than anything else. But it is not easy in reality. Therefore, we will analyze the validity of this model by the analysis tool. For one thing, we will prove the reliability of obtained data with the internal consistency method and the split-half reliability method. Then, for verifying the practicality and the effectiveness of this model, we will the validity concerned by the nomological validity method and the .
2. The Strategic e-Customer Relationship Marketing Model
Ko et al.[4] have discussed about the roles of communication for maintaining the relationship with e-customers and of e-mail as a communication tool. Also they have discussed the ways of selecting the most valuable e-customer who should be retained. Based on these concepts, they proposed the strategic e-CRM model for bringing long-term profits to a company. In their model, they considered five prerequisites necessary to carry out this strategic e-marketing process model.
2.1. Prerequisites for Performing the Strategic e-CRM Model
They focused on a continuous communication by e-mail which is used as a communication media. Because the relationship with e-customers will be strengthened through the continuous communication, it can directly and steadily plug into the retention of target e-customer. Since the continuous interactive communication needs to be kept, it is necessary to create environments concerned. That is, they suggested some prerequisites needed for developing their strategic e-marketing process model as follows. Prerequisite 1: Realizing the e-Customer Empowerment Based on the concept suggested by Mikiyoshi Aoki[6], They defined the empowerment that a company vests the power or the authority to an e-customer to collaborate closely with the company, because the closer partnership will be built up as the e-customer is empowered. Urban[2] stated that the internet increased an e-customer power surprisingly, and reformed the interrelation between the e-customer and a company from the root. Moreover, Drucker[7] said that formerly, the supply side having information concerned with products and services, especially the manufacturer held the supremacy in the market. However, current customers have the related information through the online, and anyone who has the information holds a power. Accordingly, the power has shifted to e-customers. Therefore, we can consider that there will be the influences on the partnership in the aspects of relationship and emotions between an e-customer and a company by the empowerment.Prerequisite 2: Understanding the Learning RelationTo satisfy the former prerequisite helps to understand and keep the learning relation. It is because that the empowered e-customer is able to behave more actively. Moreover, the e-customer try to convey his /her own needs and wants to the company more aggressively as he or she understand the concept of learning relation that giving the own concerned information and making the company to learn become the own profits. Through this process, a company will learn e-customer’s needs and wants, and then the e-customer is able to obtain something which is best suited for his/her own desires from the company. Kotler[8] also said that the more a customer conveys information to a company, the more the company comes to be able to offer the thing as the customer just desires. The company is also able to improve the own capability for handling e-customers’ desire by learning the e-customer’s needs and wants through the interactive communication. At the same time, it becomes possible to offer a personalized product or service and as a result, it brings about an immeasurable competitive advantage. Prerequisite 3: Visualizing an e-Customer’s Privilege In the e-business environment, it is necessary to visualize an e-customer’s privilege so that let the e-customer actually perceive the empowerment. However, it is not easy to visualize an e-customer’s privilege on the online, because companies do not have the recognition for the real privilege service yet. Kotler[9] said that a customer doesn’t understand the service easily because the service is intangible. Then, the customer tries to look for the clue that shows the quality of service, and the company handles this situation with the quality of service. However, it has not been clearly offered by a company with lacking the understanding of privilege, because the concept of the privilege service is still new and unfamiliar in e-business. Therefore, it is necessary to have the means to make an e-customer privilege visible in the online to show the loyalty to the e-customer so that the empowered e-customer can forward his/her needs and wants to the company.Prerequisite 4: Recognizing the Boundary with a Company’s handling Cap Ability.Kotler[9] said that a company that offers a service is evaluated by reliability. However, the trust is indispensable to keep the continuous relationship with all existing customers on the online not only in companies related to service but in all companies. Little things destroy the trust relation in an instant even if the mutual trust has been built for a long-term. That is, there is a great possibility not to be able to comply with the requests from an e-customer when the e-customer’s needs and wants are over the handling capability of a company. As a result, it may create the rift in trust relation between an e-customer and a company, and then there is possibility not only to connect to the e-customer’s churning but to cause the heavy loss to a company. Therefore, to continue the trust relation by returning the anticipated results to an e-customer, it is necessary that the company must shows clearly the own adaptive range and get the e-customer’s understanding for the limits of company’s handling capability. Prerequisite 5: Companies Must Have a Perception that the Expense for Retention is InvestmentIt costs more when a company communicates closely with existing e-customers and carries out requests from the target e-customers for retaining. Sometimes, e-customers may push their needs and wants to be unprofitable to a company. However, in the long-term view point, we can expect that even if there will be a situation with a temporary loss, coping positively with an e-customer’s needs and wants keep the retention of the e-customer and can bring the long-term profits. That is, e-customers in their strategic e-marketing model are the 20% most profitable and valuable e-customers who give a company 80% of the profits. Furthermore, they give additional profits as to bring new e-customers to the company through the buzz. Therefore, the company must have a perception that the expense on handling the e-customer’s requests is not cost but investment. More concretely to say, to consider the expenditure generated by handling these e-customers’ requests as the investment can be connected to the realization on the visualization of e-customers’ privilege, and then can comply generously with the e-customer’s own way. Accordingly, the relationship based on mutual trust between the company and the e-customer becomes stronger and more powerful. As a result, the increase of long-term profits through the e-customer retention as the ROI can be expected.
2.2. Model of the Strategic e-Customer Relationship Marketing
When the above-mentioned five prerequisites are met, the strategic e-CRM model (see Figure 1) is able to carry out. The strategic e-CRM model is basically composed of five stages, three phases and the relationship strength. At first, they explained the stages and the phases by showing the changes of the relationship strength between a company and an e-customer according to the time passing. Stage 1: Forwarding an e-Customer’s Needs and Wants The stage 1 is the trigger stage where the most valuable e-customer who has already taken some communications with a company conveys his/her needs and wants that become a motive of the e-marketing process model beginning to the company. Stage 2: Learning an e-Customer’s Needs and Wants through the Interactive CommunicationThis stage is the place where the learning relation between an e-customer and a company is carried out on the e-customers' needs and wants forwarded based on the trust relation at the trigger stage. Stage 3:Maintaining the Commitment of an e-Customer In this stage, dealing with an e-customer based on his/her needs and wants learned in the former stage take the e-customer's commitment out.There have been various views on the commitment. They considered the commitment stated by Dwyer et al.[1] as follows. The commitment is the implicit and explicit contract to retain the relationship between exchange partners. In this stage, they consider on the commitment that it is the implicit contract concerning with keeping the relationship which is generated by keeping contacting a company's web site. 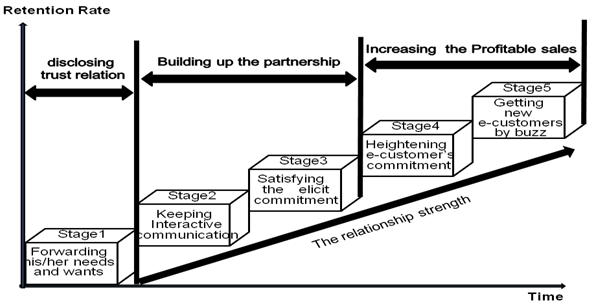 | Figure 1. The strategic e-customer relationship marketing model |
Stage 4:Retaining an e-Customer by Improving the e-Customer’s CommitmentAs the strong partnership generated in the stage 3 makes the realization of a further request repeat for the e-customer with whom the commitment was met once, an emotional and functional benefit of the target e-customer improves more, and the higher e-customer’s commitment will be brought out. Through this continuous process, the relationship with an e-customer strengthens more, and then the situation with retaining the e-customer more certainly is taken place.Stage 5:Getting New e-Customers with the BuzzIn this stage, a company can not only bring the sales or profit increase by an e-customer retention but also get a new e-customer acquisition which is the synergy effects caused by the e-customer retention with the gradual heightening of the commitment in the stage 4. It is expected that as the commitment is reached to a constant level, the retained e-customer takes the special behavior such as the buzz that a general e-customer doesn't. Phase 1: Actualizing of the Trust RelationThis phase shows the situation that an e-customer can not only take the action in the stage 1 but also move to the next stage. Phase 2:Building up the PartnershipIn the phase 2, an e-customer and a company mutually understand the relationship as the partner by making the company to learn the e-customer’s needs and wants through the e-customer empowered forwards his/her own request more actively to the company. Phase 3:Increasing the Profitable SalesWe can look at the phase 3 that the situation is happened, where the e-customer retained with the strong relationship built up through the stage process brings the long-term effects to the company. Namely, the effect of the long- term sales improvement is expected through the retention of the most valuable e-customer and the new e-customer acquisition by the buzz as results in the stage 4 and 5.Therefore, so long as the desires from an e-customer empowered are generated, the process from the stage 1 to the stage 3 is repeated endlessly by interactive communications, and then the relationship with the e-customer is further strengthened. There are various expected effects of the e-customer retention resulted in the very strong relationship built up by this continuous communications. But first and foremost, the most valuable benefits of this model are the direct sales increase from the e-customer retained and the profitable sales by new e-customers acquired with buzzing. As described in the above prerequisites, the high satisfaction and the feeling of achievement to be perceived will sprout the high commitment to the relationship with a company when an e-customer's desire with the awareness of joining the plan is realized. Moreover, the e-customer will do not only his or her purchase activity but also the promotion activity by keeping the gradual increase of the commitment through the partnership with the company. Ultimately, a buzzing effect from the e-customer is yielded. As a result, the company can realize the improvement of long-term sales as well as get a new e-customer acquisition generating a new effect of increasing profits by the most valuable e-customer retention.
3. Verification on the Validity of the Strategic e-CRM model
In this chapter, we will verify the validity of the e-CRM model suggested by Ko et al. First, we explain the overview of the questionnaire survey which is done to obtain data for verifying the effectiveness of this model. And then, we test the reliability concerning the question items of the questionnaire survey by the internal consistency method and the reliability of data obtained from the questionnaire survey by the split-half method. Consequently, we verify the validity of the strategic e-marketing model using data proved to be reliable by the nomological validity.
3.1. Overview of Questionnaire Survey
We drew up question items concerning the strategic e-CRM model and carried out the questionnaire survey on the Internet. For a kickoff, we did the preliminary survey aiming to check out whether there are problems in question items of the questionnaire by student interviews and questionnaire survey at the Kyoto College of Graduate Studies for Informatics (KCGI). Then, we conducted the main questionnaire survey with the question items which were improved. We will verify the validity of the strategic e-CRM model by using collected data. The summary of the questionnaire survey is shown in Table 1. The question items of the questionnaire survey are largely divided into two categories. The first category of question items is focused on the segment of the experienced and the novice on the internet shopping. In this category, we prepared question items for selecting 20% e-customers from the experienced students by using 5 factors concerning the e-customer segment. The second category is focused on question items concerning the 3 angles on the stage, the phase and the relationship strength of the strategic e-CRM model considered. In the second category, we intended to get data whether novices take the behavior calculated. For each item of the reply column, we quantified data by using the multiple choice system of five stages.
3.2. Reliability Test on the Data Obtained from Questionnaire Survey
| Table 1. Summary of the Questionnaire Survey |
| | | Preliminary Survey | Main Survey | | Survey Period | From OCT. 6 2007to OCT. 12 2007 | From NOV. 1 2007to SEP. 1 2007 | | Respondent | Students of KCGI | Students of KCGI andKyoto Computer Gakuin | | AvailableReply Number | 15 students(Valid reply rate 100%) | 134 students(Valid reply rate 80.2%) | | Survey Way | Interview andInternet survey | Internet survey |
|
|
Since the reliability is the prerequisite for verifying the validity of the strategic e-CRM model, we check the internal consistency of the question items with the internal consistency method, and then analyze the reliability of data by using the split-half method. So as to judge the internal consistency of the question items, we apply the Cronbach's α coefficient. Ordinarily, we can consider that it is with high reliability when the Cronbach's α coefficient is 0.8 or more. The analysis results by SAS software are show that the Cronbach’s α coefficient of the experienced to be calculated is 0.85, and the novice is 0.87. With these results, we can confirm that the question items of the questionnaire survey are proved to keep the high consistency. Next, we analyze the data obtained from the questionnaire survey for verifying the reliability of data by using the split-half method. After dividing the data of the experienced into half 1 (n=53) and half 2 (n=53) at random, we check the data consistency by calculating the correlation coefficient between stages of half 1 and half 2 (see Table 2 and Table 3). As shown in the Table 2 and Table 3, in half 1 the correlation coefficient of between the stage 1 and the stage 2 is r=0. 452 (p<0.001). On the other hand, the correlation coefficient between the same stages in the half 2 is r=0.620 (p<0.001). That is, it is shown that the coefficients calculated in the half 1 and half 2 are almost approximated. | Table 2. The Correlation Coefficient of between Stages on the Experienced – Half 1 |
| | Spearman's Correlation Coefficient N = 53H0: Rho=0 Prob > |R| | | | Stage1_a | Stage2_a | Stage3_1_a | Stage3_2_a | Stage4_1_a | Stage4_2_a | Stage4_3_a | Stage5_a | | Stage1_a | 1.00000 | 0.45225 | 0.14191 | 0.07396 | 0.54000 | 0.31294 | 0.21417 | 0.21887 | | | 0.0007 | 0.3107 | 0.5987 | <.0001 | 0.0225 | 0.1236 | 0.1154 | | Stage2_a | 0.45225 | 1.00000 | 0.41520 | 0.23989 | 0.52258 | 0.38118 | 0.27398 | 0.14596 | | 0.0007 | | 0.0020 | 0.0836 | <.0001 | 0.0049 | 0.0471 | 0.2970 | | Stage3_1_a | 0.14191 | 0.41520 | 1.00000 | 0.50263 | 0.35973 | 0.50460 | 0.41913 | 0.34666 | | 0.3107 | 0.0020 | | 0.0001 | 0.0082 | 0.0001 | 0.0018 | 0.0110 | | Stage3_2_a | 0.07396 | 0.23989 | 0.50263 | 1.00000 | 0.34139 | 0.46914 | 0.36666 | 0.23010 | | 0.5987 | 0.0836 | 0.0001 | | 0.0124 | 0.0004 | 0.0069 | 0.0974 | | Stage4_1_a | 0.54000 | 0.52258 | 0.35973 | 0.34139 | 1.00000 | 0.42552 | 0.41175 | 0.33150 | | <.0001 | <.0001 | 0.0082 | 0.0124 | | 0.0015 | 0.0022 | 0.0153 | | Stage4_2_a | 0.31294 | 0.38118 | 0.50460 | 0.46914 | 0.42552 | 1.00000 | 0.74176 | 0.38501 | | 0.0225 | 0.0049 | 0.0001 | 0.0004 | 0.0015 | | <.0001 | 0.0044 | | Stage4_3_a | 0.21417 | 0.27398 | 0.41913 | 0.36666 | 0.41175 | 0.74176 | 1.00000 | 0.69968 | | 0.1236 | 0.0471 | 0.0018 | 0.0069 | 0.0022 | <0001 | | <.0001 | | Stage5_a | 0.32887 | 0.14596 | 0.34666 | 0.23010 | 0.33150 | 0.38501 | 0.69968 | 1.00000 | | 0.1154 | 0.2970 | 0.0110 | 0.0974 | 0.0153 | 0.0044 | <.0001 | |
|
|
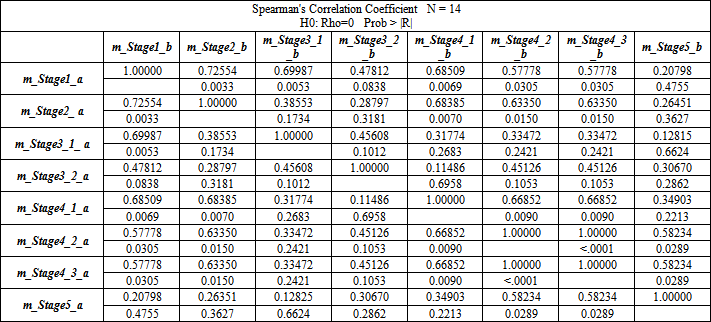
| Table 3. The Correlation Coefficient of between Stages on the Experienced – Half 2 |
| | Spearman's Correlation Coefficient N = 53H0: Rho=0 Prob > |R| | | | Stage1_b | Stage2_b | Stage3_1_b | Stage3_2_b | Stage4_1_b | Stage4_2_b | Stage4_3_b | Stage5_b | | Stage1_b | 1.00000 | 0.62077 | 0.28071 | 0.29309 | 0.31699 | 0.32406 | 0.29319 | 0.32282 | | | <.0001 | 0.0417 | 0.0332 | 0.0207 | 0.0179 | 0.0331 | 0.0184 | | Stage2_b | 0.62077 | 1.00000 | 0.55815 | 0.52639 | 0.43301 | 0.52904 | 0.50083 | 0.51802 | | <.0001 | | <.0001 | <.0001 | 0.0012 | <.0001 | 0.0001 | <.0001 | | Stage3_1_b | 0.28071 | 0.55815 | 1.00000 | 0.57648 | 0.30689 | 0.52517 | 0.61107 | 0.45811 | | 0.0417 | <.0001 | | <.0001 | 0.0254 | <.0001 | <.0001 | 0.0006 | | Stage3_2_b | 0.29309 | 0.52639 | 0.57648 | 1.00000 | 0.25617 | 0.46703 | 0.51624 | 0.40918 | | 0.0332 | <.0001 | <.0001 | | 0.0641 | 0.0004 | <.0001 | 0.0023 | | Stage4_1_b | 0.31699 | 0.43301 | 0.30689 | 0.25617 | 1.00000 | 0.56137 | 0.38022 | 0.42402 | | 0.0207 | 0.0012 | 0.0254 | 0.0641 | | <.0001 | 0.0050 | 0.0016 | | Stage4_2_b | 0.32406 | 0.52904 | 0.52517 | 0.46703 | 0.56137 | 1.00000 | 0.68388 | 0.65468 | | 0.0179 | <.o0001 | <.0001 | 0.0004 | <.0001 | | <.0001 | <.0001 | | Stage4_3_b | 0.29319 | 0.50083 | 0.61107 | 0.51624 | 0.38022 | 0.68388 | 1.00000 | 0.79349 | | 0.0331 | 0.0001 | <.0001 | <.0001 | 0.0050 | <.0001 | | <.0001 | | Stage5_b | 0.32282 | 0.51802 | 0.45811 | 0.40918 | 0.42402 | 0.65468 | 0.79349 | 1.00000 | | 0.0184 | <.0001 | 0.0006 | 0.0023 | 0.0016 | <.0001 | <.0001 | |
|
|
Table 4. The Correlation Coefficient of between Stages on the Novice – Half 1
 |
| |
|
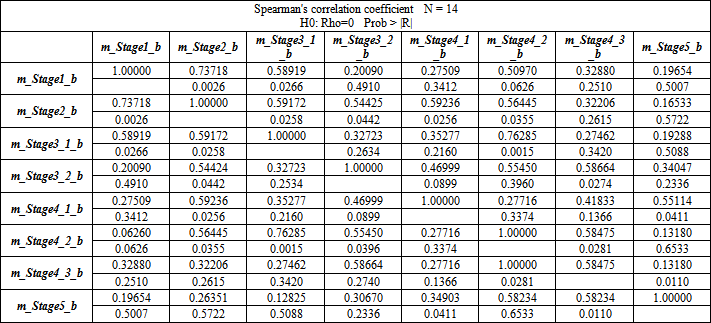
Table 5. The Correlation Coefficient of between Stages on the Novice – Half 2
 |
| |
|
Moreover, in the stage 2 and the stage 3 of the half 1 and the half 2, the correlation coefficients calculated are r=0.415(p<0.001) and r=0. 558(p<0.001) respectively.We can also confirm that these values are approximated. As a result of calculating the correlation coefficient on the subsequent stages by the same ways, we can obtain the consistency of the correlation coefficient in all stages. On the novice, although the significance levels are partly high because the sample data is not enough reach to the number, we can found the high approximate value between stages like the experienced (see Table 4 and Table 5). From these results, since there is a high consistency of the question items and the sample data obtained from the questionnaire, we can judge that the reliability of the concerned data is very high.
3.3. Validity Analysis of the Strategic e-CRM Model
Since we can confirm the reliability of data obtained from the questionnaire survey by the analysis of verifying the reliability, we can verify the effectiveness of the strategic e-CRM model to be considered with these data by the nomolgical validity analysis which belongs to the construct validity. We expect that a higher correlation between factors forming the strategic e-CRM model exists in both of the experienced and the novice. Because the strategic e-CRM model proposed in this paper line up the 3 factors which are stage, phase and relationship strength, we check up the correlationship from these three sides. For verifying the correlation between stages of the strategic e-CRM model on the experienced and the novice, we calculate the coefficient by the spearman`s rank order correlation method.
3.3.1. Correlation between Each Stage in the Experienced and the Novice
The significant correlation coefficient r=0.534(p<0.001) is obtained as a result of calculating the relation between the stage 1 and the stage 2 of the experienced (see Table 6). Moreover, between the stage 1 and the stage 2 in the novice a high correlation coefficient, r=0.736 (p<0.001) is obtained (see Table 7). In the correlation between the next stages, we get each significant correlation coefficient, r= 0.446,r=0.523,r=0.636 on the experienced and r=0.471,r=0.566,r=0.574 on the novice with significance level 1 percent. Comparing with these correlation coefficients between stages on the experienced and the novice, the novice shows a higher correlation coefficient than the experienced in the correlation between the stage 1 and the stage 2.Giving the most basic reason why the experienced shows a low correlation coefficient, the experienced conceives that a company receives the e-customer needs but does not supply even if the e-customer actually demands. In the case of the novice, we can consider that a high coefficient is figured out because the novice has not actually experienced. Furthermore, using the index of the e-customer segmentation suggested by Ko et al.[3], we select the top 20 percent of the experienced and compare the relations between stages with the 80 percent experienced. However, in this questionnaire survey we cannot obtain the significant results because of insufficient data concerning the top 20 percent experienced. Instead, calculating the average and stand deviation of response on the stage 1 and the stage 2 from respondents in the case of the 80 percent experienced (n=85), we can get M=3.33,SD=0.84 in the stage 1 and M=3.59,SD=0.82 in the stage 2. In the case of the top 20 percent experienced (n=21), we can get results as M= 3.61,SD= 0.86 and M=3.90,SD=0.83. From these results, we can deduce that because the top 20 percent experienced have the positive understanding and the high VIP attitude, they have a tendency to have the high expectation for a company to deal well with their demands.
3.3.2. Relation between Each Stage and Phase in the Experienced and the Novice
Next, we compare and check up the relation between each stage and phase on the experienced and the novice. In the question item group of the questionnaire survey carried out at this time, the quest ion items for grasping the relation between a stage and a phase are arranged. Therefore, by totaling three responses (3. Think so, 4. Think so much, 5. Think so very much), we can calculate the relation between a stage and a phase, and then the results are shown in Figure 3 and Figure 4.Regarding the relation between the stage 1 and the phase 1, 87.7 percent respondents of the experienced and 89.3 percent respondents of the novice show the positive result on the correlation concerned. And regarding the relation between the stage 2 and the phase 2, the experienced who answered 〝yes〞 on the question of the phase 2 is 89 percent, and the novice is 88.5 percent of respondents who show the positive response in the stage 2. | Table 6. The Correlation Coefficient of each Stage in the Experienced |
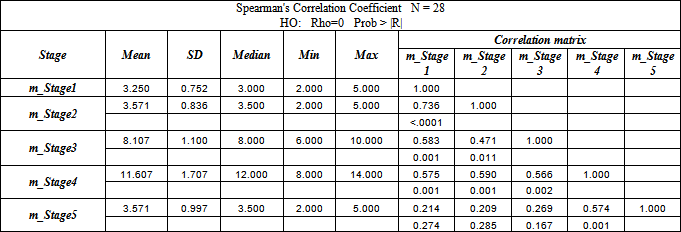
| | Spearman's Correlation Coefficient N = 106H0: Rho=0 Prob > |R| | | Stage | Mean | SD | Median | Min | Max | Correlation Matrix | | Stage1 | Stage2 | Stage3 | Stage4 | Stage5 | | Stage1 | 3.387 | 0.846 | 3.000 | 2.000 | 5.000 | 1.000 | | | | | | Stage2 | 3.651 | 0.829 | 4.000 | 2.000 | 5.000 | 0.534 | 1.000 | | | | | | | | | | <.0001 | | | | | | Stage3 | 8.425 | 1.387 | 8.500 | 4.000 | 10.000 | 0.189 | 0.446 | 1.000 | | | | | | | | | 0.053 | <.0001 | | | | | Stage4 | 11.472 | 1.987 | 11.500 | 6.000 | 15.000 | 0.402 | 0.530 | 0.523 | 1.000 | | | | | | | | <.0001 | <.0001 | <.0001 | | | | Stage5 | 3.509 | 0.959 | 3.000 | 1.000 | 5.000 | 0.273 | 0.334 | 0.298 | 0.636 | 1.000 | | | | | | | 0.005 | 0.001 | 0.002 | <.0001 | |
|
|
Table 7. Correlation Coefficient of each Stage in the Novice
 |
| |
|
As a result of checking the relationship between the stage and the phase like this way, 84 percent - 92.5 percent respondents of the experienced and 82.9 percent - 96.4 percent of the novice show the positive response, and we can confirm the high relationship between the stage and the phase.
3.3.3. Relation between Each Phase and the Relationship Strength in the Experienced and the Novice
Subsequently we check the relation between the phase and the relationship strength. On this verification, we deduce in the same way as checking the relation between the stage and the phase. The respondents of the experienced show that the positive response is 87.7 percent and the novice is 89.3 percent on the relation between the phase 1 and the relationship strength (see Fig. 2 and Fig. 3). Since the question that measures the relation between the phase 1 and relationship strength uses the same one that measures the relation between the stage 1 and the phase 1, the result concerning the relation between the phase 1 and the relationship strength is the very same to the relation between the stage 1 and the phase 1. On the relation between the phase 2 and the relationship strength, the experienced and the novice both show 80 percent as results of the high relationship strength. Finally, on the relation between the phase 3 and the relationship strength, we can find the highest results among the relations between the phases and the relationship strength. Especially, the experienced show the high value of 98.1 percent in the stage 4 and the stage 5. Similarly, in the stage 4 and the stage 5, we can get the high results of 96.4 percent in the novice. Consequently, we can judge that the relations between the phase 3 and the relationship strength are very strong.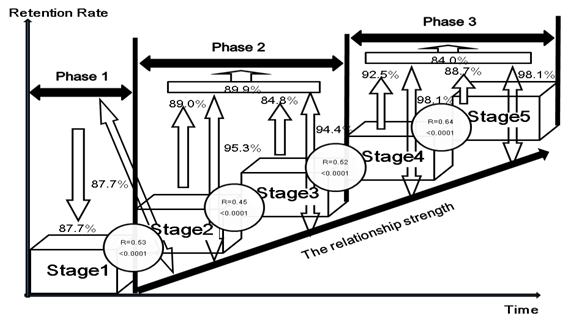 | Figure 2. The relations diagram of stages, phases and the relationship strength in the experienced |
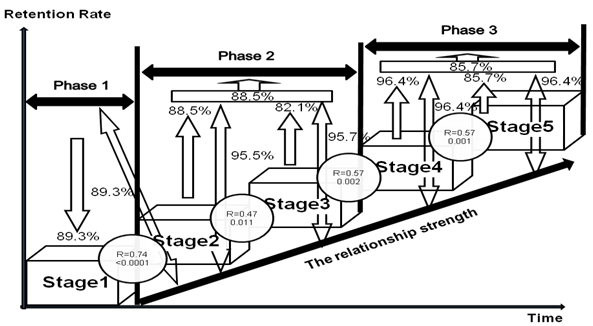 | Figure 3. The relations diagram of stages, phases and the relationship strength in the novice |
Judging from these results, the relation between the stage 1, phase 1 and the relationship strength are strong. In other words, conveying e-customer's needs and wants to a company shows the trust relation between the e-customer and the company. And we can consider that coping with the e-customer who has taken convey action with the sincere attitude is connected with the shift to the stage 2. From the high correlation between the stage 2 and 3, the phase 3 and the relationship strength to be proven from the analysis results, we can explain that it is connected with the achievement of the e-customer commitment. That is, we can say that it is the result that the company copes positively with offering the personalized items to the e-customer as the e-customer who trusts the company join the learning process voluntarily in the stage 2. Furthermore, from the correlations between the stage 3 and the stage 4, between the stage 4, 5, the phase 3 and the relationship strength which can be judged that each correlation between the concerned factors are strong, we can find that the e-customer to be deeply committed in the achievement stage (the stage 3) has a high tendency to convey a new demands, and then as his/her new needs and wants are repeatedly satisfied, the relationship with the company becomes stronger. Then, viewing from the company's respects, it shows the situation that the relation with the e-customer is retained. Moreover, we can judge that the e-customer who is in the situation makes the repeat and bring the buzz effects because the e-customer commitment is going to generate the strong relation with the company.
3.3.4. The Causality Analysis in the between Stages of e-CRM model
From these analysis results, we can confirm that the validity on the strategic e-CRM model considered is verified. However, to make the verification of the validity on the strategic e-CRM model the firmer one, we need to do the causality analysis in the between stages of e-marketing model with path analysis. Making clear the causal relationship, the hypothesis of the event to be analyzed is needed. In chapter 2, Ko et al.[4] proposed the hypothesis on the strategic e-CRM model. Besides, in the path analysis there are the goodness of fit index (GFI) and root mean square error of approximation (RMSEA) as the index of goodness of fit on the strategic e-CRM model. Therefore, we can draw a decision that the strategic e-CRM model considered has a high ratio of fitness if GFI is over 0.7 and RMSEA is below 0.5. When carrying out the path analysis with the using the statistical analysis software, it is general to use REG procedure which calculates the causal coefficient by the multiple regression analysis. For the strategic e-CRM model, we perform the covariance structure analysis by the CALIS procedure because we need the GFI of the path analysis model by path coefficient with higher accuracy to explicate the causal relation validity between stages. We verify whether there is causal relation between each stage of the strategic e- CRM model by this analysis. For a kickoff, we perform the path analysis with the questionnaire survey data of the experienced and verify whether there are causal relations between each stage of the experienced. We calculate the path coefficient to measure the causal relations between indicator variables of the experienced (see Fig. 4). The GFI of the path analysis model considered is 0.996 and RMSEA=0.0000 as the calculated results and it shows a high relevance ratio. Next, on calculating and checking the causal coefficient between each stage we can find that the results with having the causal relations are come out in the between all stages. Especially, among others, the relation between the stage 4 and the stage 5 shows the high causal relation coefficient of 0.63.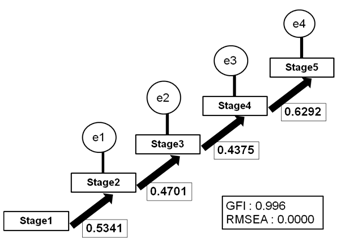 | Figure 4. Path analysis model for the experienced |
Secondly, we perform the path analysis on the novice. As shown in Fig. 5, the model relevance ratio is GFI=0.958, RMSEA=0.0347 in the path analysis of the novice. It shows the high relevance ratio as well as the experienced. Furthermore, for the causal relation between stages, the causal coefficient between the stage 1 and the stage 2 is 0.70, and we can recognize that the causal relation is strong. For the other between stages, we can also find out that the causal coefficients with conforming the causal relations between stages are come out as the results.Consequently, high causal relations are able to be confirmed in both path charts as a result of analyzing the causal analysis between stages on the experienced and the novice. We performed the verification of the reliability on the questionnaire survey data and the validity on the strategic e-CRM model with four analysis techniques. In conclusion, we can judge that the strategic e-CRM model proposed can be practically utilized in real world. 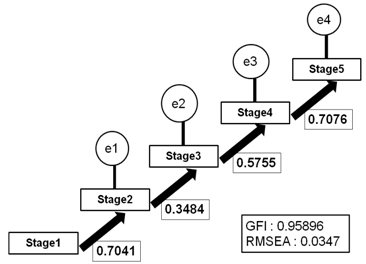 | Figure 5. Path analysis model for the novice |
4. Conclusions
As the advent of the internet shopping site passed away ten years, various commodities keep overflowing on the Internet, and the commoditization and the competition between companies keep on intensifying. In these situations, if a company grasps e-customer’s needs and wants and can build up the good relationship with the e-customer, we can expect that the company can get the strong competitive advantages. Ko et al.[3] insisted that the ceaseless communications are needed for keeping the relationship with the most excellent customer on e-business. Besides, we previously made it clear that e-mail is a tool with high cost-effectiveness for communicating with a customer on the online. In the internet questionnaire survey carried out at this time, the 88.7 percent experienced answered that it is e-mail when inquired of the experienced “Which is the most to use as the tool of forwarding your desires to a company?”. Hence, we can judge that e-mail is the communication tool with excellent cost-effectiveness, and the needs of e-consumer’s use are high. However, e-mail is not showing its own essential merit due to utilize for aiming at the e-customer acquisition. Thus, we reconsider that the use of e-mail must be reviewed from the customer acquisition to customer retention. Based on this consideration, we conduct the concerned questionnaire survey, and perform the verification through the validity analysis for making clear the effectiveness of the strategic e-CRM model. By analyzing the data obtained from this questionnaire survey, we can get the valid results to verify the effectiveness of the e-marketing model. So, we believe that this e-CRM model is applicable to the real world, not theoretical, as the e-business marketing strategy model. Nevertheless, there is a doubt on this reliability because the results are based on the statistics of the very few novice respondents in this analysis. To resolve this uncertainty, we need to show the analysis results based on enough data for verifying the validity. Finally, we do not consider the side-effects of this model. Unfortunately, there are few reference papers concerning e-marketing model. But, we think that this strategic e-CRM model is very practical and useful in online business. Therefore, we believe that our paper offer a wide research area on the study of serviceable e-business marketing model in the future. Based on this model, we developed the seven steps of e-customer behavior process model and the pattern model of an e-customer purchasing behavior. Also, we verified the validity of these models.
References
| [1] | F. Robert Dwyer, Paul H. Schurr and Sejo Oh, “Developing Buyer-Seller Relationships”, Journal of Marketing, Vol. 51, No.2, pp. 11-27, 1987. |
| [2] | Glen Urban, “Don`t Just Relate-Advocate”, Wharton School Publishing, 2005. |
| [3] | Hong Seung Ko et al. “A Strategic Royal Marketing Model on e-Business as a new generation marketing model”,Journal of NAIS Vol.1, No.1,pp.70-77, 2005. |
| [4] | Hong Seung Ko et al. “The Strategic e-Customer Relationship Marketing Model for retaining customers on online”,Journal of NAIS Vol.7, No.1,pp.37-45, 2012. |
| [5] | Jon, Anton. Laurent, Philonnenko. and Steve, Morrell. NEW Edition 20:20 CRM – A visionary insight into unique customer contacts. The Anton Press, Pp. 48-56, 2007. |
| [6] | Mikiyoshi Aoki, “The Concept of Empowerment in Management”, Management information science, Vol.12, pp.1-20, 2000. |
| [7] | Peter F. Drucker, “Managing in the next society”, Griffin, 2002. |
| [8] | Philip Kotler, “Marketing Manage- ment: Millennium Edition, Tenth E-dition”, Prentice-Hall, Inc, 1999. |
| [9] | Philip Kotler, Tomas Hayes and Paul, N. Bloom, “Marketing Professional Services, Second Edition”, Prentice-Hal l, 2002. |
| [10] | Steve Morrell and Laurent Philonenko, Genesis Japan marketing division translation, “CRM Perfect Vision”, Ric Telecom, 2002. |
| [11] | The Radicati Group Inc,“Corporate Email Market- 2006-2010”, 2006. |
 Abstract
 Reference
 Full-Text PDF
 Full-Text HTML