-
Paper Information
- Next Paper
- Paper Submission
-
Journal Information
- About This Journal
- Editorial Board
- Current Issue
- Archive
- Author Guidelines
- Contact Us
Management
p-ISSN: 2162-9374 e-ISSN: 2162-8416
2012; 2(3): 49-58
doi: 10.5923/j.mm.20120203.01
A Study of Innovation Activities in Software and Computer Services Companies
 Abstract
 Reference
 Full-Text PDF
 Full-Text HTML
Álvaro Gómez Vieites 1, José Luis Calvo Gonzál 2
1Department of Information Technologies, NovacaixagaliciaBusinessSchool, Vigo, 36209, Spain
2Department of Economic Analysis I, UNED, Madrid, 28040, Spain
Correspondence to: Álvaro Gómez Vieites , Department of Information Technologies, NovacaixagaliciaBusinessSchool, Vigo, 36209, Spain.
| Email: |  |
Copyright © 2012 Scientific & Academic Publishing. All Rights Reserved.
This paper analyzes the results of a study of innovation activities in software and computing services companies. We propose a new model which takes into account the role played by several factors and firms’ resources in the development of innovative activities, exploring the relationships between a set of organizational, technological, financial and information-based resources, as well as other aspects such as cooperation with other agents and companies.We employ a Structural Equation Model and the PLS technique in order to validate the theoretical model proposed in this research. The data come from the Spanish National Statistics Institute’s Survey on Firms’ Technological Innovation, and the sample is composed by 823 observations referred to firms in the sector of software and computer services.The main results show that human resources (R&D and higher education personnel) is the most important factor that positively affects R+D activities, followed by financial resources (R&D expenses) and contingent factors (firm’s size and type of market). At the same time R&D activities, information management and technological resources have a positive effect on product and process innovation. Finally, R+D activities, innovation results and information management have a positive influence on business results.
Keywords: Innovation Activities, Innovation in Services, Software , Computer Services, R&D Investment, R&D Personnel, PLS, Structural Equation Model (SEM)
Article Outline
1. Theoretical Background
- Most studies on innovation activities have focused on industrial companies, with special attention to sectors intensive in R&D –especially pharmaceutical, chemistry, electronics, aerospace and automotive industries-. In this context, innovation in services had been limited to the use and dissemination of new technologies in these activities. However, given the growing importance of services sector in the economy of most developed countries, in recent years some authors have tried to study the particular characteristics of innovation in services ([1],[2],[3],[4]). The main results of these studies have revealed some interesting findings on innovation in business services activities[4]: first, systematic and formalized innovation is quite exceptional in this kind of companies; second, innovation is in most cases an interactive process that takes place through contacts and exchanges of information with clients and with suppliers; third, the most common type of innovation is small incremental innovation; and finally, due to all these characteristics it is very difficult to quantifyinnovation in services sector. On the other hand, we must bear in mind that R&Dactivities have a major role in some service sectors such as telecommunications, information technology or business services, and companies of these sectors are alsocharacterized by having an important proportion of highly qualified employees. Moreover, in many service activities such as consultancy or engineering we have to take into account the important role played by knowledge codification and systematization of its procedures, in order to improve customers’ service.Reference[4] distinguishes several patterns of innovation in service companies: a first pattern of innovation that occurs by way of incorporating new technologies, above all information and telecommunications technologies, which play a major role in financial services, telecommunications, and computer activities; a second type of innovation produced by interaction between suppliers and customers, at the time the service is produced, due to the simultaneous space-time between production and consumption that characterize a good part of the services.This paper focus on the study of innovation activities in software and computing services companies, analyzing the role of several factors and firms’ resources in thedevelopment of innovative activities, exploring the relationships between a set of organizational, technological, financial and information-based resources, as well as other aspects such as cooperation with other agents and companies. We aim to achieve a greater understanding of the relationships between these factors and what may be the most critical factors and resources to develop continuous and successful innovation activities within companies of these service sectors.
2. Empirical Evidence
- The justification for the different variables included in our model and their relationships are explained in the following paragraphs, taking into account the empirical evidence from other authors and previous studies.Contingent factors: Type of market and company’s sizeThe relationship between firm’s size and innovation has been studied by many researchers ([5],[6],[7],[8],[9],[10], among others), without having achieved a consensus.Thus, on one side a large group of authors note that firm’s size positively affects its innovativebehavior ([8],[11]). In contrast, other authors such as[7] or[12] support the existence of a negative relationship between size and innovation. It is argued that small firms detect discontinuous opportunities and transform them into new products and processes[13], and on the contrary, large firms have more economical and organizational resources facilitating innovations[14]. In this work we suggest that there is a positive relationship between size and R&D activities.Another contingent factor that has an important effect on firm innovativeness is the type of market. In fact, market competition incentives productivity[15] and fosters product innovations. Reference[16] stated that insulation from competitive pressure originates bureaucratic inefficiency that inhibits innovation. The growth of demand is another environmental factor affecting the firm innovativeness. In fact, some authors such as[17] found that growth of demand encourages both product and process innovations.Human resourcesMany authors, such as[18], stated that human andorganizational resources directly affect firms’ ability to innovate. Reference[11] studied the role of other organizational issues, such as centralization, specialization, formalization, while others authors focused on the development of human resources and its impact on firm’s innovativeness.In our proposed model we also try to specifically analyze the role of human resources. For doing so we consider two variables: number of personnel engaged in R&D activities, and percentage of employees with higher education.Financial resourcesOne of the most common indicators used to evaluate the commitment of an organization with the R&D is the level of expenditure dedicated to this activity ([19],[20],[21] and many others).Given this background, the proposed model also includes the role of financial resources to support R&D in the company.Cooperation with other agentsSince innovation is essentially conceived as an interactive learning process, many authors like Reference[22] argue that collaborative activities between different agents of a National Innovation System have a great importance to achieve economies of scale, avoiding duplication of efforts and promoting the dissemination of the results of innovation. Other studies have shown that cooperation in R&D usually bring significant benefits to companies ([22], [23],[24]).More recently, the open innovation approach stresses that firms have changed from the close-innovation process to a more open innovation process, in which the knowledge and technology flows are twofold: inside-out and outside-in[25]. According to[26], the open innovation is the combination of internal and external ideas and technologies in order to achieve new products, processes and technologies and reduce time to market.Therefore, taking into account the theoretical framework and the previous references, in our work we also consider the importance of cooperation between the company and other actors in explaining its ability to develop R&D. Technological and organizational resourcesFollowing the initial approach of[18] and other authors such as[27], and taking into account the methodology proposed by the Oslo Manual, we also include in our model three variables related to technological and organizational resources available at the company, as key factors in explaining its innovative capacity: the acquisition of new technological equipment to support innovation, and the production and marketing preparations for innovation.Information and knowledge managementIn a global, complex and very dynamic economy, companies must pay much more attention to a growing number of information sources in other to be prepared for changing conditions in markets, launch of new products and technologies and an increasing competence all over the world.Reference[28] suggests that innovation should be seen as an interactive process in which a company acquiresknowledge through its own experience in the design, development, production and marketing of new products, constantly learning from its relationships with various external sources: customers, suppliers and other organizations such as universities, technological institutes, consultants, etc.Other authors such as[6] include in their analysis the role played by information management to carry out innovations, distinguishing between internal and external sources (customers, suppliers, scientific and technological studies, market surveys, etc.).Considering all these previous references and theoretical background, we introduce in our model the role of information management as an element that could be of particular importance in the innovative behavior of the company. This is done using four variables related to the use of different sources of information: internal sources, sources related to the market, institutional sources (Universities, etc.), and other sources of information.R&D activitiesGiven the framework of the Frascati Manual and the Oslo Manual, R&D activities are included within the list of activities that are necessary for technological innovation.Moreover, the interactive model proposed by[31] considers R&D activities as a tool that can be used to solve problems occurring during the processes of innovation, being able to enter the process at any phase.Therefore, our model includes the role played by R&D activities as a key factor that can contribute positively to the success in obtaining innovation, but R&D is not a requirement or prerequisite for success in innovation process, as it was suggested in the linear model of innovation. In our work we also analyze the direct impact R&D activities can have in business results, as these activities could contribute to the achievement of radical innovations that provide greater competitive advantage ([9],[32],[33],[34],[35],[36]).The construct included in our model to take into account the role of R&D is defined by two variables: internal R&D and external R&D. Some empirical evidence found that internal R&D produces better results than external R&D. For example, reference[37] found that internal R&D had positive effects on incremental innovations (utility models), while external R&D had positive effects on both incremental and radical innovations (patents). Reference[38] observed positive effects of external and internal R&D on new product development, although, the effects were higher for the internal R&D.Innovations resultsOur model includes a construct devoted to innovations results, distinguishing between product and processinnovations. This element depends not only on the R&D activities carried out by the company, but also on other factors related to the technological and organizational resources of the company or the information management.Furthermore, in accordance with the contributions ofmajor authors who have analyzed the processes of innovation, it is considered that these innovations have a positive impact on business performance ([6],[9],[30],[39],[40],[41],[42], [43],[44]).Business PerformanceSome studies have measured the effect of R&D and innovation on business performance measured as a Likert scale of global firm performance[45], some others as firm’s ROA, others as the sales obtained by new products[46], or as the patents obtained by the company ([19],[47],[32],[33]).In the model proposed in our article business performance is determined using five indicators: share of sales obtained by new products, patents granted to the company, positive effects on products, positive effects on processes and other positive effects on the company.
3. Description of the Proposed Model
- The model we propose in this study defines four constructs –latent variables build up from observed variables– affecting R&D activities: contingent factors, obtained from the observed variables type of market (MDO2) and firm’s size (TAMANO2); human resources, achieved using two variables: R&D personnel (PIDT2) and higher education personnel (REMUSUP2); financial resources, approached by R&D expenses (GTID2); and cooperation, with one variable to study cooperation with other companies (COOPERA).“R&D activities” construct is attained using two variables: internal R&D (IDINTERN) and external R&D activities (IDEX). They affect innovation results as good as firm’s performance.“Innovation results” is another latent variable obtained from two experiential variables: product innovation(INNPROD) and process innovation (INNPROC2). It depends on four constructs: contingent factors, R&D activities,information management and technological and organizational resources. This last latent variable, technological and organizational resources, is built up using three observed variables: acquisition of technology and new equipment (GMAQUI3), production preparations for innovation (GPREP3) and marketing preparations for innovation (GMARKET3).“Information management” is a new latent variable achieved from four variables that represent four different sources of information: internal sources (FUENTES_1), sources related to the market (FUENTES_M), institutional sources (FUENTES_I) and other sources of information (FUENTES_O).Finally, firms’ performance is the last construct, defined as a latent variable obtained from five observed variables: income obtained from new products (NEWEMP2), patents granted to the company (PAT2), effects on products (EFECTO_PROD), effects on processes (EFECTO_PROC) and other positive effects (EFECTO_OTRO). We assume that firm’s performance can be explained by R&D activities, innovation results and information management constructs.The most distinguishing feature of the model is versatility, breaking the linear structure estimation of the relationship between R&D, innovation and business performance. In our model there is a more flexible design, as is represented in the following two figures:
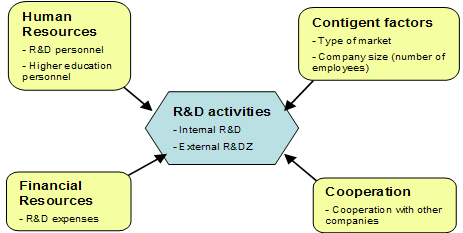 | Figure 1. Model proposed by the authors – part I |
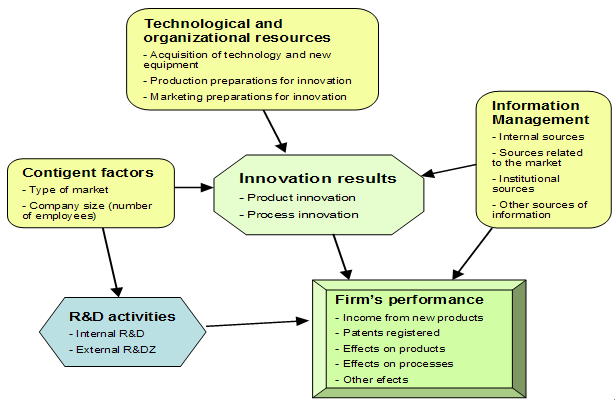 | Figure 2. Model proposed by the authors – part II |
4. Data and Methodological Aspects
- The sample used in our study to test and validate our model was taken from the Technological Innovation Panel (PITEC), a statistical instrument for studying the innovation activities of Spanish firms over time. The data base is being carried out by the INE (The National Statistics Institute), and it is obtained from the Spanish National Survey on Firm’s Technological Innovation. Begun in 2004, the final aim of this project is to improve the statistical information available on firms’ innovation activities, and the conditions for scientific research on said topic.In our study we used data from the year 2007 survey, with a total number of 823 valid samples from companies in the software and computer services sectors (taking into account the whole data of companies included in the year 2007 Spanish National Survey on Firm’s Technological Innovation, we filtered all the valid data from companies in the software and computer services sectors, according to their SIC code).The following table presents the distribution of the sample by firm’s size:
|
5. Empirical Outcome of the Study
- As we have said, we employ PLS technique to estimate the proposed Structural Equations Model.First, we present regression weights and factorial loads for different constructs, since in order to evaluate the model we need to employ loads for reflective indicators and weights for formative variables:
|
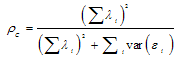 should be bigger than 0.7, where λi is the standardized load of i indicator and εi is measurement error. In our case the value obtained for every reflective indicator is equal to 1.1. Convergent validity. In this case we use average variance extracted (AVE) proposed by[49], and according to these authors the value of the expression:
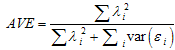 should be bigger than 0.5, since more of 50% of construct variance should be explained by its variables. In our study both reflective indicators fulfill this criterion.
|
|
|
| |||||||||||||||||||||||||||||||||||||||||||||||||||||||||||||||||||||||||||||||||||||||||||
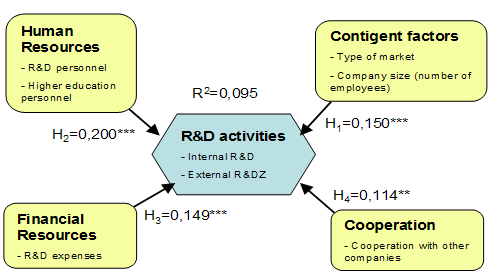 | Figure 3. Main results of the study – Part I |
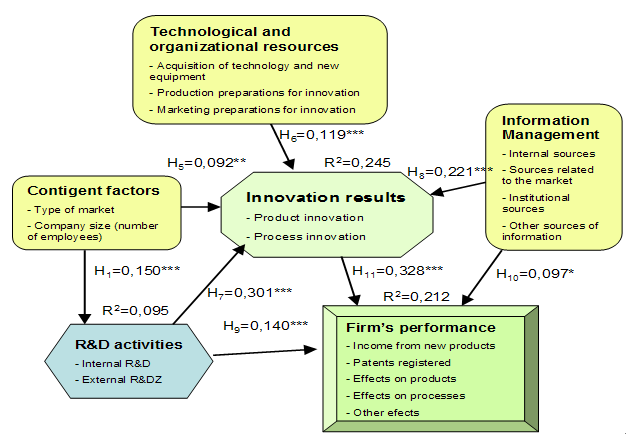 | Figure 4. Main results of the study – Part II |
6. Conclusions
- In this article we have proposed a model to analyze innovative behavior and the role of several factors that can have an influence on firms’ innovativeness in software and computer services companies. Its main characteristics is versatility, since it is possible to model flexible relationships between different elements affecting R&D, innovation results and its effects on business performance, applying Structural Equations Models and PLS techniques.By means of a Structural Equations Model it is possible to combine predictive techniques of classical econometric multiple regression (examining dependence relationships between variables) with the psychometric approach, based on the measurement of latent variables (not directly observed) through multiple variables observed (indicators), using a factor analysis technique in this second case. At the same time, PLS is considered as a second generation multivariate analysis technique, which is particularly appropriate for research projects in the field of business administration.When it is applied to software and computing services companies, our model explains how several factors (human resources, financial resources, contingent factors and cooperation with other firms) affect the development of R&D activities; how those R&D activities, information management and technological resources influence innovation results (both product and process innovation); and the way R&D activities together with innovation results and information management can help to improve business performance.The results confirm the validity of our theoretical proposal, both the model of measure and structural model. We have reached satisfactory outcomes, fulfilling PLS requirements, using a sample of 823companies in the sector of software and computer services.In the same way, when we evaluate R&D activities in these companies we have been able to reveal that the most important factoris human resources, both R&D personnel and higher education personnel, followed by financial resources (R&D expenses). This result confirms the growing importance of highly qualified employees in companies of this sector.In other words, R&D in Spain, or more exactly its low level, is not only an economic problem but the small number of people dedicated to this activity in our firms. This is probably the consequence of the lack of an entrepreneurial research culture.In reference to firms’ innovation (product and process), we have proved that R&D activities, information management (and above all, internal information) and technological resources are the most relevant factors.Finally, we have shown that R&D activities, innovation results and information management have a very positive contribution to firm’s economic performance.We can conclude that Spanish companies of these service sectors (software and computer services) have to concentrate their efforts on human resources management, R&D expenses, technology acquisition and information management in order to improve their innovativeness and, as a direct consequence of this, their business performance.So, if we sum up a lack of entrepreneurial innovation culture in Spanish companies and the relevance of R&D in firm’s economic results we can conclude that it is compulsory a new way to focus industrial policy in our country and in every sector of our economy, oriented to beat this deficient interest in technological developments and concentrate the efforts in R&D and innovation, and to increase the number of highly qualified employees and R&D personnel in our companies, not only in the software and computer services, but also in the main sectors of our economy.
Note
- IIThe model had to be split into two figures due to the lack of space in the paper to include only one figure with all the elements proposed in the model.
References
| [1] | J. Sundbo, F. Gallouj, “Innovation as a Loosely Coupled System in Services”, in I. Miles and J. S. Metcalfe (eds), Innovation Systems in the Service Economy, Kluwer Academic Publisher, London, 2000. |
| [2] | I. Miles, R. Coombs, “Innovation, Measurement and Services: The New Problematique”, in J. S. Metcalfe and I. Miles (eds.), Innovation systems in the service economy: measurement and case study analysis, Kluwer Academic Publishers, London, 2000. |
| [3] | B. Tether, “The sources and aims of innovation in services: variety between and within sectors”, CRIC Discussion Paper, nº 55, 2002. |
| [4] | X. Vence, M. González López, “Los servicios y la innovación. La nueva frontera regional de Europa”. Economía Industrial, n 347, p. 41-66, 2002. |
| [5] | E. Mansfield, “Composition of R&D expenditures, relationship to size of firm, concentration and innovative output”. Review of Economics and Statistics, vol. 63, p. 610-615, 1981. |
| [6] | K. Pavitt, “Sectorial patterns of technical change: towards a taxonomy and a theory”. Research Policy, vol. 13, n. 6, p. 343-373, 1984. |
| [7] | D. B. Audretsch, Z. J. Acs, “Innovation, Market Structure and Firm Size”, Review of Economics and Statistics, 69(4), p. 567-575, 1987. |
| [8] | M. K. Moch, E. V. Morse “Size, centralization and organizational adoption of innovations”. American Sociological Review, nº 42, p. 716-725, 1997. |
| [9] | M. Buesa, J. Molero, “Tamaño empresarial e innovación tecnológica en la economía española”. ICE Tribuna de Economía, 773, p. 155-173, 1998. |
| [10] | J. L. Calvo, “Una caracterización de la innovación tecnológica en los sectores manufactureros españoles: Algunos datos”. Economía Industrial, n. 331, p. 139-150, 2000. |
| [11] | R. D. Dewar, J. E. Dutton, “The adoption of radical and incremental innovations: An empirical analysis”. Management Science, 32 (11), p. 1422-1433, 1986. |
| [12] | L. B. Mohr, “Determinants of innovation in organizations”. American Political Science Review 63, p. 111-126, 1969. |
| [13] | J. M. Utterback, Mastering the Dynamics of Innovation. Harvard Business School Press, Boston, 1994. |
| [14] | A. Afuah, “Dynamic boundaries of the firm: Are firms better off being vertically integrated in the face of a technological change?”. Academy of Management Journal, 44 (6), p. 1211-1228, 2001. |
| [15] | J. S. Metcalfe, “Innovation, competition, and enterprise: Foundations on economic evolution in learning economies, in J. Hage and M. Meeus (eds.) Innovation, Science, and Institutional Change: A Research Handbook, p. 105-121, 2006. |
| [16] | F. M. Scherer, Industrial market structure and economic performance. Ran McNally, Chicago, 1980. |
| [17] | M. Kotable, “Corporate product policy and innovation behavior of European and Japanese multinationals: An empirical investigation”. Journal of Marketing, 54, p. 19-33, 1990. |
| [18] | R. F. Hurley, G. T. Hult, “Innovation, Market Orientation and Organization Learning: An Integration and Empirical Examination”. Journal of Marketing, vol. 62, p. 42-54, 1998. |
| [19] | Z. Griliches, “Issues in Assessing the Contribution of R&D to Productivity Growth”, Bell Journal of Economics, 10 (Spring), p. 92-116, 1979. |
| [20] | Z. Griliches, “R&D and Productivity: Econometric results and Measurement issues”, in P. Stoneman, Handbook of the Economics of Innovation and Technological Change, Oxford, Blackwell, 1995. |
| [21] | J. L. Calvo, “¿Son las actividades de I+D una buena aproximación a la Innovación Tecnológica?”. Economía Industrial. n. 358, p. 173-184, 2006. |
| [22] | R. Narula, J. Dunning, “Explaining International R&D Alliances and the Role of Governments, MERIT Working Paper Series 97-011, 1997. |
| [23] | J. Hagedoorn, “Understanding the rationale of strategic technology partnering: interorganizational modes of cooperation and sectorial differences”, Strategic Management Journal, vol. 14, p. 371-385, 1993. |
| [24] | J. Hagedoorn, R. Narula “Choosing organizational modes of strategic technology partnering: interorganizational modes of cooperation and sectorial differences”, Strategic Management Journal, 14, 1996. |
| [25] | H. Chesbrough, Open Innovation: The New Imperative for Creating and Profiting from Technology. Harvard Business School Press, 2003. |
| [26] | E. Enkel, O. Gassman, H. Chesbrough, “Open R&D and open innovation: exploring the phenomenon”. R&D Management, 39 (4), p. 311-316, 2009. |
| [27] | E. Arnold, B. Thuriaux, Developing Firms’ Technological Capabilities. Report for the OECD, Brighton, Technopolis, 1997. |
| [28] | C. Freeman, “The economics of technical change” in D. Archibugi,, J. Michie (eds.), Trade, Growth and Technical Change, Cambridge University Press, 1998. |
| [29] | OECD, Frascati Manual, Proposed Standard Practice for Survey of Research and Experimental Development. The Measurement of Scientific and Technological Activities Series. Paris, 2002. |
| [30] | OECD & EUROSTAT (2005): Oslo Manual, Guidelines for Collecting and Interpreting Innovation Data, The measurement of Scientific and Technological Activities, Third Edition. A joint publication of OECD and EUROSTAT. Paris. |
| [31] | S. J. Kline, N. Rosenberg, “An overview of innovation”, in R. Landau, N. Rosenberg (eds.), The positive sum strategy, Harnessing Technology for Economic Growth, p. 275-305, Washington, D.C., 1986. |
| [32] | E. Mansfield, M. Schwartz, S. Wagner, “Imitation costs and patents: an empirical study”, The Economic Journal, vol. 91, p. 907-918, 1981. |
| [33] | E. Mansfield, “Patents and innovations: An empirical study”, Management Science, vol. 32, n. 2, p. 173-181, 1986. |
| [34] | J. C. Narver, S. F. Slater, “The effect of a market orientation on business profitability”. Journal of Marketing, october, 1990. |
| [35] | T. C. Powell, “Total quality management as competitive advantage: a review and empirical study”. Strategy Management Journal, vol. 16, p. 15-37, 1995. |
| [36] | Z. J. Acs, L. Anselin, A. Varga., “Patents and innovations counts as measures of regional production of new knowledge”. Research Policy, vol. 31, p. 1069-1085, 2002. |
| [37] | P. Beneito, “The innovative performance of in-house and contracted R&D in terms of patents and utility models”. Research Policy, 35 (4), p. 502-537, 2006. |
| [38] | Y. Chen, Y. Yuan, “The innovation strategy of firms: empirical evidence from the Chinese high-tech industry”. Journal of Technology Management in China, 2 (2), p. 145-153, 2007. |
| [39] | J. A. Schumpeter, The Theory of Economic Development, Harvard University Press, Cambridge, Massachusetts, 1934. |
| [40] | C. Freeman, Teoría Económica de la Innovación Industrial, Alianza Editorial, Madrid, 1975. |
| [41] | C. Freeman, The Economics of Industrial Innovation, 2ª ed., Frances Printer, London, 1982. |
| [42] | R. R. Nelson, S. G. Winter, “Search of a Useful Theory of Innovation”. Research Policy, vol. 6, nº 1, p. 36-77, 1977. |
| [43] | G. Dosi, C. Freeman, R. R. Nelson, G. Silverberg, L. Soete, Technology Change and Economic Theory, Pinter Publishers, London, 1988. |
| [44] | B. Arthur, Increasing Returns and Path Dependence in the Economy. University of Michigan Press, 1994. |
| [45] | A. Lanctot, S. K. Swan, “Technology adquisition strategy in an internationally competitive environment”. Journal of International Management, 6 (3), p. 187–215, 2000. |
| [46] | R. Veugelers, B. Cassiman, “In search of complementarity in innovation strategy: Internal R&D and external knowledge acquisition”. Management Science, 52 (1), p. 68-82, 2006. |
| [47] | Z. Griliches, “Patent statistics as economic indicators: a survey”, Journal of Economic Literature, vol. XXVIII, p. 1661-1707, 1990. |
| [48] | J. Hair, R, Anderson, R. Tatham, W. Black, Multivariate Data Analysis, Prentice Hall International, 1998. |
| [49] | C. Fornell, D. F. Larcker, “Evaluating Structural Equation Models with Unobservable Variables and Measurement Error”, Journal of Marketing Research, 18, p. 39-50, 1981. |
| [50] | R. F. Falk, N. B. Miller, A Primer for Soft Modelling. Akron, Ohio: The University of Akron, 1992. |
| [51] | W. W. Chin, “The Partial Least Squares Approach to Structural Equation Modelling”, in G. A. Marcoulides[ed.]: Modern Methods for Business Research, p. 295-336. Mahwah, NJ: Lawrence Erlbaum Associates, Publisher, 1998. |
| [52] | A. Gómez Vieites, “Estudio de los factores que inciden en el desarrollo de las actividades de I+D+I y de su impacto en los resultados empresariales. Aplicación a lasempresasmanufacturerasespañolas”. Doctoral Thesis. UNED, 2009. |