Nwosu J. I., Amadi K.
Department of Geology, University of Port Harcourt, Nigeria
Correspondence to: Nwosu J. I., Department of Geology, University of Port Harcourt, Nigeria.
| Email: |  |
Copyright © 2022 The Author(s). Published by Scientific & Academic Publishing.
This work is licensed under the Creative Commons Attribution International License (CC BY).
http://creativecommons.org/licenses/by/4.0/

Abstract
Hole deviation from the designed trajectory gives a false thickness of ore bodies. Consequently the reserve of a mineral deposit estimated based on this false thickness is liable to differ from the true reserve of the deposit. There is therefore the need to estimate the level of reliability of ore reserve based on deviation angles during exploration. In this research, geometrical modelling of ore bodies of a mineral deposit has been used to estimate the true and false reserve of a mineral deposit. The standard deviation and coefficient of variation of the false reserve from the true reserve at various angles of deviation were also estimated. Based on coefficient of variation a mathematical model has been suggested for estimating the reliability of ore reserve for various angles of deviation during exploratory drilling operations.
Keywords:
False reserve, True reserve, Coefficient of variation, Reliability, Confidence level
Cite this paper: Nwosu J. I., Amadi K., Influence of Hole Deviation on the Reliability of Ore Reserve, International Journal of Mining Engineering and Mineral Processing , Vol. 11 No. 1, 2022, pp. 1-7. doi: 10.5923/j.mining.20221101.01.
1. Introduction
Borehole deviation is a shift of the hole during drilling from the initially designed trajectory. If the initial trajectory of the hole is to be vertical, for instance during the investigation of a horizontally bedding deposit and hole begins to drift away from the vertical trajectory, this curvature is most likely to give a false impression of the thickness of the deposit. On the other hand, if a horizontal borehole is desired to be drilled to confirm the thickness of an ore body in an exploration programme, a shift from a horizontal trajectory will be regarded as a deviation. In our case which is the investigation of the thickness of ore bodies of steeply dipping deposit, hole deviation is made use of to ascertain the thickness of ore bodies. In fact the exploratory hole is given an initial angle of deviation to enable it move in such a trajectory as to intersect the ore bodies at 90°. This should give the true thickness of ore body. However, in practice, no matter how precise the estimation tool is and no matter how detailed the study of the rock lithology is done, the exploratory hole usually deviates from the designed trajectory. This deviation is influenced by the variation of rock mechanical properties and expertise in borehole orientation and technology. (Alwyn et’al 1991) noted that hole deviation from design trajectory is one of the factors affecting the accuracy of ore reserve. They further stated that those who estimate ore reserves do not accompany it with level of reliability of the ore reserve. The impact of variability of ore body thickness, ore density and grade on project NPV in a gold mine has been demonstrated by Grant (2014). The risk imposed by reserve reliability on mineral project viability is widely acknowledged by official organs of government on mineral resource management, hence Canadian Institute of Mining and Metallurgy (2019) devotes much attention to risk analysis in reserve estimation and classification with the goal of assisting mineral practitioners to establish mineral resource confidence. Thus creation of awareness on the level of reliability of ore reserve can assist mine planners to make informed decisions on mine project’s NPV (net present value) and IRR (internal rate of return).The reliability of ore reserve is the probability that the ore reserve figure provided during estimation process will be available in the deposit when the project comes on stream. In order to ensure a balanced view on mineral project reporting, it is necessary to report both on the opportunities a mineral project presents as well as the inherent uncertainties associated with the reserve figure (Noppe 2014). All these tend to show that more work has to be done in the area of reserve reliability estimation.
2. Methodology
The process of developing a model for reliability estimation of ore reserve is being proposed here through a geometrical modelling process in which the mineral ore body model is used. The ore body model is divided into grids of 50m each, depths are given to the ore body at each profile and the thickness of the ore body is also measured.The reserve of ore body between two profiles is given as | (1) |
WhereL = Distance between two profiles 50mD = average depth of ore body between two profilesT = Average thickness of ore bodies between two profilesBecause of complex configuration of ore bodies, the average thickness between two profiles is given by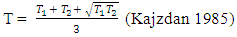 | (2) |
WhereT1 = Thickness of ore body along the first profileT2 = Thickness of ore body along the second profileThen a deviation of  degrees is given to the borehole trajectory and apparent thickness is calculated using the following formular.
 | (3) |
Where = False (apparent) thickness of ore body when the angle of deviation is
  The apparent thicknesses caused by
  degrees (
 = 10°, 15°, 20°, 25° and 30°) are now used to recalculate ore reserve for each deviation angle and all the ore reserves are tabulated. The total reserve for each angle of deviation and for the true reserve (the reserve without deviation) are obtained by summing up the reserve in all the profiles covering the entire length of ore body. The reserves are expressed in millions of tons.
2.1. Confidence Level versus Reliability
The confidence level of ore reserve is associated with the estimation of confidence interval (upper and lower limits) in which that confidence level exists. The wider the confidence interval, the higher the confidence level. In fact the confidence level is highest (100%) when the confidence interval ranges from zero to infinity. The implication of this is that confidence level does not give us the probability that the reserve estimate is correct but merely gives us the probability that the ore reserve lies within the interval (upper and lower limit). As correctly stated by Alwyn (1991), a wide confidence limit means low confidence or not assigned (Mineral deposit evaluation, page 176).Confidence interval for a given confidence level is estimated from student’s distribution as follows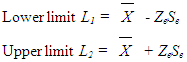 | (4) |
WhereL1 = Lower limit of the interval = Mean deviationZe = the variable from student distribution based on the chosen confidence level.Se = Standard Error
 | (5) |
WhereS = Standard deviationN = No of samples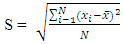 | (6) |
The upper and lower limit of the reserve and corresponding level of confidence for various angles of deviation are tabulated.From the foregoing, it therefore becomes clear that in order to assess the trueness of ore reserve, the reliability of ore reserve is more applicable. The reliability of ore reserve figure tells us the probability that the ore reserve predicted is close to the true reserve.The major factor separating the false reserve from the true reserve is reflected in coefficient of variation of the false reserve from the true reserve. Coefficient of variation is estimated from | (7) |
WhereCv = Coefficient of variation of false reserve from the true reserveS = Standard deviation of false reserve from the true reserveTr = True reserveConsequently reliability of ore reserve can be estimated from the following equation. | (8) |
WhereR = Reliability of ore reserve (in fraction) or in percentageR = 100 (1 – Cv)Finally the reliability of ore reserve is calculated for each range of angle of deviation and a graph in reliability and angle of deviation is plotted.
3. Results and Discussion
3.1. Geometrical Modelling for Ore Reserve Estimation
In order to carry out geometrical modelling that will provide the relevant parameters for reliability estimation, a geometrical model of the ore body is used (fig 1). As can be shown in the figure distance between two profiles is 50m, depths of the ore body at the profiles are given in column 2 of table 1. The true thicknesses of the ore body are measured and tabulated in column 3 of table 1. Furthermore, using equation (3) the thicknesses of ore bodies at various angles of deviation (10° – 30°) were estimated and tabulated in columns 4, 5, 6, 7 & 8 of same table 1.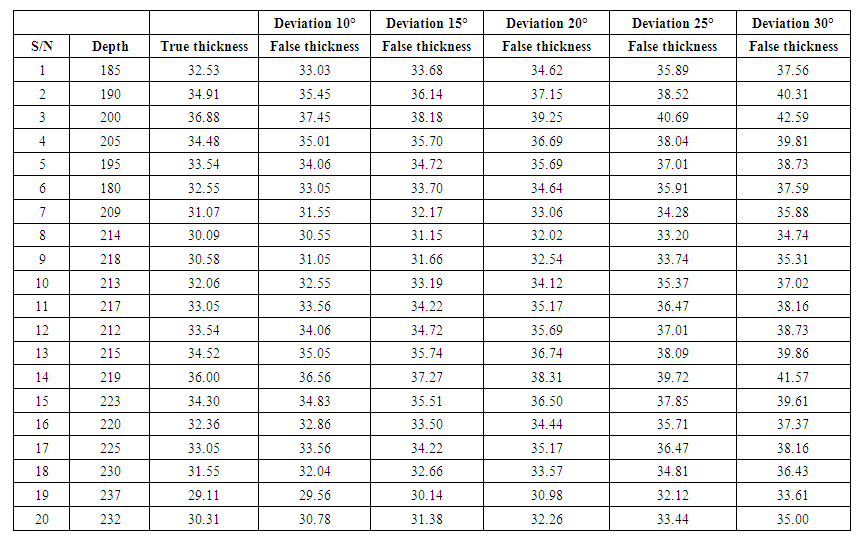 | Table 1. Thickness of the ore body in relation to angle of deviation |
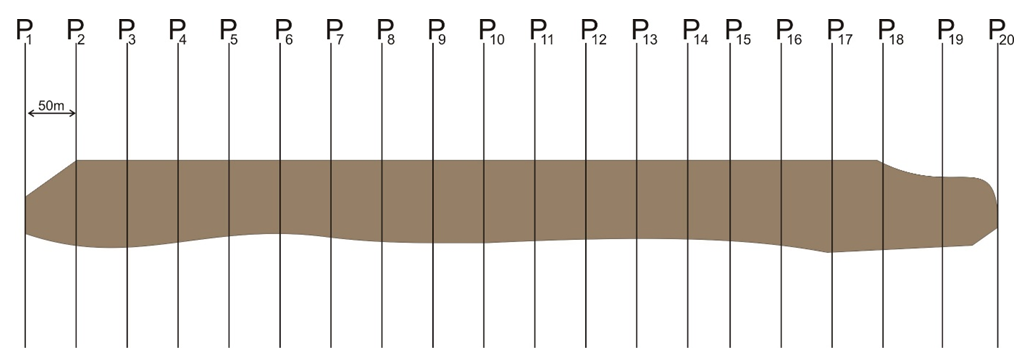 | Figure 1. Profiles along the strike of the ore body |
To estimate the average thicknesses of ore bodies between two profiles, formula (2) was used for both true and false thicknesses and were tabulated accordingly in table 2 (Columns 3, 5, 7, 9, 11, 13). Using equation (1) the reserves of the ore body between two successive profiles were calculated for both true and false reserves and presented in columns 4, 6, 8, 10, 12 & 14 of table 2.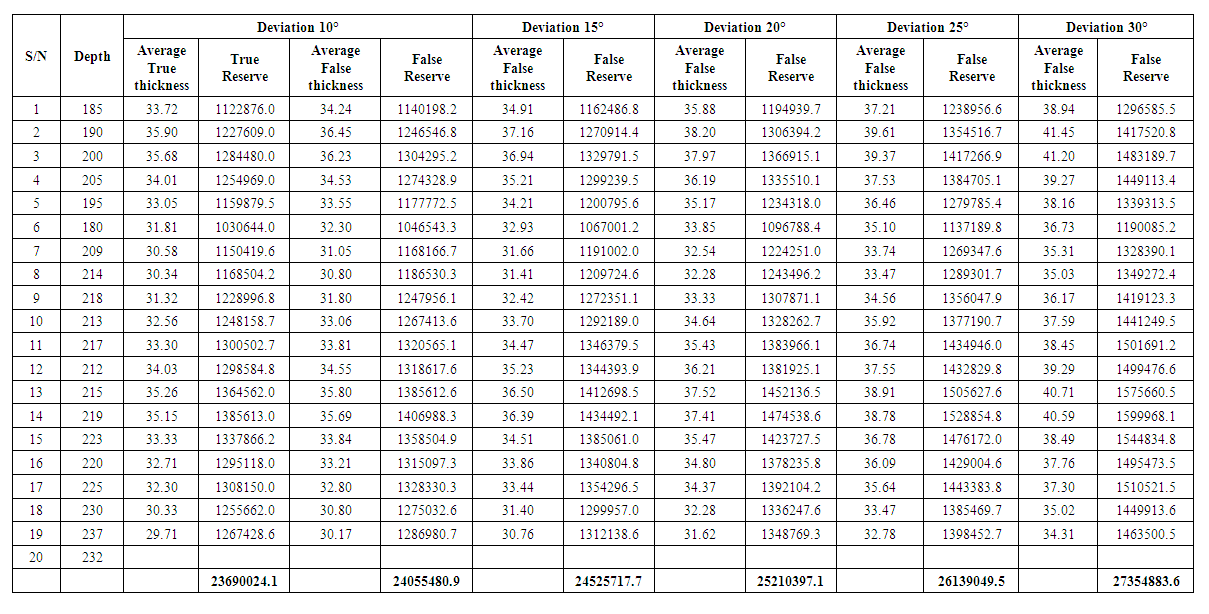 | Table 2. Reserve of the ore body in relation to angles of deviation |
Finally the reserves in all the profile intervals for both true and false reserves are added respectively for the entire length of the ore body to get the reserve of the entire ore body.
3.2. Confidence Interval, Confidence Level and Reliability Estimation
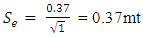
Now using the true and false reserves estimated above the confidence intervals based on the chosen confidence level are now estimated according to the various angles of deviation. In this analysis the true reserve will serve as mean reserve. This is because every member or component of a distribution revolves around the mean just as every false reserve (whether higher or lower than the true reserve) revolves around the true reserve. This approach was applied by Barry and Whateley 1995 in relation to true grade and mean grade.For 10° deviation, standard deviationS1 = 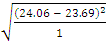 = 0.37mtStandard Error
 To estimate Ze in formula (4) using student distribution table.
 = 31.82 (for 99% confidence level and 1 degree of freedom)Mean Reserve (true reserve) = 23.69mtLower Limit = 23.69 – (31.82 x 0.37) = 11.92mtUpper Limit = 23.69 + (31.82 x 0.37) = 26.03mtTherefore Confidence interval for 99% confidence level = 11.92mt — 35.46mt95% confidence level and 1 degree of freedomLower Limit = 23.69 – (6.31 x 0.37) = 21.35mtUpper Limit = 23.69 + (6.31 x 0.37) = 26.03mtConfidence interval for 99% confidence level = 21.35mt — 26.03mt90% confidence level and 1 degree of freedomLower Limit = 23.69 – (3.08 x 0.37) = 22.55mtUpper Limit = 23.69 + (3.08 x 0.37) = 24.83mtConfidence interval for 90% confidence level = 22.55mt — 24.83mt80% confidence level and 1 degree of freedomLower Limit = 23.69 – (1.376 x 0.37) = 23.18mtUpper Limit = 23.69 + (1.376 x 0.37) = 24.2mtConfidence interval for 80% confidence level = 23.18mt — 24.2mt75% confidence level and 1 degree of freedomLower Limit = 23.69 – (1.0 x 0.37) = 23.32mtUpper Limit = 23.69 + (1.0 x 0.37) = 24.06mtConfidence interval for 75% confidence level = 23.32mt — 24.06mt70% confidence level and 1 degree of freedomLower Limit = 23.69 – (.727 x 0.37) = 23.42mtUpper Limit = 23.69 + (.727 x 0.37) = 23.96mtConfidence interval for 70% confidence level = 23.42mt — 24.96mt60% confidence level and 1 degree of freedomLower Limit = 23.69 – (.325 x 0.37) = 23.57mtUpper Limit = 23.69 + (3.08 x 0.37) = 23.81mtConfidence interval for 60% confidence level = 23.57mt — 23.81mt55% confidence level and 1 degree of freedomLower Limit = 23.69 – (.158 x 0.37) = 23.63mtUpper Limit = 23.69 + (.158 x 0.37) = 23.75mtConfidence interval for 55% confidence level = 23.63mt — 23.75mt10° - 15°S1 =
 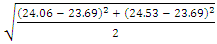 = 0.65mtStandard Error
  = 0.46mtMean Reserve = 23.69mt99% confidence level and 2 degree of freedom)Lower Limit = 23.69 – (6.96 x 0.46) = 20.49mtUpper Limit = 23.69 + (6.96 x 0.46) = 26.89mtConfidence interval for 99% confidence level = 20.49mt — 26.89mt95% confidence level and 2 degree of freedomLower Limit = 23.69 – (2.92 x 0.46) = 22.35mtUpper Limit = 23.69 + (2.92 x 0.46) = 25.03mtConfidence interval for 95% confidence level = 22.35mt — 25.03mt90% confidence level and 2 degree of freedomLower Limit = 23.69 – (1.89 x 0.46) = 22.82mtUpper Limit = 23.69 + (1.89 x 0.46) = 24.56mtConfidence interval for 90% confidence level = 22.82mt — 24.56mt80% confidence level and 2 degree of freedomLower Limit = 23.69 – (1.061 x 0.46) = 23.2mtUpper Limit = 23.69 + (1.061 x 0.46) = 24.18mtConfidence interval for 80% confidence level = 23.2mt — 24.18mt75% confidence level and 2 degree of freedomLower Limit = 23.69 – (.816 x 0.46) = 23.31mtUpper Limit = 23.69 + (.816 x 0.46) = 24.07mtConfidence interval for 75% confidence level = 23.31mt — 24.07mt70% confidence level and 2 degree of freedomLower Limit = 23.69 – (.617 x 0.46) = 23.41mtUpper Limit = 23.69 + (.617 x 0.46) = 23.97mtConfidence interval for 70% confidence level = 23.41mt — 24.97mt60% confidence level and 2 degree of freedomLower Limit = 23.69 – (.289 x 0.46) = 23.56mtUpper Limit = 23.69 + (.289 x 0.46) = 23.82mtConfidence interval for 60% confidence level = 23.56mt — 23.82mt55% confidence level and 2 degree of freedomLower Limit = 23.69 – (.142 x 0.46) = 23.62mtUpper Limit = 23.69 + (.142 x 0.46) = 23.76mtConfidence interval for 55% confidence level = 23.62mt — 23.76mt.The same process is used to compute confidence interval for chosen confidence level at other angles of deviation (10 – 20, 10 – 25, 10 – 30) and are presented in table 3.
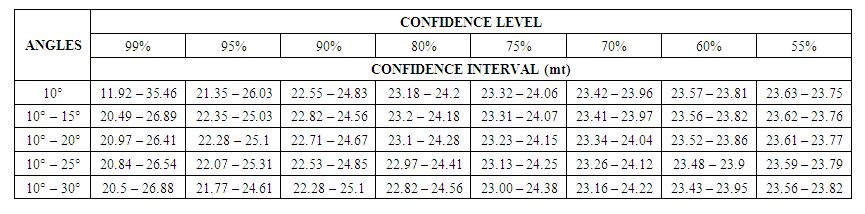 | Table 3. Confidence levels, confidence intervals at various angles of deviation |
Coefficient of variation and Reliability Calculation10°Cv =  = 0.02Reliability (R) = 1 – CvR = 1 – 0.02 = 0.98(98%)10°, 15°Cv =
  = 0.03R = 1 – 0.03 = 0.97(97%)10°, 15°, 20°Cv =
  = 0.04R = 1 – 0.03 = 0.96(96%)10°, 15°, 20°, 25°Cv =
  = 0.06R = 1 – 0.03 = 0.94(94%)10°, 15°, 20°, 25° 30°Cv =
  = 0.09R = 1 – 0.03 = 0.91(91%)
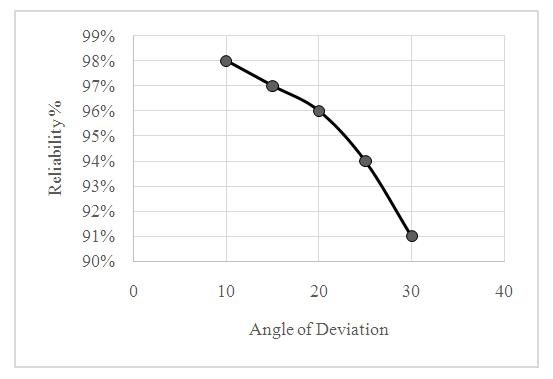 | Figure 2. Graph showing the relationship between angle of deviation of exploratory boreholes and the reliability of ore reserve |
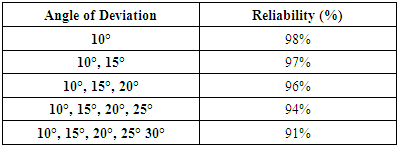
In order to estimate the reliability of ore reserve the exploration geologist does not need to carry out the geometrical modelling as shown above, because coefficient of variation depends only on the angles of deviation and not on the reserves of the deposit (Murray and Larry 2008). Consequently knowing the angle of deviation of exploratory trajectories from 90° to the ore body all that is required for reliability estimation is to pick the coefficient of variation for the corresponding angle of deviation and then calculate reliability by formula (8).An important advantage of this reliability approach over other parameters like precision (Barnes 1980) and confidence (Whateley 2006) is its ability to be used for considering the effect of several factors. For example if during the exploration of a mineral deposit the angle of deviation of hole trajectories from the ore body varies from 10 - 30 and the mean grade of the deposit was 36% with a standard deviation of 2% and the mean specific gravity was 3.5 with a standard deviation of 0.3, then; reliability of ore reserve on account of hole deviation is 91% (table 4). Coefficient of variation of ore grade =  = 0.056. From formular (8), reliability on the basis of grade is 1 – 0.056 = 0.94 or 94%.
 Table 4. Reliability of ore reserve based on range of angles of deviation
 |
| |
|
For specific gravity coefficient of variation is =  = 0.09. Reliability = 1 – 0.09 = 0.91 or 91%Therefore the reliability of the mineral property under the joint effect of the 3 factors is equivalent to:
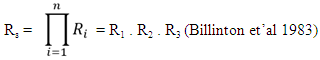 Where;R1 = the mineral deposit reliability on reserve estimationR2 = the mineral deposit reliability grade estimationR3 = the mineral deposit reliability on specific gravityRs = the joint reliability under the effects of the 3 factorsConsequently, Rs = 0.91 x 0.94 x 0.91 = 0.78 or 78%.
4. Discussion and Conclusions
1. Geometrical modelling approach provides an opportunity to obtain true reserve and false reserve in a multiple deviation angle exploration. Using this true and false reserve, it is then possible to estimate the standard deviation of false reserve from true reserve as well as coefficient of variation of the false reserve from true reserve.2. The major parameter that reflects the deviation of false reserve from true reserve is coefficient of variation. Thus coefficient of variation can be used to show how close the estimated reserve is from the true reserve i.e reliability of ore reserve. Thus formula (8) provides the opportunity to estimate reliability of reserve based on angle of deviation of exploratory boreholes from 90° to the ore body during exploration.3. Our analysis has also shown that the confidence level does not show the accuracy of ore reserve but merely shows the probability that the ore reserve lies within certain range (upper and lower limit).
References
| [1] | Alwyn E. Annels (1991) Mineral Property Evaluation: A Practical Approach. Published by Springer, London. Pp 176. |
| [2] | Barry and Whateley (1995) Introduction to Mineral Exploration: Evaluation Technique. Published by Blackwell Publishing Ltd. Pp 199 – 252. |
| [3] | Barnes M.P. (1980) Computer Assisted Mineral Appraisal and Feasibility, Society of Mining Engineers, American Institute of Mining, Metallurgical Petroleum Engineers, New York, 167 Pp. |
| [4] | Billinton, R. (1983) Reliability Evaluation of Engineering Systems. Pitmans Advanced Publishing Ltd, Boston, USA, Pp 67. |
| [5] | CIM Estimation of Mineral Resources and Mineral Reserve Best Practice Guidelines (2019). |
| [6] | Grant, N (2014) An Integrated Risk Evaluation Model for Mineral Deposit. Ph.D Thesis, University of Adelaide, Australia. |
| [7] | Kajzdan A.B (1985), Prospecting and Exploration for Mineral Deposit. Published by Technicheskaya Kniga, Leningrad (in Russian). |
| [8] | Noppe, M.A (2014) Communicating confidence in Mineral Resources and Mineral Reserves, Journal of the Southern African Institute of Mining and Metallurgy, Vol.114 n.3 Johannesburg. |
| [9] | Murray R. Spiegel, Larry J. Stephens (2008). Theory and Problem of Statistics Fourth Edition. McGraw-Hill Companies, U.S.A. Pp 571. |
| [10] | Whateley (2006) Introduction to Mineral Exploration. Published by Blackwell Publishing Ltd. 481 Pp. |

 Abstract
 Reference
 Full-Text PDF
 Full-text HTML