Akira Sato1, Haowen Tang2
1Graduate School of Advanced Science and Technology, Kumamoto University, Kumamoto, Japan
2Graduate School of Science and Technology, Kumamoto University, Kumamoto, Japan
Correspondence to: Akira Sato, Graduate School of Advanced Science and Technology, Kumamoto University, Kumamoto, Japan.
| Email: |  |
Copyright © 2020 The Author(s). Published by Scientific & Academic Publishing.
This work is licensed under the Creative Commons Attribution International License (CC BY).
http://creativecommons.org/licenses/by/4.0/

Abstract
Limestone is one of the most important natural resources in modern society, and it is the only mineral for which Japan has 100% self-sufficiency. In general, limestone deposits are located in mountainous areas. Thus, the bench-cut method, combined with a carry-out system using vertical ore passes, is widely used in Japan. To extract ores from mountainous areas, the ores are stored in the vertical ore passes, and then they are carried out from the bottom of the ore passes. During the storing process in the vertical ore passes, the hang-up phenomenon occurs sometimes, and several examples of hang-ups have been reported in Japan. Once it happens, it causes severe damage to the mining operations, and much effort is necessary to remove the hang-ups. To understand the mechanism of hang-up phenomena, ore flow simulations in long and vertical ore passes were carried out using the three-dimensional discrete-element method, and the influences of cross-sectional shapes, the shape of the exit at the bottom of the ore passes, and the height of the stored limestone in the ore pass were investigated. It was found that the hang-up phenomenon is strongly influenced by the cohesion and the friction coefficient. As for the size of the ore passes, a larger cross section was preferable for avoiding ore pass hang-ups. It was also found that the cross-section shape and the bottom shape of the ore pass influenced the occurrences of hang-ups, and that a square shape was preferable to avoid hang-ups. The elimination of hang-ups was also simulated. It was found that it is possible to eliminate hang-ups if a method is used to reduce the friction coefficient and cohesion. It was also found that using oscillations with higher frequency was effective.
Keywords:
DEM, Ore pass, Hang-up phenomena, Cohesion, Interlocking, Limestone
Cite this paper: Akira Sato, Haowen Tang, Analysis of Ore Pass Hang-Ups in Long Vertical Ore Passes by 3-D DEM, International Journal of Mining Engineering and Mineral Processing , Vol. 9 No. 1, 2020, pp. 1-11. doi: 10.5923/j.mining.20200901.01.
1. Introduction
Limestone is one of the most important resources. More than 200 limestone mines are operative in Japan, most of which are located on mountainsides [1]. In many cases, open-pit mining is employed in Japanese limestone mines, and vertical ore passes are commonly used. This vertical ore pass has two main roles. One is transporting ores to industrial sites and shipping sites at lower altitudes. Another is the role as temporary storage of a certain amount of ores, which contributes to a continuous and stable supply of ores (Figure 1). Therefore, the vertical ore pass is an important component in the operation of limestone mines. A problem is that ore pass hang-ups in vertical ore passes can cause extensive damage during mining operations [2-8]. As is well known, there are two types of hang-up. One is the interlocking hang-up, which is governed by the ratio of ore size to the ore pass diameter [5]. Another is the cohesive hang-up, which is mainly caused by the cohesion between ores and the ore pass wall [10,11]. To avoid the interlocking hang-up, generally, the ore size after blasting is controlled to be less than approximately 50cm before ores are thrown into vertical ore passes. Moreover, to avoid cohesive hang-ups, ores that contain much argillaceous material are excluded before the ores are thrown into the vertical ore passes. Nevertheless, hang-ups in vertical ore passes often occur. Thus, effective methods and designs of ore passes to avoid ore pass hang-ups are strongly required. In general, circular cross-sections of vertical ore passes are widely used in Japan; however, other cross-sectional shapes, such as square shapes, have recently been introduced [11,12]. Nevertheless, the degree to which ore pass hang-ups can be avoided remains unknown.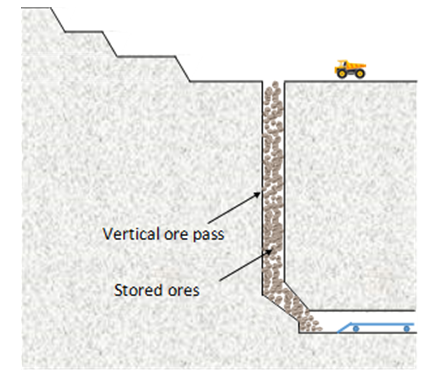 | Figure 1. Representative arrangement of open pit limestone mine in Japan |
To investigate the mechanism of this phenomenon, Sato and Obara [13,14] conducted numerical simulations by using the two-dimensional discrete-element method (2D-DEM), which is a method for calculating the movement of each discrete element in an analytical region [15,16], and it is suitable for simulating the movement of ore in ore passes. In that study, the cohesion between ores and ore pass walls was revealed to be the dominant factor in causing ore pass hang-ups in vertical ore passes. However, these analyses were conducted using a two-dimensional model. Thus, the effect of the cross-sectional shape was not considered. However, Hadjigeorgiou and Lessard [12] conducted numerical analysis of ore flow in circular and square ore passes using 3D-DEM. The conditions when interlocking hang-ups occurred were evaluated, and the geometrical conditions between ore size and ore pass dimension were discussed. However, the height of ore passes was not as large as the heights of Japanese ore passes, and higher ore passes and a higher number of particles must be considered when discussing the hang-up phenomena in Japanese mines. Moreover, the other parameters that are believed to be related to cohesive hang-ups, such as cohesion and the friction coefficient between ores and between the ores and ore pass walls, were not considered.In this study, the geometric effects of long vertical ore passes on ore pass hang-ups were simulated by 3D-DEM analysis. Simulations were conducted under the various values of cohesion and friction coefficients, which exert an influence on ore pass hang-ups. In Japan, more than 400-m-high vertical ore passes are in operation. The height of the vertical ore passes was set to be 400m in the numerical simulations. To evaluate the effect of the ore pass shapes, two types of cross-sectional shape of the vertical ore passes were assumed: circular and square. These ore passes were initially filled with discrete elements, which were then extracted from the bottom of the vertical ore passes. In this study, the effects of the cross-sectional shapes and the possibility of the ore pass hang-ups are mainly discussed. The influence of cohesion and the friction coefficient on hang-ups was evaluated. By changing the initial numbers of ore, the influence of overburden on hang-ups was also examined. Finally, several approaches to solve this problem were proposed, and their efficiencies were simulated.
2. Ore Flow Analysis by 3D-DEM
PFC3D, produced by Itasca Consulting Group Inc., was used as the DEM analysis software. Although the shapes of the ores are complex, the ores are approximated as discontinuous sphere particles in the 3D-DEM analysis. The individual movement of each particle was calculated using the forward-difference method. Because the movements of the particles are similar to the ones of each ore, this is a suitable method for simulating the movement of ores in the vertical ore pass. Hadjigeorgiou and Lessard [12] discussed the conditions for interlocking hang-ups. Although several parameters were available in the DEM analysis, the cohesion and the friction coefficient, which are strongly related to cohesive hang-ups, are thought to be the main causes of ore pass hang-ups. Thus, the influences of these factors on ore pass hang-ups were evaluated under various combinations of the two factors.
2.1. Vertical-ore-pass Model
The influence of the cross-sectional shapes of vertical ore passes was also analyzed in this study. The geometric features of the circular and square vertical-ore-pass models used in this study are shown in Figure 2. In general, circular cross sections of vertical ore passes are widely used in Japanese mines, because vertical ore passes are drilled by the combination of raise boring and subsequent reaming in many cases. Even in large-scale vertical ore passes, it is possible to shape various types of cross-section during the reaming process on site. To examine other possibilities for avoiding ore hang-ups, simulations of ore flows in square cross sections of vertical ore passes, as well as circular ones, were conducted. At first, the simulations were conducted using straight models whose cross sections were circular and square, as shown in Figures 2(a) and (b), respectively. The diameters of the circular ore passes were set to D = 6-10 m in reference to the application of on-site examples. To compare the effects of cross-sectional shapes of vertical ore passes, simulations were conducted by using models with the same cross-sectional area for circular and square ore passes. In the case of square ore passes, the length of side L was taken as the cross-sectional area equal to those of the corresponding circular ore passes. For example, when the diameter of circular ore passes is D = 8 m, the corresponding length of side L becomes 7.09 m. For the height of vertical ore passes, the value H = 400 m was used. The height was also based on applications in on-site examples. When ores are extracted from the bottom of vertical ore passes, generally, ores are passed through the chute that leads ores from the vertical part of the ore passes to crushing rooms or conveying rooms, as shown in Figures 2(c) and (d). The geometry around the chute is shown in Figures 2(e). The shape and size are based on applications in on-site examples. The inclination of the chute was 45°, and the height of the narrowest part was 2.6 m. To examine the effect of the chute, simulations were also conducted using the models shown Figures 2(c) and (d).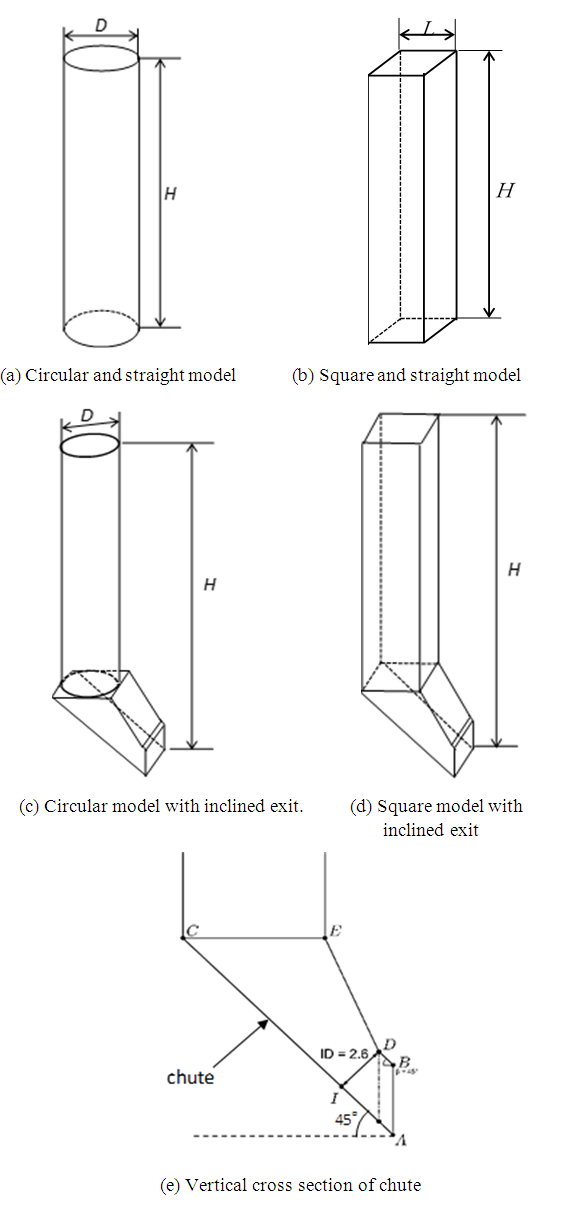 | Figure 2. Geometry vertical ore path models |
2.2. Ore Size Distribution
The sizes and diameter distributions of ores strongly influence the occurrences of hang-ups, and big particles are broken before the ores are thrown into vertical ore passes. The size distribution after blasting is mainly influenced by the diameter of the drilling holes used to set explosives and their intervals. In Japan,  120-mm drilling holes are the most widely used type. In this study, the ore size distribution was estimated from digital photo images using Split-Desktop software. An example of the fragmentation after blasting is shown in Figure 3. The ore size distribution, such as the mean diameter and standard deviation, was evaluated by comparing the size of the balls in the figure with the ores. It was assumed that the ore size distribution obeyed the Gaussian distribution. For the values of mean diameter dm and standard deviation
  , dm = 0.7 m and
  = 0.05 m were used in this study.
 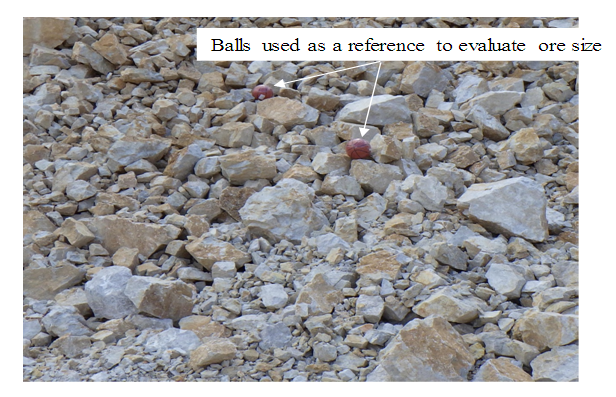 | Figure 3. A photo of ores after blasting for determining the ore size distribution |
2.3. Procedures of Analysis
The DEM analysis began from the generation of particles in a particle generation region that was temporarily located at the top of the vertical shafts, as shown in Figure 4(a). Particles were randomly generated in the generation region. After a certain number of particles was generated, they fell into the vertical ore pass by the force of gravity. In this process, the carry-out exit located at the bottom of the ore pass was closed, and particles were stored in the vertical ore pass. This process was repeated until the height of the ores in the vertical ore pass reached the initial storage height H0, as shown in Figure 4(b). Following this, such parameters as cohesion and the friction coefficients between particles and between particles and the ore pass walls were applied to the model. In this study, the analysis began from various initial heights of particles in an ore pass H0. The initial height was changed to examine the influence of the ore’s overburden on hang-ups. The carry-out exit was opened, thereby initiating the flow-out analysis of the particles. If all particles flowed out from the ore pass, it was determined to be a no-hang-up condition. If hang-ups occurred during the flow-out process, it was determined to be a hang-up condition. The number of particles depended on the ore pass size. In the case in which a square model with L = 9.0 m was used and the ore pass was fully filled with particles, it was necessary to generate more than 50,000 particles.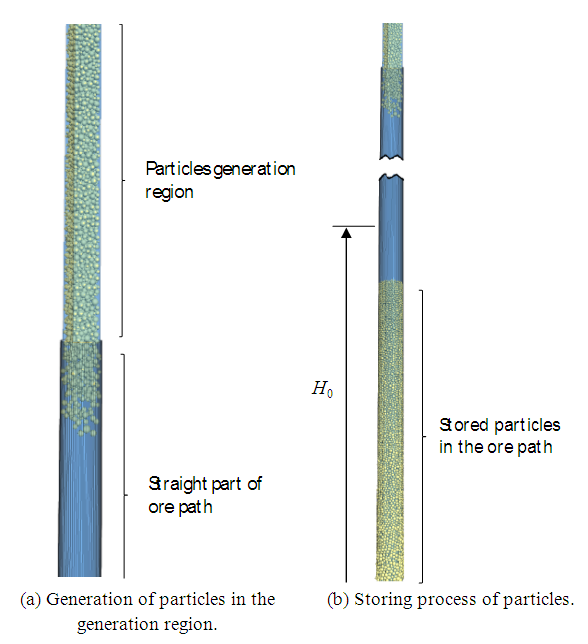 | Figure 4. Generation and storing processes of particles in the ore path model |
As mentioned above, cohesions and friction coefficients are the main causal factors of hang-ups in ore passes. It is difficult to estimate exact values of cohesions and friction coefficients between ores. Thus, these analyses were conducted under various possible combinations of cohesions and friction coefficients. Owing to the characteristics of limestone mines, the rock types of the ore pass walls and ores themselves were identical. Other parameters necessary for the DEM analysis were as follows: gravity acceleration g = 9.81 m/s2, and particle density  = 2,700 kg/m3.
3. Results of Particle Flow-Out Simulation
3.1. Simulated Hang-up Forms
In this analysis, flow-out simulations were conducted under the various values of cohesion c and friction coefficient  using various sizes and shapes of the vertical ore passes, as shown in Figure 2. As for the initial height H0, various values were applied. The ore pass hang-up was simulated in circular and square ore passes. In each case, straight models and models with chutes were tested. The forms of hang-up are shown in Figures 5 and 6. They are the results of ore passes with the same cross-sectional area. The diameter of the circular ore pass was D = 6.0 m, and the length of the square ore pass was L = 5.3 m. In each case, the initial height was H0 = 0.6H. As Figure 5 shows, in the circular and square cases, hang-ups in the middle of the straight vertical ore pass were simulated, even though the such properties as the cohesion and friction coefficient on the ore pass walls were uniform. The ores formed an archlike shape, and this supported the upper ores. In many cases, a hang-up occurred approximately 15 m above the exit. In the case of models with a chute, two types of hang-up were observed, as shown in Figure 6. One is the same as in Figure 5 in that the hang-up occurred in the middle of a straight part of the ore pass, as shown in Figure 6(a). Another hang-up occurred in the chute near the exit, as shown in Figure 6(b). The reason for the differences is discussed later.
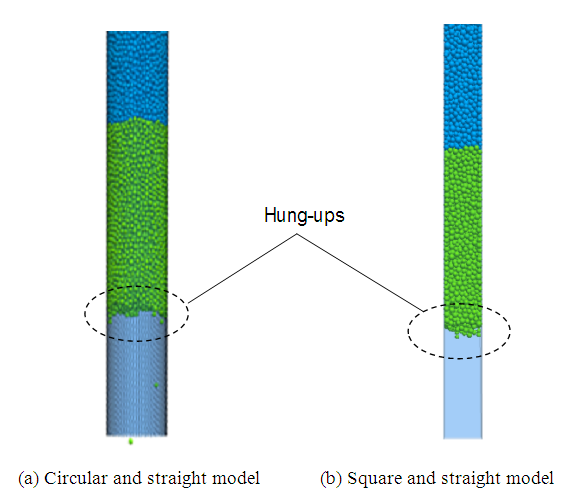 | Figure 5. Forms of hung-ups which occurred in the straight part of ore paths |
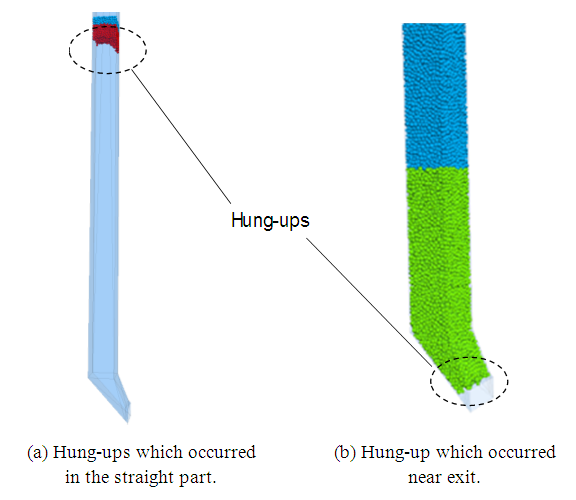 | Figure 6. Two types of hung-ups occurred in the models with inclined models |
3.2. Evaluation of Hang-up Phenomenon using Hang-up and Flow-out Maps
As mentioned before, there are two types of hang-up. One is the interlocking hang-up, and the other is the cohesive hang-up. It is relatively easy to avoid interlocking hang-ups by making the ore size small enough compared with the ore passes. However, several hang-up phenomena still have been reported in Japanese open-pit mines. Although the evidence is not clear, the cohesion of ores due to clay minerals involved in ores and the friction coefficients between ores are thought to be the main factors causing hang-ups. In this study, flow-out simulations were conducted under various combinations of cohesions and friction coefficients, and the relation between cohesions and friction coefficients when hang-ups occurred was summarized as hang-up and flow-out maps. Examples of the maps are shown in Figure 7. These are the results of the square model. The size was L = 5.3 m, and the initial height was H0 = 0.6H. Figure 7(a) is a result of the straight model, and Figure 7(b) is a result of the model with a chute. In both cases, the blue circles in the figure represent the combination of cohesion and the friction coefficients when the hang-up does not occur. The red squares represent the combination when the hang-up occurs at the straight part of vertical ore pass, and the green triangles represent the combination when the hang-up occurs at the chute near the exit. The boundary between where a hang-up occurs and where it does not is indicated by dotted lines in the figures. The left-hand side of the border represents the no-hang-up region, and the right-hand side represents the hang-up region where a hang-up definitely occurs. Figure 7 is an example; however, the same tendencies were confirmed in all cases in the models.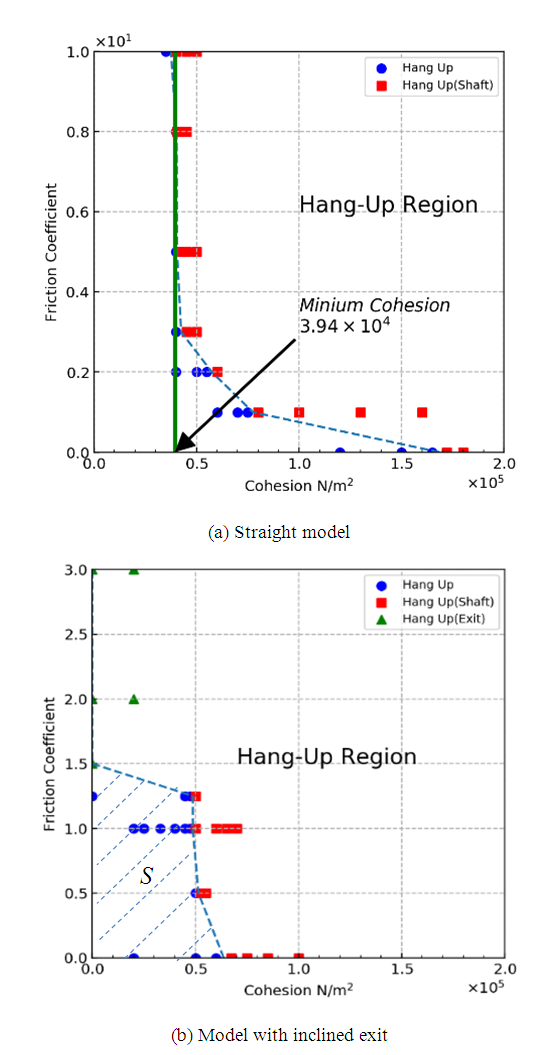 | Figure 7. Examples of flow out and hung-up maps of square models (L=5.3m, H=0.6H0) |
In the case of the straight model shown in Figure 7(a), a hang-up does not occur under a certain value of cohesion, and the minimum values of cohesion cause hang-ups. Hereafter, this value is called the “minimum cohesion.” However, the results of the models with a chute are a little different, as shown in Figure 7(b). In this case, although the cohesion is zero, a hang-up definitely occurs when the friction coefficient is larger than 1.5. In this case, a hang-up occurs at the chute near the exit. Unlike in the straight models, gravity acts on the chute, because it is inclined, and it causes friction forces between the ores and between the ores and slope. As a result, a hang-up easily occurs when the friction coefficient is high. Generally, the friction coefficient takes a value less than 1.0 when the smooth surfaces are contacted. However, the shapes of the ores are complex and rough, and irregularities of ore surfaces engage each other. In this case, it is thought that the nominal friction coefficient becomes larger than 1.0, so the simulations were also conducted when the friction coefficients were larger than 1.0. When the friction coefficient is less than 1.0, the tendency is similar to that in the case of the straight model - that is, the hang-up occurs when the ores have certain values of cohesion and the friction coefficient, and the hang-up occurs at the straight part of the vertical ore pass, as shown in Figure 6(a).As mentioned, a certain minimum cohesion exists in the case of the straight models, and the value of minimum cohesion shows how easily a hang-up occurs. However, there is no significant border in the case of models with a chute. To investigate the hang-up condition, the area of the no-hang-up region S is defined as shown in Figure 7(b).
3.3. Influence of Ore Pass Sizes and Shapes
To evaluate the influence of ore-pass size, simulations were conducted using different sizes of ore passes. Generally, the ore pass having a diameter of 8m is commonly used at the larger limestone mines in Japan. In the case of the circular model, the diameter D was set to be 6.0, 8.0, 9.0, and 10.0 m. In the case of the square model, the length of the side L was set to be 5.3, 7.1, 8.0, and 8.8 m. Representative results are shown in Figures 8-11. Figures 8 and 9 show the results of the straight models, and the cross-sectional shapes are circular and square, respectively. Figures 10 and 11 represent the results of models with chutes, and the cross-sectional shapes are circular and square, respectively. In all cases, the initial storage height was H0 = 0.6H.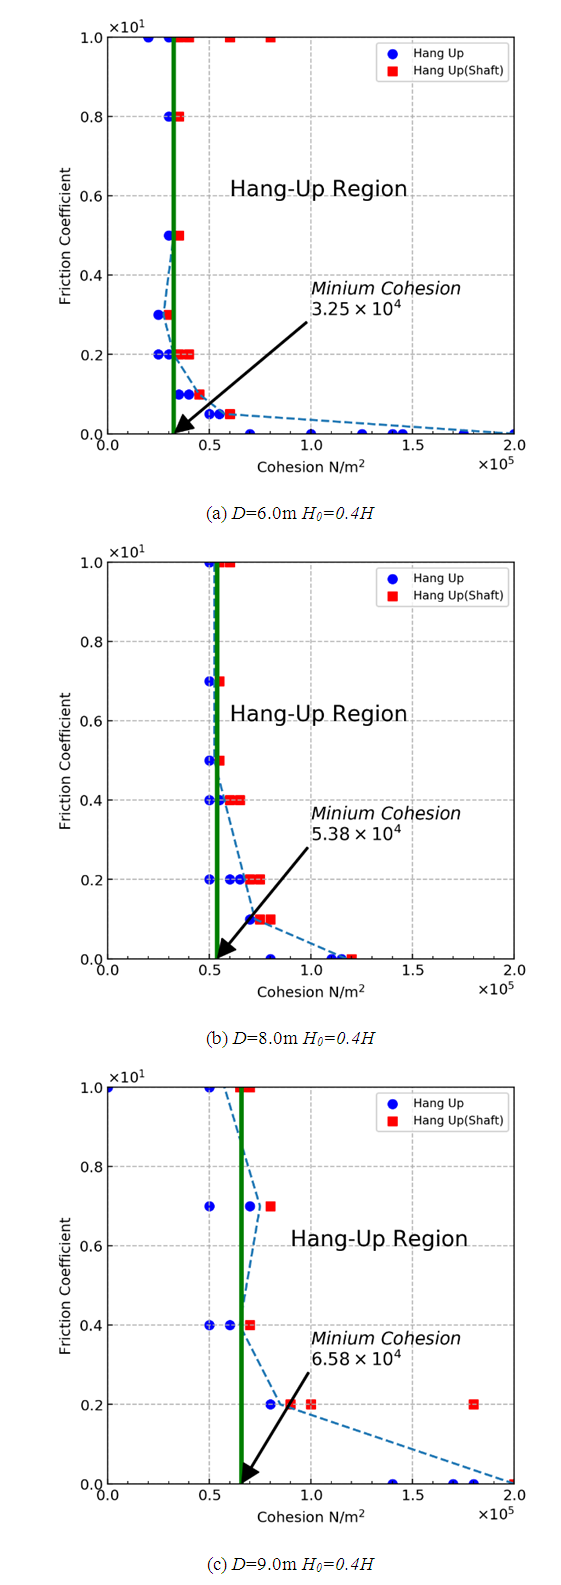 | Figure 8. Flow out and hung-up maps of Straight model (circular cross section) |
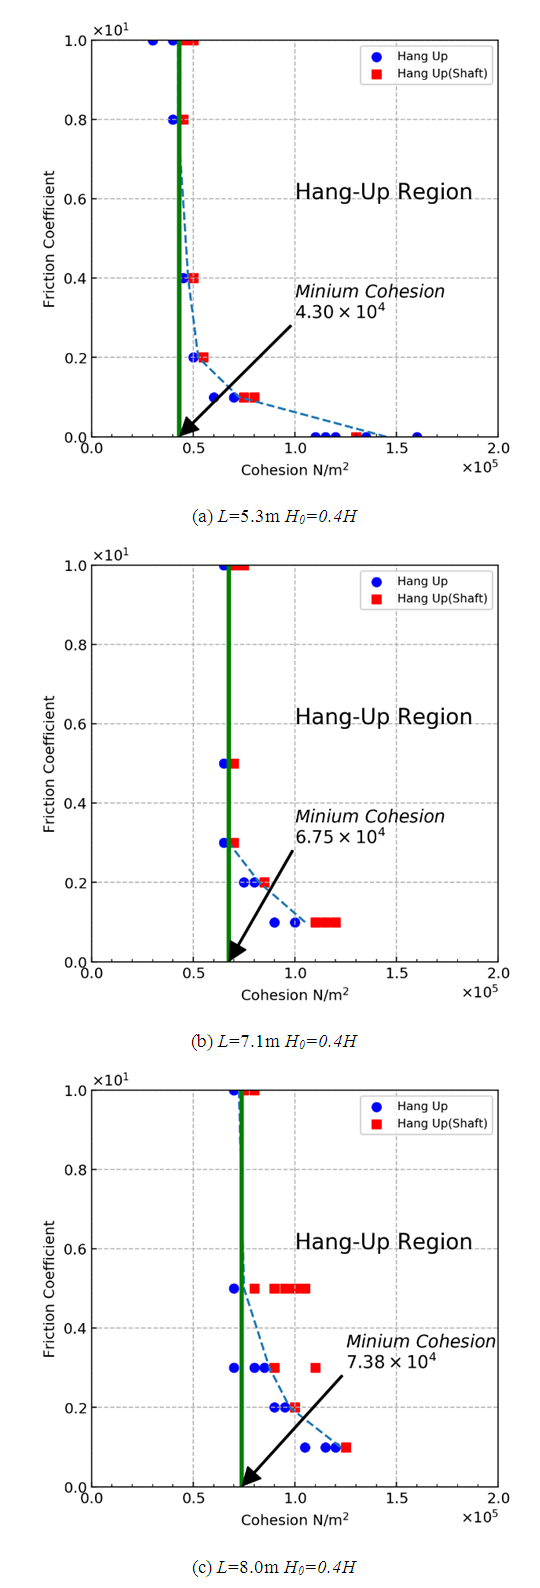 | Figure 9. Flow out and hung-up maps of Straight model (square cross section) |
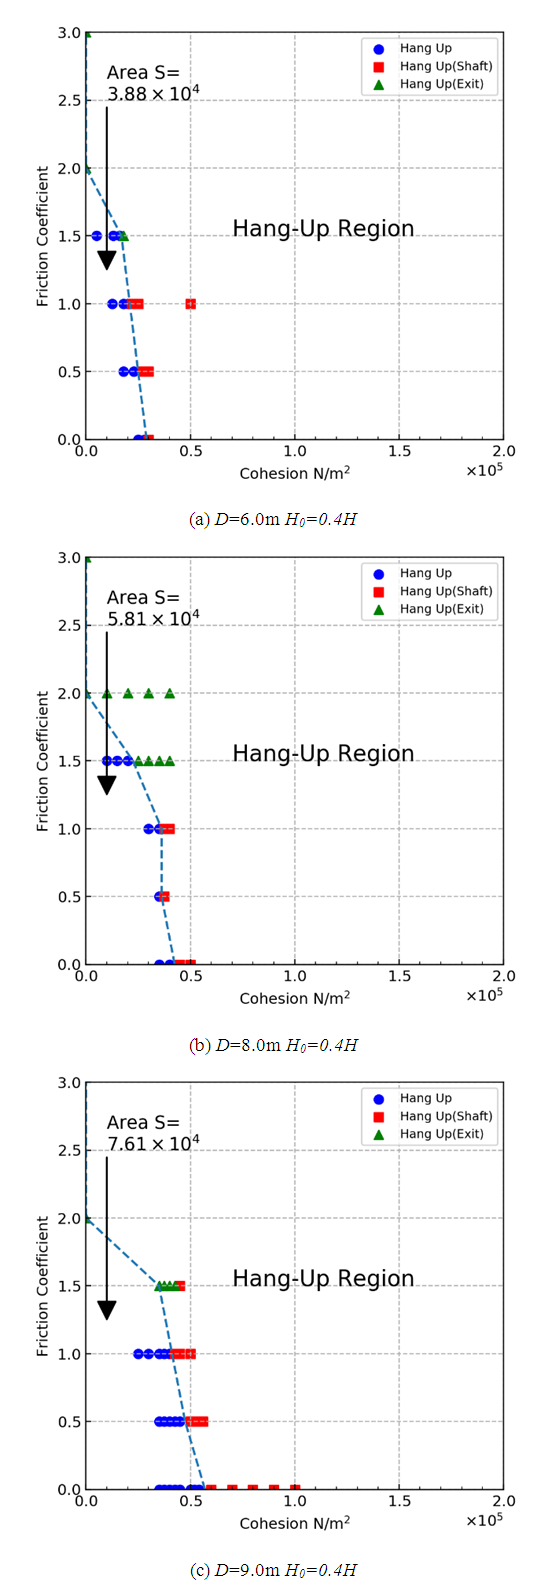 | Figure 10. Flow out and hung-up maps of models with inclined exit (circular cross section) |
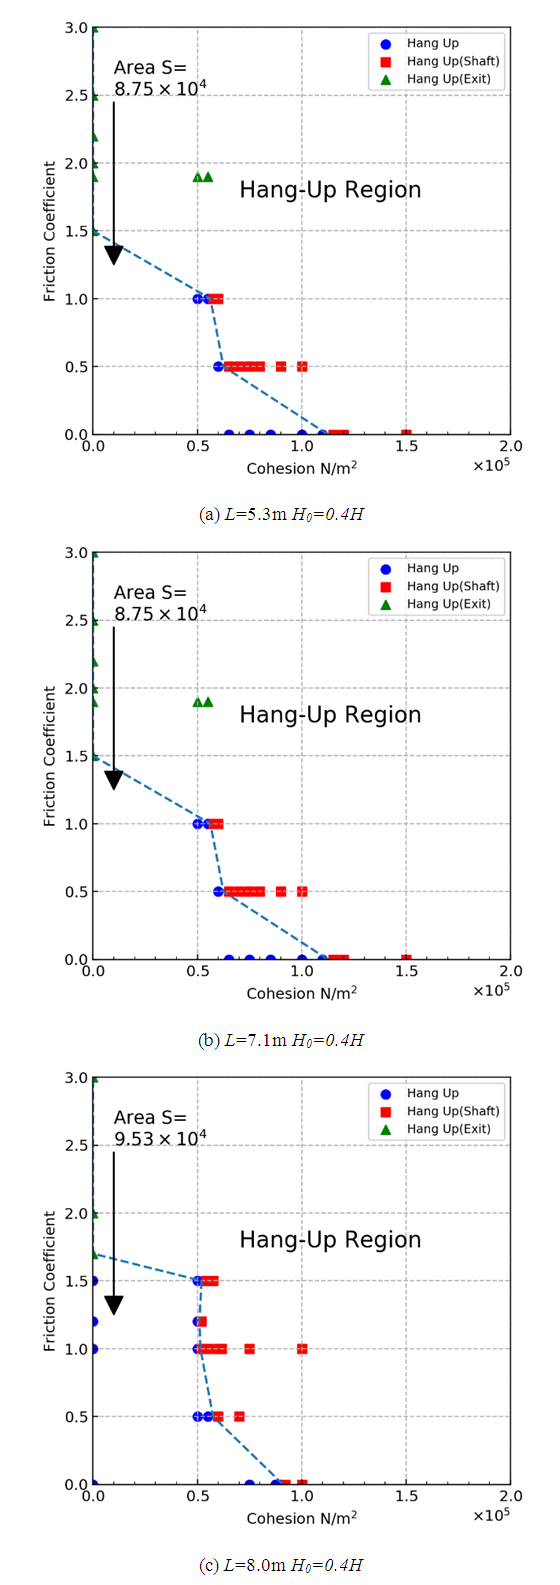 | Figure 11. Flow out and hung-up maps of models with inclined exit (square cross section) |
For the straight models, in the cases of the circular and square models, the value of minimum cohesion became larger as the size of the ore pass became larger. The larger size of the ore pass helps to avoid hang-ups. As stated before, simulations were conducted using different cross-sectional ore pass shapes; however, the cross-sectional areas were the same for the circular and square models. For example, the cross-sectional area of the circular model with D = 6.0 m was equal to the one of the square model with L = 5.3 m. By comparing Figures. 8(a) and 9(a), the minimum cohesion of square model is larger than the one of the square model. This means that, for the square models, it is difficult for hang-ups to occur compared with the circular model, and the square shape is preferable to avoid hang-ups. This result coincides with the results of Hadjigeorgiou and Lessard [12]. The reason for the difference is thought to be the symmetry of the models. In the case of the circular model, tangential forces are balanced, and forces conducted toward the wall are almost perpendicular to the wall at any part of the tangential position, because the shape of the model is axisymmetric - see Figure 12(a). However, the forces conducted from particles to the wall are not always perpendicular to the wall, because the shape is not axisymmetric - see Figure 12(b). As a result, particles can move relatively more easily along the wall surface, and it is difficult for the archlike shape that causes hang-ups to occur.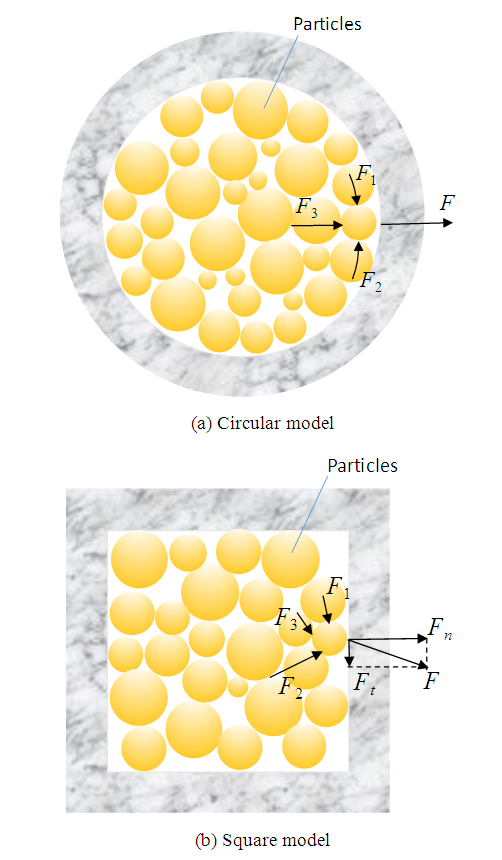 | Figure 12. Schematic model of acting forces conduced from particles to walls |
The same tendency was confirmed in the case of the models with chutes. In this case, the results were evaluated by the area of the no-hang-up region. The larger models had a larger value of the no-hang-up region, and the square models had larger values of the no-hang-up region when the cross-sectional areas were the same. In this case also, the square model was preferable to avoid hang-ups.
3.4. Influence of Initial Storage Height H0
Vertical ore passes are used as a part of a transport system to carry ores to a shipping site. Moreover, they have another important role of storing a certain amount of ores temporarily, and this helps ensure a stable supply of ores. Therefore, it is preferable to fill ore passes with ores during mining operations. Here, the influence of the initial amount of ores is discussed. Simulations were also conducted under various values of initial height H0 = 0.2H, 0.4H, 0.6H and 0.8H, and the conditions in which a hang-up occurs and those in which it does not were verified. The results are summarized in Figure 13. In these figures, the vertical axis represents minimum cohesions in the case of straight models, and it also represents the area of the no-hang-up region in the case of the models with chutes. As for the horizontal axis, the corresponding diameter was defined in the case of the square models. As stated before, the models that had the same cross-sectional areas were prepared in circular and square models to investigate the influence of cross-sectional shapes. The corresponding diameter of a square model was defined as the diameter of the circle that has the same cross-sectional area as the square model.First, the straight models, as shown in Figure. 13(a) and (b), are discussed. As mentioned before, as the size becomes larger, the value of minimum cohesion becomes larger. In the case of a circular model, the values of minimum cohesion when the inner diameter was 10.0 m was almost three times as large as the one when the inner diameter was 6.0 m. In the case of the square model, the minimum cohesion of the model when the corresponding diameter was 10.0 m was almost twice as large as the one when the corresponding diameter was 6.0 m. That is, a larger diameter of the ore pass is effective for avoiding hang-ups. As for the initial height H0, when the initial height became smaller, the minimum cohesion tended to take larger values. This means that a small initial height - that is, a small amount of ore storage - is preferable to avoid hang-ups at the straight part. The authors conducted interviews at a limestone mine about the occurrence of hang-ups. In that case, hang-ups occurred at the straight and vertical part of the ore pass, even though the exact location of the hang-up was not detected. Since then, the stored ores in the ore pass were reduced (making the initial height smaller), and, subsequently, a hung-up has not occurred. The simulation results are consistent with this phenomenon.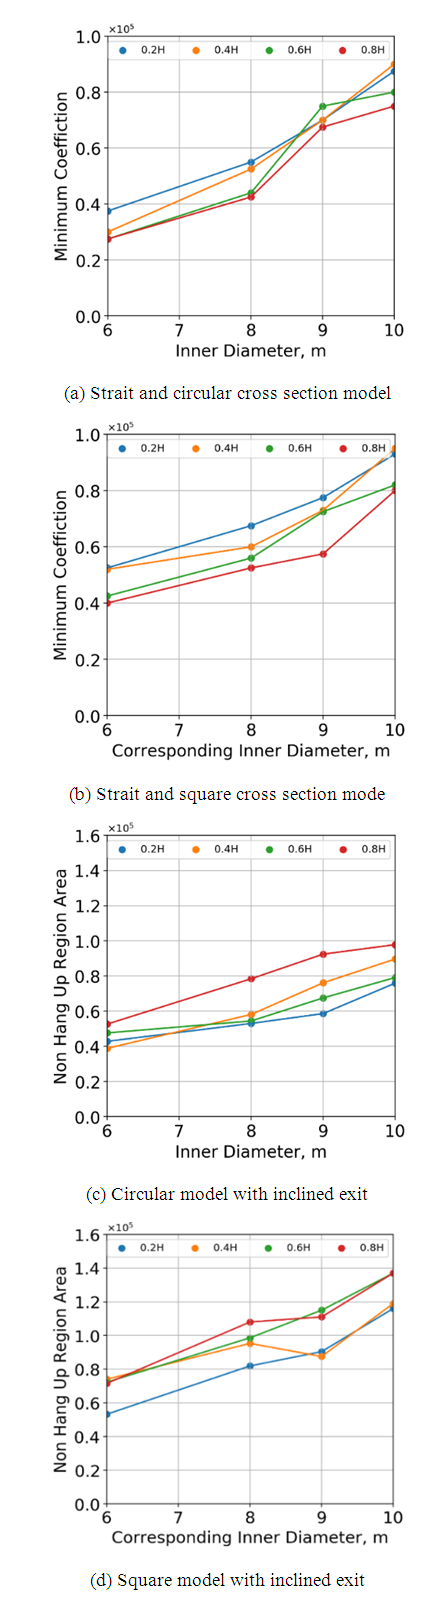 | Figure 13. The relation between minimum condition of hung-up and size of ore paths |
In the case of models with chutes, the results show a different tendency from straight models. When the initial height is larger, the area of no hang-up region becomes larger. In these models, ores have to pass through the chute. Here, the friction between ores and slopes is the crucial factor of hang-ups. When the initial height becomes larger, the overburden becomes larger, and the force pushing ores along the slope becomes larger. As a result, the cases in which the initial height H0 is larger seldom cause hang-ups compared with the cases with a low initial height.
4. Simulation of Hang-up Elimination
As is well known, once an ore pass hang-up occurs, it can cause extensive damage during mining operations, because the ore supply is interrupted. Moreover, considerable labor is required to eliminate hang-ups. At Japanese limestone mines, a large amount water is poured into the ore pass from the top. However, Japanese limestone mines are mainly located in mountainous districts, and a large amount of water has to be carried to the open pit by tank trucks, because these places generally lack sufficient water sources. Even though hang-ups can be eliminated by pouring water into the ore pass in many cases, it takes a long time until the elimination is complete. In cases where the hang-ups cannot be eliminated by pouring water, a method of giving oscillation to the ore pass, such as blasting, is considered. The mechanism of hang-up elimination by pouring water is still unclear. Reducing the friction coefficient by water or reducing cohesion by washing out adhesive materials between ores are done to eliminate hang-ups. This phenomenon can be simulated by reducing the friction coefficient and cohesion of the models in which hang-up occurs, and the elimination of hang-ups was confirmed. It is also possible to give oscillation to the model in DEM analysis. Here, oscillation was given to the model in which hang-up occurs, and the elimination of hang-ups was confirmed.
4.1. Reducing the Value of The Friction Coefficient and Cohesion
An example in which the hang-up was eliminated by reducing the friction coefficient and cohesion is shown in Figure 14. This is the flow-out and hang-up map of the straight and circle model with an 8.0m diameter. In this map, the combination of  = 0.28 and c = 0.65 × 10⁵ N/m2 is located in the hang-up region. After hang-up was simulated, the model was saved once, and then the values of the friction coefficient and cohesion were reduced to
  = 0.15 and c = 0.12 × 10⁵ N/m2, respectively. As a result, hang-ups were eliminated, and all particles flew out in the model. The same procedures were also conducted for other models in which hang-ups occurred, and it was confirmed that hang-ups were eliminated in all cases. This means that this can be a method of hang-up elimination if it is possible to reduce the values between ores in a way other than pouring water.
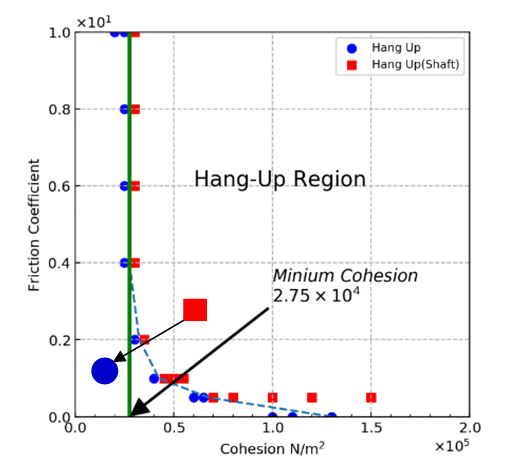 | Figure 14. Reduction of friction coefficient and cohesion in order to eliminate a hung-up |
4.2. Giving Oscillation
Here, a sine wave that has various amplitudes and cycles was applied in the model in which hang-ups occurred, and the elimination was confirmed. The relation between the combination of amplitudes and cycles and the hang-up elimination is summarized in Figure 15. Here, plots represented by a blue circle represent the combinations with which hang-ups were eliminated, and plot × represents the case in which hang-ups were not eliminated. As the figure shows, when the high-frequency waves were used in the hang-up model, hang-ups were eliminated by a relatively small amplitude. However, when the frequency was less than 5 Hz, hang-ups were not eliminated in many cases. When it is possible to use oscillations at mines, high-frequency waves are preferable for eliminating hang-ups.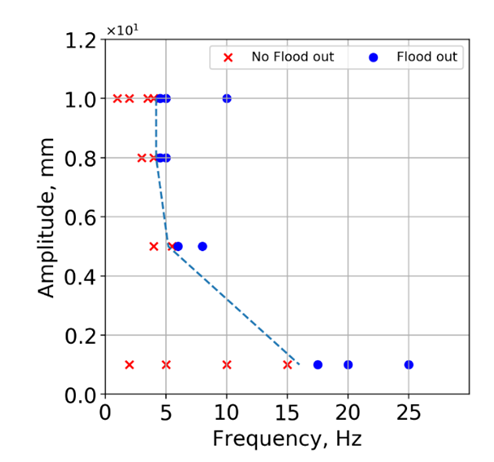 | Figure 15. Relation between amplitude and frequency of wave which can eliminate hung-ups |
5. Conclusions
To understand the hang-up phenomenon in long vertical ore passes, 3D-DEM was applied, and hang-ups were simulated using several ore pass models that used different sizes, different cross-sectional shapes, and flow-out exit under various values of cohesion and friction coefficient and under different initial heights H0. The conclusions obtained in this study are as follows.(1) The hang-ups could be simulated in all cases, and the forms of hang-up depend on the conditions. In the case of a straight model, particles formed an archlike shape and hang-up occurred in the middle of the straight part. In the circle and square cross section models, this form was almost the same. (2) However, hang-ups occurred at two different places in the case of models with a chute. One is the same as in the straight models, that is, hang-ups occurred at the straight part of the models. The other is the case in which hang-ups occurred at the chute near the exit.(3) The conditions between cohesions and friction coefficients were summarized as hang-up and flow-out maps. Certain minimum values that cause hang-ups existed in the case of the straight models. Therefore, by taking a smaller value of cohesion than the minimum value, it was possible to avoid hang-ups.(4) Hang-ups hardly occurred when the cross-sectional area of the ore passes became larger. As for the differences of cross-sectional shapes, a square cross section was preferable to avoid hang-ups in both the straight models and the models with chutes.(5) A lower initial height H0 was preferable to avoid hang-ups. This tendency coincided with the onsite examples. However, a higher H0 was preferable in the case of models with chutes, because the ores were pushed out at the chute because of a higher overburden.(6) The values of cohesion and the friction coefficient in the hang-up region were reduced to the values in the no-hang-up region in the hang-up and flow-out maps. It was confirmed that hang-ups were eliminated in all hang-up cases. (7) It was also confirmed that giving oscillation to the models in which hang-ups occurred was efficient for eliminating hang-ups.
References
| [1] | Limestone Associate of Japan website, https://www.limestone.gr.jp/introduction/index.htm. |
| [2] | Jenike AW., Gravity Flow of Bulk Solids. Salt Lake: Univerisity of Utah; 1961. |
| [3] | Kvapil R., Gravity flow of granular materials in hopper sand bins in mines - II. Coarse material., Int J Rock Mech Min Sci. 1965: 2. |
| [4] | U.S. Department of Health and Human Services, Analysis of hangups and structural failure in underground mine pre passes, Technology News NIOSH, 1998, No.470. |
| [5] | Szwedzicki, T, Formation and removal of hang-ups in ore passes, Mining Technology, 2007; 116, Issue 3. |
| [6] | Hadjigeorgiou J, Lessard JF. Strategies for restoring material flow in ore and waste pass systems. Int J Min Reclam Environ. 2010; 24: 267-282. |
| [7] | Ngidi, S. and Boshoff, P., Cave management and secondary breaking practices at Palabora mining company, 6th Southern African Base Metals Conference 2011, 2011: 209-220. |
| [8] | Baiden, G., Robotic-hang-up assessment and removal of rock blockages in mining operations using vertical reality gaming for safety, Proceedings of Seventh International Conference & Exhibition on Mass Mining-Massmin ? 2016, 2016, Paper number 228. |
| [9] | Hambley DF. Design of ore pass systems for underground mines. CIM Bull.1987; 897:25 - 30. |
| [10] | Thanh Vo, Hongwei Y, Adrian R. Russell, Cohesion and suction induced hang-up in ore passes, Int J of Rock Mech Min Sci 2016: 87: 113? 128. |
| [11] | Sato A and Tang H, Effect of cross-sectional shapes of vertical ore passes on ore pass hang-ups by 3D-DEM, Proceedings of 10th Asian Rock Mechanics Symposium ARMS10, (2018), Paper No.40. |
| [12] | Hadjigeorgiou J, Lessard JF. Numerical investigations of ore pass hang-up phenomena, J of Rock Mech Min Sci 2007: 44: 820-834. |
| [13] | Sato A. and Obara, Y., Blockage simulation of vertical ore pass for ore carry-out by discrete element method, Journal of MMIJ, 2014:130:421-427. |
| [14] | Sato A. and Obara Y. Analysis of Ore Blockages in The Vertical Shaft at Open Pit Mine by Discrete Element Method, ISRM CONGRESS 2015 -Innovations in Applied and Theoretical Rock Mechanics-, 2015:Paper No. 146. |
| [15] | Cundall P.A., Formulation of a three-dimensional distinct element model? Part 1. A scheme to detect and represent contacts in a system composed of many polyhedral blocks, Int. J. Rock. Mech., Min. Sco. & Geomech. Abstr. 1988: 25: 107-116. |
| [16] | Hart, R., A. Cundall and J. Lemos, Formulation of three-dimensional distinct element model - Part 2. Mechanical calculations for motion and interaction of a system composed of many polyhedral blocks, Int. J. Rock. Mech., Min. Sco. & Geomech. Abstr. 1988: 5: 117-125. |

 Abstract
 Reference
 Full-Text PDF
 Full-text HTML