E. C. Merem1, Y. Twumasi2, J. Wesley1, M. Alsarari1, S. Fageir1, M. Crisler1, C. Romorno1, D. Olagbegi1, A. Hines3, G. S. Ochai4, E. Nwagboso5, S. Leggett6, D. Foster1, V. Purry1, J. Washington1
1Department of Urban and Regional Planning, Jackson State University, Jackson, MS, USA
2Department of Urban Forestry and Natural Resources, Southern University, Baton Rouge, LA, USA
3Department of Public Policy and Administration, Jackson State University, Jackson, MS, USA
4African Development Bank, AfDB, Avenue Joseph Anoma, Abidjan, Ivory Coast
5Department of Political Science, Jackson State University, Jackson, MS, USA
6Department of Behavioral and Environmental Health, Jackson State University, Jackson, MS, USA
Correspondence to: E. C. Merem, Department of Urban and Regional Planning, Jackson State University, Jackson, MS, USA.
| Email: |  |
Copyright © 2019 The Author(s). Published by Scientific & Academic Publishing.
This work is licensed under the Creative Commons Attribution International License (CC BY).
http://creativecommons.org/licenses/by/4.0/

Abstract
In a country where ground water ranks highly as one of the nation’s most important natural resources, water stands out as a strategic item in the US West. For that, agricultural, commercial and urban communities require water for their yearly operations. Even though, groundwater serves cities and rural areas, it sustains irrigation and industries. The present levels of ground water deposit are not only at risk of over use and degradation, but in the past several years, the Western region continues to experience depletion of some of its major sources with declines occurring faster than surface water amidst grave consequences. Furthermore, in some neighboring states, water depletion has reached a critical stage with mounting threats to communities. Because over pumping of ground water sources created declines in water tables, without access to regular information on water stress and usage, managers face uphill tasks tracking the risks involved. While this issue emanates from socio-economic and physical elements including climate, the literature is sketchy on a comprehensive regional analysis. To fill that void in the literature, the paper assesses water resource issues in the US Western region using mix-scale techniques of GIS and descriptive statistics. With emphasis on the issues, water use trends, factors, impacts and efforts. While the results point to changes in water use, widespread depletion and visible impacts due to socio-economic indicators, policy and natural forces. The GIS mapping of the trends reveals the pressures to water security from various stressors (drought, depletion and the encroachment of urbanization and water intense farms) across the region. The Suggestions for mitigation ranged from the need for monitoring, sustainable use, GIS analysis, and effective policy to a regional water information system.
Keywords:
Water resources, GIS, Western region, Depletion, Factors, Over pumping, Climate, and water security
Cite this paper: E. C. Merem, Y. Twumasi, J. Wesley, M. Alsarari, S. Fageir, M. Crisler, C. Romorno, D. Olagbegi, A. Hines, G. S. Ochai, E. Nwagboso, S. Leggett, D. Foster, V. Purry, J. Washington, Assessing Water Resource Issues in the US Pacific North West Region, International Journal of Mining Engineering and Mineral Processing , Vol. 8 No. 1, 2019, pp. 1-19. doi: 10.5923/j.mining.20190801.01.
1. Introduction
In the last several years, water assets have consistently stood out in seemingly remarkable ways as one of the nation’s most important natural resources essential for various functions in the ecosystem [1]. Considering the critical essence, it provides drinking water to communities, supports industry and agriculture, and sustains streams and wetlands in urban and rural communities [2]. In the case of ground water use [3, 4], it has many societal benefits. It is the source of drinking water for about half the nation and nearly all the rural population and provides 50 billion gallons per day in support of the nation’s agricultural economy [5]. Being a country where ground water ranks highly as one of the key renewable natural assets, water stands out as a strategic item in Western US [6, 7]. For that, agricultural, commercial and urban communities require water for their yearly operations [8]. Unlike in the past, the West now supports millions of people, many in big cities [9], and all relying on this semiarid landscape to provide necessities from ample water to food. Just as groundwater serves cities and rural areas, it sustains irrigation and industries, hydroelectricity and domestic households [10]. From the demands, the present levels of ground water deposit are not only at risk of overuse and degradation, but depletion caused by sustained pumping, is a key issue associated with usage in the West [11-13]. Notwithstanding the fact that such pattern of usage overlaps with groundwater shortages across the country. The assessment of 40 aquifers nationwide indicates that beginning in the year 2000, the proportion of groundwater depletion rose intensely, with almost 25 cubic kilometers of water per year extracted from the ground. This is equivalent to around 9.2 cubic kilometers in normal extraction annually from 1900 to 2008 [14]. Accordingly, in many areas of the nation, the future of ground water resources is at risk from over use and contamination [14]. Elsewhere, groundwater resources in the South west are among the most over used in the US. In the zone, natural recharge to aquifers is little and pumping in many areas has led to declines in water tables. In the process, the consequences of large-scale removal of groundwater water from storage are becoming increasingly evident [12, 15]. In all these, the Western region continues to experience the depletion of some of its major sources with declines occurring faster than surface water with grave impacts for localities amidst climate change [16-20]. In most watersheds in the West, sectorial water demands for farming, city and industrial operations deplete ground-water assets. In that way, the pace of ground-water deficits of 100 meters has been detected and, in several areas, the declines stood at over 300 meters annually [21]. Aquifer-system compaction and land subsidence have also accompanied ground-water depletion [22, 23]. With the frequency of water stress in the zone, the West remains trapped in serious drought in the absence of little or no effective policies across the region to mitigate the situation [24, 25]. While the US Drought Monitor’s weekly update shows that California has fallen further into exceptional drought. In the past decade and half, drought has afflicted the depth of the Colorado River Basin with visible signs of depletion much evident. Current study shows that ground water in the basin is being depleted six times faster than surface water [26]. Whereas federal officials work to keep water levels high enough at reservoirs like Lake Mead and Lake Powell, in Arizona, to generate power, there is no similar strategy in place to audit groundwater supplies [27-29]. Aside from the allocation of 30% more water from the Colorado River than the available volume by federal officials all these years [30-32], all over the Western states, farmers and urban areas that rely on groundwater are already seeing declining water tables, an indication that supply is running low [33, 34].Furthermore, in some nearby states, water depletion impacts have reached a critical stage with threats to communities due to a whole range of ecological, socio-economic and physical factors [35]. Essentially, the groundwater loses affirms the unsustainability of rapidly growing population centers and water-intensive farms in the basin from Arizona to Wyoming [26, 36]. While California's Central Valley is not the only place where groundwater supplies are falling, aquifers in the Colorado River Basin are in steep declines. In 1950, in Albuquerque, several supply wells were pumped dry amidst mounting concerns [37]. From these problems, the states face declining well problems, reduced surface water flow, subsidence and deterioration of water quality at huge costs [5, 38]. The analysis of several coastal and desert states show that the water crisis created shrinking reservoirs and aquifers [39, 40]. This trend is impacting water sources like the Colorado River and Lake Mead. At the same time, no studies of mix-scale orientation [41-44], have been conducted to determine the exposure of the nine Western states to the menace of water depletion risks. In that case, water managers are now seeking better ways of managing ground water. With over pumping linked to declines in water tables, given the limited records and no access to regular information on water stress and usage in the West, managers face uphill tasks tracking the risks involved [45-48]. Thus, regional assessment is not only vital, it provides opportunities to manage critical ground-water resources. Based on the gaps, this study assesses water resource issues in the Western region with mix-scale model under five objectives. The first aim is to analyze the current issues in water resources management while the second assesses the risks of water depletion to the US Western region. The third objective measures water usage and impacts among the states and the fourth objective identifies inhibiting factors and mitigation measures. The fifth and final aim is to design a decision support tool for policy makers. The paper is divided into five parts with part one highlighting the introduction, and part two a profile of the methodology. The third section covers the results, factors, efforts and impacts while section four presents the discussion of the findings and section five offers a closure of the paper.
2. Method and Materials
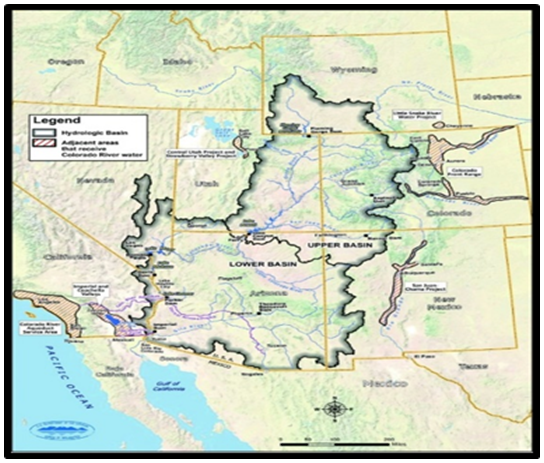
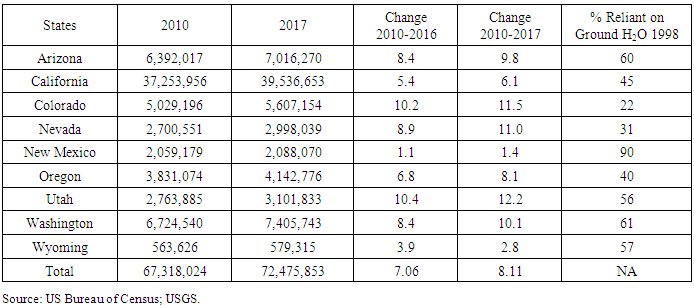
The study area located in the Pacific north west and the western part of the country contains 9 states made up of Arizona, California, Colorado, Oregon, California, Nevada, New Mexico, Oregon, Utah, Washington and Wyoming (Figure 1) [11]. With seven of the nine states members of the Colorado River Basin (Figure 1.2), the study area has a population of over 72 million (Table 1); and it traverses the Desert South west zone of the country of over 945,800.81 square miles area from Northern California to Washington [49]. Being a very large swath of area under a very complex ecology with vast tapestry of biodiversity. The environmental features of the region consist of deserts, sensitive wetlands, fish and wildlife streams, forested landscapes and farm lands. The Ecology faces huge pressures due to growing human settlements, acute water stress, and the irregular nature of climate change parameters like increased temperature, drought and other factors that have emerged as major issues [11]. Accordingly, the population pressures and demands from agriculture in the region are resulting in unprecedented development amidst volatilities from climatic forces fuelling water insecurity as manifested with rising usage from 1995 to 2010 (Table 1). 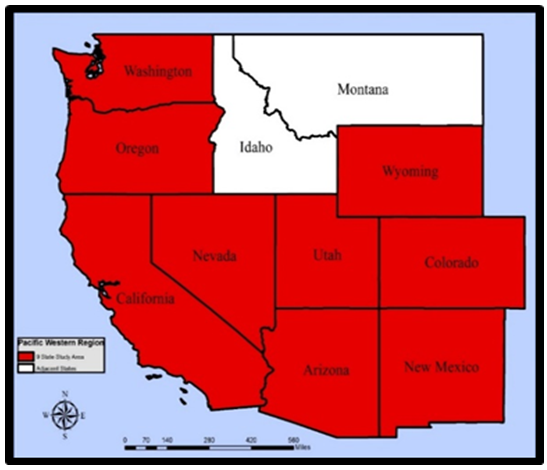 | Figure 1. The Study Area |
 | Figure 1.2. The Colorado River Basin |
Table 1. The Population of the Study Area in 2000 and the Percentage of Ground Water Dependence, 1998
 |
| |
|
Considering the seemingly harsh nature of the situation given the predicament of inhabitants of the study area, it is no longer a secret that the American West is now seeing a grave water crisis [50, 30-32]. Being the home to tens of millions of people with a vast portion of US agriculture, the region is in the second decade of recurrent drought that seems unending year after year with notable impacts [14]. While states like California received very little rain, the condition is now so critical that the farms at the receiving end of this ordeal with billions of dollars in economic damages are plundering the state's hard-to-refill groundwater aquifers at a deplorable rate [28], in lieu of overdependence and the declining levels of water budget over the years in the region [33, 34], (Table 1).In a region where the Colorado River ranks highly as the primary source of water with little intake in annual rainfall, communities at risk including Las Vegas have concerns about the falling water levels in Lake Mead [51]. Accordingly, in the past 14 years, the Colorado River Basin has experienced its worst drought since 1960 [52]. Being a major life line for more than 40 million people in the Western region, the basin supplies much of the water used for agriculture and domestic needs in 7 states [14, 30-32, 52]. Concerned about the effects of water depletion risks on the region’s ecosystem, economy and environment, assessment of water use issues stands out as a top most priority in many of the cities and states in the area. Despite a few instances of slight rains, in the area, the prospects of continual water security remain bleak. On top of that, after decades of wasteful water management policies and practices, demand on the Colorado River’s water now exceeds its supply, and storage levels at Lake Powell and Lake Mead are critically low [30-32, 14, 52]. With more dams and diversions planned in the upper basin in Colorado, where 50% of the headwater flows are already diverted. The Lower Colorado River which provides water to Las Vegas, Los Angeles, San Diego, Phoenix, and Tucson, already faces a one-million-acre-foot deficit. The sub basin also runs the risks of drying up amidst impending climate change induced reduction of 10-30% in the river’s tidal movement by 2050 [53-56].Also, the basin’s population has expanded dramatically in recent years, with most growth occurring in urban areas, where about 80% of the region’s residents live. Phoenix and Tucson, Arizona, and Las Vegas, Nevada are among the largest cities in the basin, and they use the Colorado River and its tributaries as their primary source of water. With overall population figures of 67,318,024-72,475,853 and change rates of 7.06-8.11% (from 2010-2017) above the US national average. The region has the fastest growing areas in the country [49]. Of these areas, California as the largest water user, boasts of the highest population of almost 40 million, while a quartet of other states (Arizona, Washington, Colorado and Oregon) maintained populations of over 7-4 million than the other remaining states [49].With the daily use of 372,910 MGD since 1995-2010, the states in the study area have large segments of their population that are heavily dependent on ground water sources. Even at that, the region continues to endure the challenges of ground and surface water depletion at a huge cost. As such, over the years, daily consumption as shown in Figure 1.3, continues to grow from 81,720- 93,820 MGD from 1995 through 2000 with 96,740-100,630 MGD between 2005 and 2010. This comes at the rates of 14.80%-4.02% during 1995-2000 and 2005-2010 with much of the water used up in California [57-60]. From the level of threats posed to the daily lives of communities by water insecurity given the rising population growth rates, water depletion and ecosystem stress. The use of mix scale model in that setting provides ample opportunity more than ever to assess some of the daunting challenges facing the US West.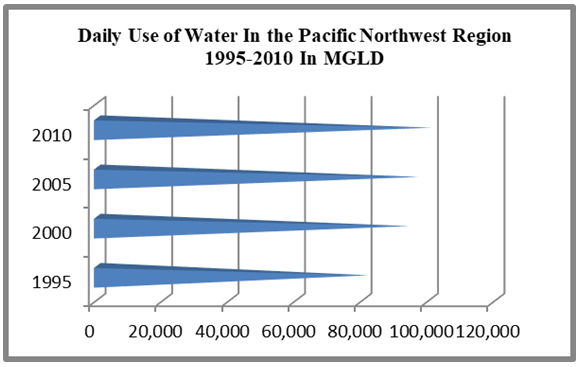 | Figure 1.3. Summary of Daily Water Use, 1995-2010 |
2.1. Methods Used
The paper uses a mix scale approach involving descriptive statistics and secondary data connected to GIS to assess the water resource problems along the Pacific North West region of the United States. The spatial information for the enquiry was obtained from several agencies consisting of the United States Geological Survey (USGS), The United States Department of Agriculture (USDA), the Government of California, the US Department of Interior, and the University of California, Irvine. Other sources of spatial info emanate from the National Oceanic Atmospheric Administration (NOAA), the United States Department of Commerce, NOAA National Weather Service, and National Centers for Environmental Information (NCEI), National Drought Mitigation Center, National Drought Integrated Information System (NDIS) and the National Aeronautics and Space Administration (NASA). In addition to that, the California Regional Water Boards, Center for Science, Economics, and Environment, Stanford University, the National Geographic Archives and the Bureau of Land Management (BLM) also provided other information needed in the research. Generally, the bulk of water depletion indicators such as well drillings, irrigation acreage and cropping relevant to the region and individual states were obtained from the state government archives of the West, Central Valley county of Tulare, the Bureau of Reclamation, the USDA National Agricultural Statistical Services (NASS), Water Education Foundation and National Research Council for some of the periods.On the one hand, the American Rivers, The National Science Foundation, the Western States Water Council and the Western Governors Association, provided the additional secondary data on the numbers, quantities, trends, deficits in water budget and the categories. On the other, the National Water Information System (NWIS), Centre of Excellence in Geospatial Information Science and The National Hydrologic Warning Council (NHWC) offered the time series data and other valuable information on hydrological assets on the major surface and ground water budgets highlighting the region. For additional data needs, the Water Information Program (WIP), The Colorado Water Resources and Power Development Authority (CWRPDA) and The South Western Water Conservation District were respectively critical in the procurement of information on the number of usages, and physical data highlighting withdrawal, changes and the consumption. In a similar vein, the United States Environmental Protection Agency (EPA), The California Irrigation Information Management System (CIMIS), The California Department of Water Resources, Natural Resources Conservation Services (NRCS), Water education foundation, National Research Council, American Rivers and the Pacific Institute remained instrumental in the provision of other relevant information. Given that regional and state, county and federal geographic identifier codes of the states were used to geo-code the info contained in the data sets. This information was processed and analyzed with basic descriptive statistics, and GIS with attention to the temporal-spatial trends at the state and regional levels in the US Western region. The relevant procedures consist of two stages listed below.
2.2. Stage 1: Identification of Variables, Data Gathering and Study Design
The initial step in this research involved the identification of variables required to analyse the extent of water use and changes at the regional level from 1995 to 2016. The variables consist of socio-economic and environmental information based on groundwater, surface water, total withdrawals, ground water percentage of total, surface water percentage of total, variations in reservoir volume, water depletion level, drought levels, changes in ground water height and water level decline. The others consist of total ground water depletion, water levels, water withdrawals by category, public supply, domestic water, irrigation, industrial, mining, thermoelectric power and percentage of population dependent on ground water variations. Added to that are the daily use of ground water, population and changes in population. These variables as mentioned earlier were derived from secondary sources made up of government documents, newsletters and other documents from NGOs. This process was followed by the design of data matrices for socio-economic and land use (environmental) variables covering the census periods from 1995, 2005 to 2010 to 2016. The design of spatial data for the GIS analysis required the delineation of county boundary lines within the study area as well. Given that the official boundary lines between the nine states remained the same, a common geographic identifier code was assigned to each of the area units for analytical coherency.
2.3. Stage 2: Data Analysis and GIS Mapping
In the second stage, descriptive statistics and spatial analysis were employed to transform the original socio-economic and ecological data into relative measures (percentages, ratios and rates). This process generated the parameters for establishing, the extent of water consumption, withdrawals, depletion, the populations served the categories served, the sources of water extracted, and the depletion of water reservoirs precipitated by over use, and the trends across the Western region for each of the nine states through measurement and comparisons overtime. While the spatial units of analysis consist of states, (sub) regions, shorelines, and counties and the boundary and locations where over extraction of ground water flourished. This approach allows the detection of change, while the graphics highlight the actual frequency and impacts, water depletion and the intensity of consumption and the trends as well as the ecological and economic costs. The remaining steps involve spatial analysis and output (maps-tables-text) covering the study period, using Arc GIS 10.4 and SPSS 20.0. With spatial units of analysis covered in the nine states (Figure 1), the study area map indicates boundary limits of the units and their geographic locations. The outputs for each state were not only mapped and compared across time, but the geographic data for the units which covered boundaries, also includes ecological data of land cover files and paper and digital maps from 2002-2014. This process helped show the spatial evolution of location of various levels of usage, and the trends, the ensuing socio-economic and environmental impacts, ecological degradation as well as changes in other variables and factors driving water depletion and the impacts in the study area.
3. The Results
This section of the paper focuses on temporal and spatial profile of water resource trends in the study area among different sectors and categories. There is an opening focus on the investigation of water use among the states based on descriptive statistics, assessment of depletion and other threats under different cases. The other parts highlight the impacts of depletion in various ecozones. This is followed by GIS mappings and the elements responsible for water stress and the mitigation efforts.
3.1. Water Use among the Nine States 1995-2010
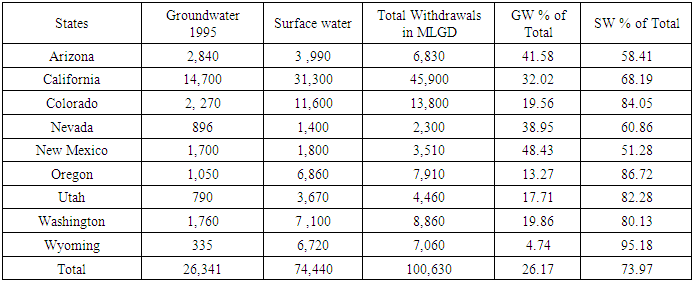
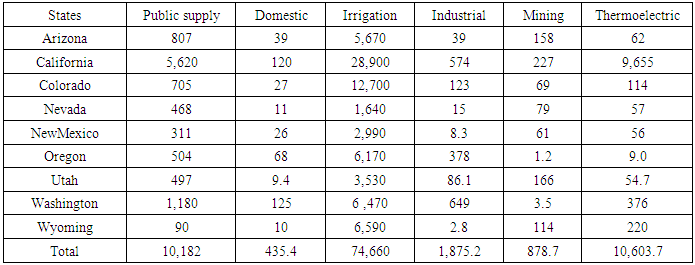
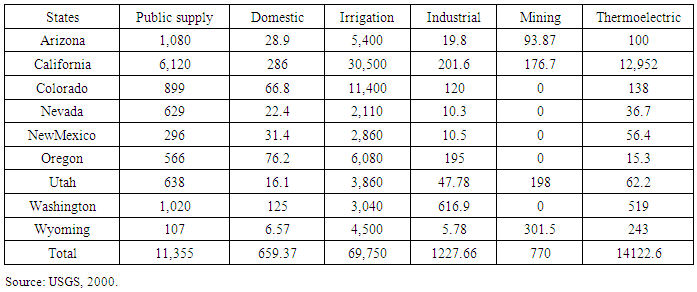
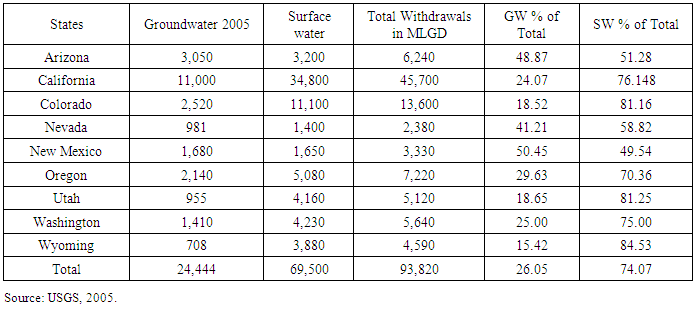
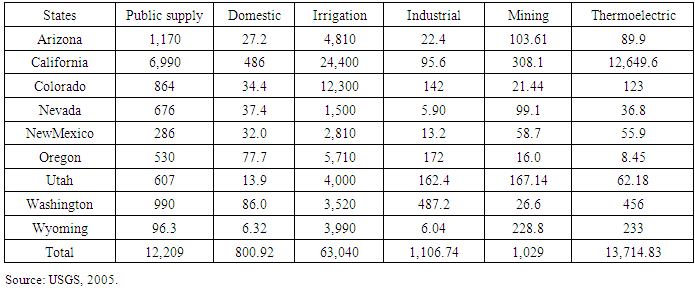
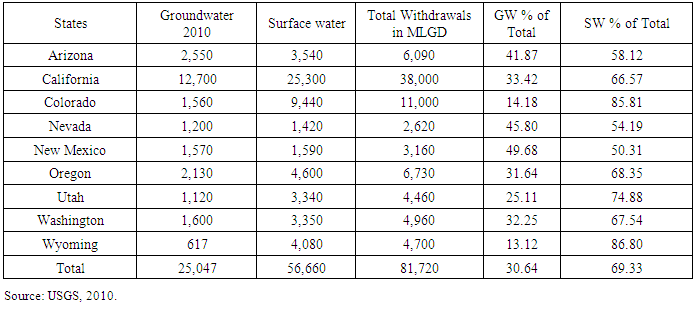
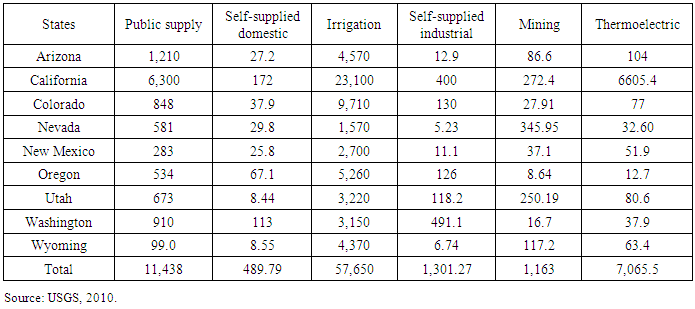
In the context of water usage in the nine states, in 1995-2005, the daily ground, surface water and the total withdrawals went from 26,341,74,440-100,630 million gallons daily (MGLD) in 1995 (Table 2); and continued at 31,874, 65,253 to 97,117 MGLD in 2000 (Table 3). Breaking down the consumption patterns in water use along different sectors made up of public supply, domestic, irrigation, mining and thermoelectric power. The study area in the opening years saw notable fluctuations in hydrologic assets as public supply water and domestic use soared by 10,182-11,355 and 435.4-659.37 MGLD by 1995 to 2000 (Table 2.1-3.1). With time, irrigation, industrial facilities, mining and thermoelectric power usage of water vacillated at different levels (74,660-69,750 and 1,875.2-1227.66 to 878.7-770 and 10,603.7-14,122.6 MGLD) (Table 2.1-3.1).Stepping further into the other years (2005-2010), ground, surface and total water consumption in the 9 states of the Pacific North west region, stood at 24,444,69,500 and 93,820 MGLD in 2005 and by 2010, the use level continued at 25,047- 56,660 to 81,720 MGLD (Table 4-5). Under the sectorial axis, while the principal users listed as domestic, irrigation, industrial, mining and thermoelectric power consumed appreciable quantities of water in their daily functions in 2005 (Table 4.1). By the fiscal year 2010, the use of hydrological assets reached 11,438-489.79, 57,650, -1,301.27 and 1,163-7,065.5 MGLD (Table 5.1).Regarding the distribution among the individual states in the region, it is worth noting that in the period 1995, California outpaced the rest of its neighbours. In a ranking order, California stood firm at number 1 in the use of all major hydrological assets (ground water, surface water, and the totals) during the fiscal year 1995 (Table 2). In other words, California held on to the top spot alone in most of the categories by source from ground water to total pumpage of 14,700, 31,300 to, 45,900 MLGD receptively (Table 2). In the second group of states, except for ground water distribution where the dominance of Arizona and Colorado was evident with 2,840 to 2, 270 MLGD, the volume of surface and total water use for Colorado at 11,600 and 13,800 MLGD, puts the state on the second spot ahead of the others as represented on the listing.Moving further on to the middle of the listing on groundwater source, note the trio of states most notably New Mexico, Oregon and Washington with water withdrawal levels of over 1,700, 1,050 and 1,760 MLGD. The others consist of Nevada, Utah, and Wyoming where the ground water levels ranged from 896, 790 and 335 MLGD in 1995. In terms of surface water, the states of Oregon, Washington, and Wyoming finished on the low medium levels (6,860, 7,100, and 6,720 MLGD) as a quartet of others led by Arizona, Utah, Nevada, and New Mexico took out notable levels of surface water (3,990 to 3,670 MLGD and 1,400 to 1,800 MLGD). As for the tally for water withdrawals, once again Washington, Wyoming, Oregon, and Arizona listed in the third class of states on the ranking, posted significant volumes (8,860 MLGD, 7,060, 7,910 and 6,830 MLGD) while Nevada, New Mexico and Utah on the lower end of the listings, accounted for 2,300, 3,510 to 4,460 MLGD of water individually (Table 2).The amount of total withdrawals by use category from public supply to the thermometric for 1995 shows the state of California single handily took out more water in the order of 5,620, 28,900 and 9,655-227 MLGD destined for major areas of public supply, irrigation and hydroelectric and mining compared to the others. The consumption levels for California in the other use categories during the same period, involves comparatively lower volumes (120 to 574 MLGD) consumed in domestic households and the industries where the state finished behind Washington both times. Under public water supply, a group of three states made up of Washington, Arizona and Colorado withdrew slightly identical amounts of water (1,180, 807, 705 MLGD). The remaining withdrawals in the mid and low hundreds MLGD for Nevada, New Mexico, Oregon, and Utah surpassed Wyoming’s public water supply estimated at minuscule levels of 90 MLGD. The same trend holds for the total amount of water withdrawals estimated at 39 to 10 MLGD in domestic households in majority of the states from Arizona to Wyoming. Apart from the three states (Nevada, New Mexico, and Utah) in the desert ecozone with irrigation water use levels in the low thousands (1,640, 2,990 to 3,530 MLGDs). The states of Washington, Wyoming, Oregon and Arizona allocated about 5,670 to 6,590 MLGD towards irrigation farming in 1995 while Colorado’s extraction of 12,700 MLGD in irrigation water ranked as the second largest in the region after California. In terms of mining and thermoelectric water removals among the rest of the states, the quantity used seemed quite negligible when compared to higher volumes in California during the same period in 1995 (Table 2.1).In the fiscal year 2005 again, California as the biggest user in the region extracted 11,000 to 34,800 MLGD in both ground and surface water which rounded out at a total of 45,700 MLGD. The state of Colorado followed up at the second level ahead of the other remaining states with 2,520 to 11,100 and 13,600 MLGD in the user category of underground, surface, and total flows. In a similar vein, the states of Arizona and Oregon took out a total of 6,240 to 7,220 MLGD alongside varying amounts of spring and surface water (3,050 to 3,200 MLGD and 2,140 to 5,080 MLGD) in 2005. Over time, the distribution of entire water extraction volumes among the states of Utah, Washington and Wyoming hovered around 4,590 to 5,640 MLGD coupled with ground and surface water amounts of 708 to 4,230 MLGD respectively. Nevada and New Mexico extracted 2,380- 3,330 MLGD in total water use with appreciable ground and surface water removals mostly in the low thousands (981 to 1,680 and 1,400 and 1,650 MLGD) (Table 4).Just as in the previous years, California’s water withdrawal levels of 6,990 to, 486 MLG, 24,400 and 308.1 to12,649.6 MLGD under four of the five listed categories (public, domestic, irrigation and hydro) exceeded the rest of the states in the study area substantially in 2005. In the area of public supply, Arizona, Washington and Colorado emerged as the next group of major water users (1,170, 990, 864, MLGD). During the same period, the four nearby states (Nevada, New, Oregon, Mexico, and Utah) withdrew 676 to 286 MLGD and 530 to 607 MLGD of water to meet public needs. The volumes of households and industrial extraction of water among the states once again reaffirmed the slight dominance of Oregon and Washington in that category whileColorado once more devoted a whopping 12,300 MLGD of water towards irrigation. This surpasses the amounts of irrigation water (4,810 to 5,710 MLGD) used in the same year by Oregon and Arizona. Elsewhere in the other states, Utah, Washington and Wyoming sprinkled 3,990 to 4,000 MLGD in irrigation water, as usage faded in arid Nevada and New Mexico (1,500 to 2,810 MLGD). Elsewhere, mining and thermoelectric power use of water shows sizable withdrawals of 228.8 to 233 MLGD for Wyoming in both categories. At that time, the high use of water for mining activities reached important levels (103.61 to 167.14 MLGD) in Arizona and Utah as Washington’s use of 456 MLGD of water in thermoelectric power confirms the state’s hydroelectric potentials in the Pacific North West region (Table 4.1).In the years gone by, the situation in 2010 reveals sizable water withdrawals among the states in the study area. California’s opening allocations of 12,700 to 25,300 MLGD in ground and surface water, and 38,000 MLGD in total extractions remained second to none once again. Colorado listed as the number two with 11,000 MLGD in total withdrawals took out 1,560 to 9,440 MLGD in surface and ground water. The third group of states Arizona and Oregon with combined totals of 6,090-6,730 MLGD also met their water needs in 2010 by drawing from existing sources (2,550 to 2,130 MLGD and 3,540-4,600 MLGD) of ground and surface water. The rest of the areas from Nevada to Wyoming lived on 2,620-4,700 MLGD in overall water use during the same period in 2010 (Table 5).In 2010, the state of California logged in more water use in most of the use categories. In that year, California used up 6,300 to 172 MLGD for public and domestic purposes. With time, two of the largest users, irrigation and hydroelectricity accounted for up to 23,100 to 6605.4 MLGD, while the distribution levels for industry and mining reached 400 to 272.4 MLGD in the Golden state. Of the second-tier states, both Arizona, Colorado and Washington consumed 1,210-27.2 to 848 -37.9 MLGD and 910 to113 MLGD in public and domestic households. From the table, the volume of water (9,710 -5,260 MLGD) tied to irrigation farming in the neighbouring coastal areas of Colorado and Oregon in 2010 exceeded the withdrawal levels in five states from Nevada to Wyoming. Regarding, the distribution of water towards industrial and mining activities, four states most notably Washington, Nevada and Oregon and Colorado took out limited amount of water (491.1- 130, 126, 118.2 MLGD). In the mining sector where Nevada, Utah and Wyoming led in water use (345.95-250.19 and 117.2 MLGD) to drive industrial activities, the water withdrawals for mining stayed minuscule like in the thermoelectric sector of the other states (Table 5.1).Table 2. Total Withdrawals by Source and State 1995 in MLGD
 |
| |
|
Table 2.1. Total Withdrawals by Water Use Category 1995 in MLGD
 |
| |
|
Table 3. Total Withdrawals by Source and State 2000 in MLGD
 |
| |
|
Table 3.1. Total Withdrawals by Water Use Category 2000 in MLGD
 |
| |
|
Table 4. Total Withdrawals by Source and State 2005 in MLGD
 |
| |
|
Table 4.1. Total Withdrawals by Source and State 2005 in MLGD
 |
| |
|
Table 5. Total Withdrawals by Source and State 2010 in MLGD
 |
| |
|
Table 5.1. Total Withdrawals by Water Use Category 2010 in MLGD
 |
| |
|
3.2. Assessment of the Cases: Colorado Basin, CA, DSW, PNW
Several cases of depletion and other forms of hydrological stress as common experiences in the Western region are assessed. They consist of four areas representing a major water body, ecozones and a state where much of the risks are recurrent to the detriment of communities. Vivid insights into all these are contained in the sections below.
3.2.1. The Colorado River Basin Depletion
The Colorado River as the only major river and life line in the Southwest region servs tens of millions of people in the major metro areas of Las Vegas, Los Angeles, Phoenix, Tucson and San Diego. Added to that, close to 4 million acres of farmland rely on water from the Colorado River Basin, the majority of that are stored in Lake Mead. During the 9 years span from December 2004 to November 2013, ground water was lost at a rate of 5.6 cubic km a year in the basin. That is in conjunction to a decline of 0.9 cubic km per year from Lake Powell and Lake Mead, which contain 85% of the surface water in the basin. Even though in 2000, Lake Mead’s capacity was just about its full volume (Fig 3.1), the demand for the Colorado River’s water by the 7 US states and Mexico sharing the river, now exceeds the ten-year average supply. As a result, the level of Lake Mead has not steadily dropped over the years, at full capacity, the lake’s level is 1,221.4 feet above mean sea level. The present level of 1,080.9 feet, the lowest it has been since 1937, just after the completion of Hoover Dam, raises deep concerns in the region. In the process, from 2004 through 2013, the Colorado Basin lost nearly 53 million acre-feet of water equivalent to two full Lake Meads (Fig 3.2-3.3). Even more striking in all these, 77% of that loss or some 41 million acre-feet represents water stored underground and large enough to meet the domestic water needs for all US households [30-32, 56].
3.2.2. Reductions in California’s Groundwater
The rising incidents of reductions in California’s groundwater involves the decades of pumping ground water that has irreversibly altered the layers of clay beneath the state’s Central Valley. This led to drops in the aquifer's water storage. From all the pressures from continual extraction, the aquifer permanently lost between 336,000 and 606,000 acre-feet of natural water storage capacity [23]. The Central Valley’s major mountain water source, the Sierra Nevada has lost nearly enough water combined to fill Lake Mead. These findings reflect the extent to which California's extended drought triggered increased rates of groundwater extraction for human uses like irrigation. Added together, California's Sacramento and San Joaquin drainage basins have seen the disappearance of more than 30 cubic km of water since 2003 under huge withdrawals that occurred. In the process, initial effects suggest that, the Sacramento River basin is losing about 2 cubic km of water a year with surface water declines half of it. In the same area, the San Joaquin Basin lost 3.5 cubic km a year out of which over 75% of that went to ground water irrigation pumping in the Southern Central Valley [33].
3.2.3. Other the Desert South West (New Mexico and Arizona) and the PNW
Of the other areas in the region threatened by water stress, one need not look no further than the Desert Southwest zone and the Pacific North West axis. In the former, where communities have often felt the brunt of recurrent drought, a hydrograph revealed ground-water-level declines in the Buckman well field, which supplies water for Santa Fe, New Mexico. Even though the measurements were made between August 1988 and June 1997. At that time, water levels still showed notable declines of nearly 300 feet in the area. Further deep in the Desert Southwest, increased ground-water pumping to support population growth in South-central Arizona cities of Tucson and Phoenix area remains in full swing. This has resulted in water-level declines of between 300 and 500 feet in much of the area [5]. Additionally, the lowering of the water table depth has also precipitated the loss of streamside vegetation as documented by historical photographs. In 1999, Las Vegas, Nevada was rightfully touted as the fastest growing municipal area in the US States. However, the drawback in some places in the area over that period stems from the visible declines of ground-water levels at the depth of 300 Ft [38]. Additional evidence of water depletion comes from the 1942 image of Santa Cruz River South of Tucson, Arizona, showing stands of mesquite and cottonwood trees along the river. The image of the same site in 1989 indicated that the riparian trees have largely disappeared, as a result of lowered level of ground water [60]. In the case of declines in the Pacific North West (PNW) areas of Oregon and Washington, the PNW ground-water development of the Columbia River Basalt aquifer of Washington and Oregon caused water level skid of over 100 Ft in the area. Given the pace of development in the zone, much of the water were used for irrigation, public-supply, and industrial enterprises in the Washington and Oregon areas [40].
3.3. The Impacts of Water Problems in the West
The extent and forms of water depletion over the years in the US Western region left on its wake unimaginable consequences that continues to rattle communities in the area. While these impacts as manifested are felt in different ways in the states. The water situation in the study area has had a major bearing on the domains of policy and practice, economy and the physical environment with notable impacts.
3.3.1. Policy and Practice
The rising threats of water depletion and the constraints it unleashed on the policy side of governance in the state of California has convinced local regulators to beef up actions that influenced current practices. Convinced about the urgent need to steer the existing laws into efficient outcomes, California imposed water rationing out of genuine concerns that the epic drought will cost farmers about $2.2 billion. This comes after the California’s $46 billion farm industry that relies on rain and snowmelt was impacted by the loss of 17,100 agricultural workers. As a step forward, during the 2014 fiscal year, the state’s Governor called for a crackdown on excessive withdrawal of various water uses among the populace. For that, the legislators of California proposed bills that would give the state more authority to monitor and regulate groundwater withdrawal. In response, a few states in the Western US are now changing their policy approach due to water depletion in the region [28]. In 1980, Arizona passed the Groundwater Management Act, which created five tightly regulated basins’ rules which limits groundwater pumping in the state [26].
3.3.2. Economic Costs
The economic costs of declining water tables in the Western region especially in the state of California are quite evident in area. With little irrigation through network of canals during these periods, farmers are pumping ground water at much higher pace to sprinkle their crops. For that, groundwater usage accounted for 53% of farmers’ water needs in 2014, an increase of 31% in a typical year at dollar costs [28]. Despite the crisis, groundwater pumping as a substitute for decreased surface water supplies is important for farmers in a region experiencing regular scarcity. Because most groundwater reserves replenish slowly in the face of the severe drought that occurred during 2015 to 2016, farmers and city dwellers at that time, paid the price. In most of the periods, the costs that are often passed on to consumers came in the form of severely depleted water supplies, and through rising energy costs to power the hydrological pumps. In these circumstances, some farmers ended up paying 3 times the amount ($1,000 to $2,000) for an acre-foot of water in a way that raised operational expenses above the 2009 levels. Further, due to the anxiety geared at avoiding losses during that time, farmers in 2016 who took away 410,000 acres of land out of production, abandoned water-intensive crops like cotton just to cut their costs [14].
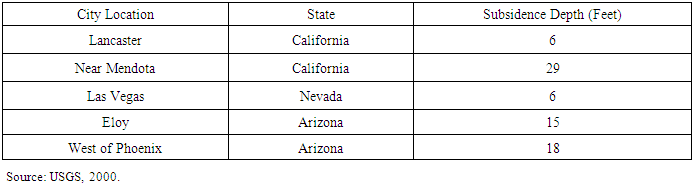
3.3.3. Physical: Subsidence
The physical and environmental effects of water over use involves various elements, but the one that is often felt in the built and natural environment comes in the form of subsidence or land collapse. As at 2000, three states in the Desert South west zone saw 74 cases of subsidence at average of 14.8 [12] (Table 6). The rising threats of over pumping of groundwater water and the stress induced by drought are causing land to sink in the South west region. With communities scrambling for water during recurrent drought and drying wells. The desperate pumping of groundwater in response to the drought are making land in the San Joaquin Valley sink faster by 5cm monthly. Table 6. The Distribution of Subsidence in the Desert South West
 |
| |
|
Because of increased pumping, groundwater levels are reaching record lows of up to 100 feet lower than previous records. The sinking is occurring rapidly at a faster pace, putting infrastructure on the surface at a growing risk of huge monetary damages to the detriment of communities. Accordingly, along the Antelope Valley, on the Western end of the Mojave Desert in Southern California, the proportion of water deficit surpassed 300 feet in various localities between the 1900s till the present [35, 5]. For that, all through the periods 1930-1992, the presence local land subsidence levels of 6 feet as grave hazards, resulted in the destruction of public infrastructure such as roads, buildings, and others in the area.
3.3.4. Pollution Hazards from Salinity
The water quality problem that has grown in importance within the Colorado River as part of the impacts is salinity, or the volume of solids (mostly salt) left in the water. Since several sources bring the dissolved salts into the river, the salts flow as part of natural process from soils and rocks. When river water is used for irrigation amidst the unprecedented stress, some salts evaporate, and become concentrated in the remaining water flowing back to the river. Also, the salt problem is caused by evaporation from reservoir surfaces and water use by plants along the river. The concentration of salt in the water of the lower river valley is so high that it cannot be used for human consumption without treatment. As a result, a desalinization plant near the border with Mexico removes salt from the river and allows the US to provide Mexico with usable water. In that way, significant water quality problems occur in the Colorado River Basin, primarily because the river carries an estimated 9 million tons of salts annually. This amount is expected to increase in the future because of increased human use and to compound all that, the Lower Colorado River contains about 2,000 pounds of salts per acre-foot. Part of the reasons stems from the fact that salinity increases downstream primarily owing to agriculture, evaporation, and the leaching of salts from soils. High salinity levels also originate from several tributaries, especially the Virgin River that flows through Arizona into Nevada [51].
3.4. GIS Mapping and Spatial Analysis
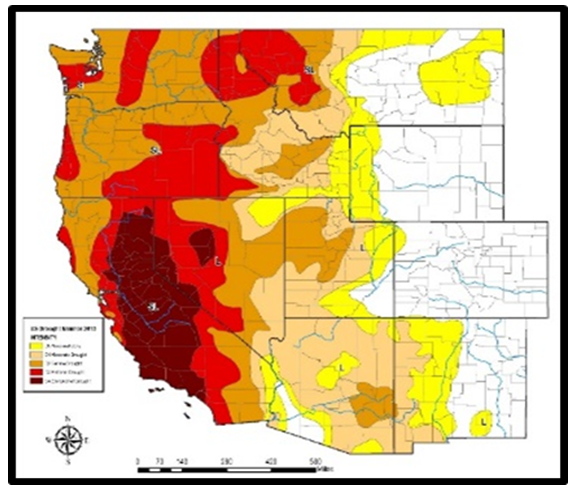
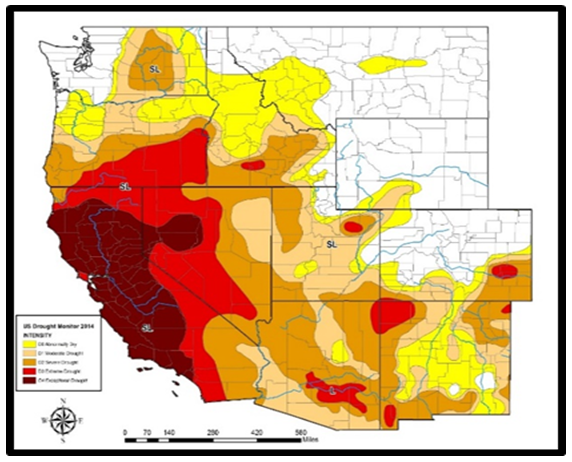
The mapping of various aspects of water stress in the Pacific North West using GIS begins with a visual display of the structure and complex patterns surrounding the Colorado basin. This includes the interactions therein between the water sources, large urban areas and water intense farming sites in different states. Added to that mix, are the spatial clusters of extreme drought events and the risks posed by depletion of aquifers and ground water in the zone. Thus, the GIS analysis, presents the dispersion patterns of the trends as manifested over the years in the South west Desert ecozone and the Pacific North West corners of the study area.The spatial distribution of the Colorado River Basin falls under the Upper and lower portions of the basin across various states. Aside from a handful of administrative and political units in their boundaries, the core natural features involve a network of tributaries running through the North, South East and Western corners of the basin alongside two major lakes most notably Lake Mead on the Lower side and Lake Powell on the Upper Axis. With the challenges of hydrological stress, the Upper side of the basin serves water to the inhabitants of Utah, Colorado and New Mexico, together with Colorado River near Colorado Springs. Other water sources running through the areas encompasses the White river in between Denver, Salt Lake City, and Colorado Springs coupled with Hams Fork River. Further down on the Upper end of the basin are clusters of tributaries or river systems including the San Juan River not far from Albuquerque, New Mexico. Stretching on to the Lower Basin are network of rivers such as Virgin River and Colorado River serving cities like Las Vegas, Nevada. In a similar fashion, the nearby Gila River and San Pedro rivers do serve the major areas from Sandiego to Tucson in the Lower south of the Basin in California and Arizona (Figure 2).Another twist to the challenges of hydrological stress comes from the convergence of water intense farming and the rapidly exploding population in urban areas adjacent to critical water sources within the basin. Beginning with spatial structure of the basin as shown on the map. Both the Lower and Upper portions of the basin and the adjoining water sources such as rivers, lakes, and their tributaries are both surrounded by clusters represented in white and black dots in space. These areas are dominated by huge urban centres, with teeming population coupled with water dependent farming operations and a network of aqueducts on the lower south of the Map. Looking at the geographic coverage heralding water intensive agriculture on the basin. The Upper Colorado River Basin side bounded by Wyoming in the North, Colorado in the Eastern side and Utah on the West share a web of water intense farming sites operating deep into major sources representing rivers and lakes, that support agricultural production in the region. On top of the heavy presence of water intense farming therein, the Colorado basin’s over used hydrological assets are stretched further thin by the big urban centers in Denver, Colorado Springs and Salt Lake City. With Arizona at the center of the Lower Basin, the water intense farming locations out there stretches right into major rivers and other water sources. This includes aqueducts and lakes in between Phoenix and Tucson and another group of canals furnishing the much-needed water to the neighbouring state of California where two global cities (San Diego and Los Angeles) are large consumers of water. The same thing can be said of the growing urban center of Las Vegas which is adjacent to Lake Mead. Further along those lines, the interesting thing to glean from the spatial distributions of the parameters on the lower Colorado Basin is that, water sources seem surrounded again by heavily populated urban centers in Nevada, Southern California and Arizona. Considering the firmness of emergent spatial patterns highlighting the intersection of urbanization and water intense farming, there is a strong correlation between rapidly urbanizing areas, water intensive farming activities and the stress on the region’s hydrology (Figure 3).The GIS mapping of the trends also points to a gradual dispersion of ground water depletion in different levels out of the western side of the map. This includes a visible spread originating from the aquifers in the Central Valley zones in California onto the Arizona alluvial plain and the Las Vegas Valley Aquifer corridor with depletion thresholds measured at 50-150 to 0-3 and 3-10 cubic km. With that came a mix of few spots on much smaller and higher scales (150-400, 10-25 and 0-3 and 3-10 cubic km) that were exposed to intense ground water stress under the depletion category, along the Denver basin in Colorado. While in that axis, Wyoming appeared to be at the receiving end of multiple phases of depletion. On the South west Desert ecozone where portions of areas are threatened by further hydrological stress, the High Plains Ogalla Aquifer in New Mexico shows patches of varying scales of ground water depletion calibrated from the highest to lower levels in the order of 150 -400 to 3-10 cubic km. Having seen that, it safe to say that, the Southwest Desert area has locations in the basins of Southern California, Arizona, and New Mexico where considerable groundwater level declines have been detected in the 150-400 cubic km range (Figure 4).Among these areas, the scales of hydrological conditions associated with well water declines, show they are standardized in four different percentile indices listed as 76-90% and 10-24% above normal and below normal followed by much above normal and much below scale of > 90% and < 10% respectively. The generic spatial distribution scale points to the occurrence of above normal well water decline types concentrated more from Washington to Oregon, Central and Southern California and onto Arizona, Upper New Mexico and Eastern Colorado. In terms of the below normal types of well water locations, based on the information on the map, they seem more intense in Southern California, much of Utah, South east Colorado and Lower New Mexico. Of the other well water decline percentile levels therein, while Northeast Washington state boasts of a few of them, Oregon in the Pacific North west have many well water decline types classified under the below normal category. Similar spatial patterns also hold in Nevada, Utah and Colorado, with slight occurrence in parts of Arizona, New Mexico and California to some degree. In that case, the highest measures of drops tagged much normal at < 10% level held solidly firm in Utah, California, portions of Nevada and New Mexico. Further along these lines on well water declines, note the slight manifestations in the states of Colorado, and Arizona in 2011 and by 2012-2013. For that, well water declining levels appeared concentrated under various forms in the eight states (Figure 5).The map in figure 6 indicates the spatial phase of accumulative groundwater shortages in the US from 1900-2002 and 1900-2008. The weights of depletion as assigned under 8 different colors fluctuated from -40 to-10 to 150-400 in cubic km units. Even through depletion has swiftly accelerated for a very long time across the nation with serious impacts on irrigation and surface water assets. The critical colors of dark red and orange as indicators of medium and highest levels of ground water depletion not only echoed the tendency in comparison to the other regions of the US. Nevertheless, many parts of California and South-central Arizona and upper and Eastern New Mexico in the study area stayed vulnerable. The distribution of the spatial scales shows the depletion levels for the 3 states in the Desert South West zone in the map at categories 50-150 to 150-400 km3 of ground water depletion. From the heavy extraction of ground water over time, the Desert southwest basin saw medium and critical depletion scales than the other areas in the study area (Figure 6).Evidence of changes in volumes did impact the surface area of reservoirs between August of 2011 to August 2014 in California's two biggest reservoirs artificial lakes, the Shasta Reservoir and Trinity Lake, together situated within 200 miles from the northwest of Sacramento, California. In as much as the channels of both reservoirs are roughly 15 miles away from each other. These reservoirs are major sources of water for irrigation farming, thermo electric power, and domestic water for households, ecological services, and flood management. With the patterns differentiated over the periods 2011 and 2014 under white and yellow colors, the spatial dispersion of the changes ranged from 53% to 47% for Shasta Reservoir and Trinity Lake on the opposite ends of the map denoted by right and left respectively (Figure 7).In the period of 2014, the geographic distribution of drought intensity due to water stress appeared distinguished under different scales from exceptional drought to abnormally dry. The counties in the state of California and a few in neighbouring Nevada were bombarded by exceptionally high drought intensity. Individually, California seems to have had a much larger exposure to exceptional drought. On the other side, extreme weather events in full force occurred on all states except for Wyoming but was felt mildly in New Mexico and Arizona on the lower side and Colorado and Utah in the East Central. Within the same time, the intensity of drought in 2014 extended further on a much larger scale onto the Southern area of California as well as Nevada and Oregon in the North West. The distribution of severe drought represented in dark yellow was so extensive that it showed a firm spread in almost every place with no occurrence in Wyoming and virtually miniscule in California during the same period. That was followed by a few scattered patches on affected counties in the South West of New Mexico, Arizona, Utah, Colorado, Nevada, Oregon and Washington. As if the physical discomforts and ecological impacts from these extreme events are not enough. The residents of US Western region and the adjoining ecosystems were never spared of further exposures to the dispersion of moderate drought and abnormally dry weather considering the damages that come with them. In the case of moderate drought, the map shows more concentration in Arizona and additional occurrences in Colorado, Utah, and Wyoming as well as the North West states of Oregon and Washington (Figure 8). As time went on in 2015, the intensity of exceptional drought faded slightly in areas affected in both California and Nevada during the previous year. The incidence of extreme drought in a similar scale remerged in California, Nevada, Oregon followed by a sudden presence in Washington with none in the rest of the states in the study area. Also, traces of severe drought in yellow held firm in California and Nevada with continual spread into Oregon, Washington and Utah coupled with a slight shade of that in Arizona. In contrast to the configuration as seen in the previous category, moderate drought and abnormal dry weather showed more concentration in Arizona, New Mexico, Utah, Colorado, Wyoming, Nevada and California (Figure 9).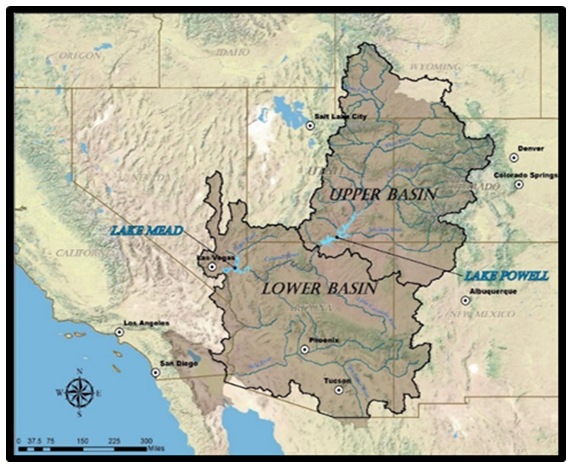 | Figure 2. Spatial Structure of the Colorado Basin |
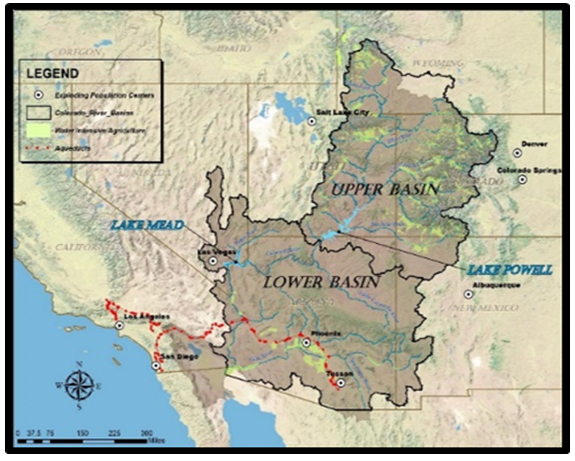 | Figure 3. Urbanization and Water Intense Agriculture Along Colorado Basin |
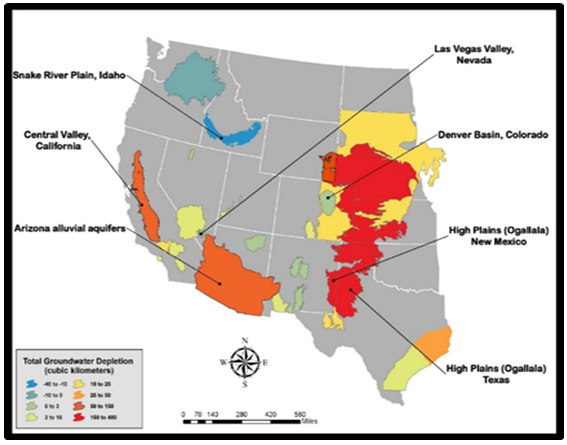 | Figure 4. The Distribution of Ground Water Depletion from Aquifers (Source: USGS) |
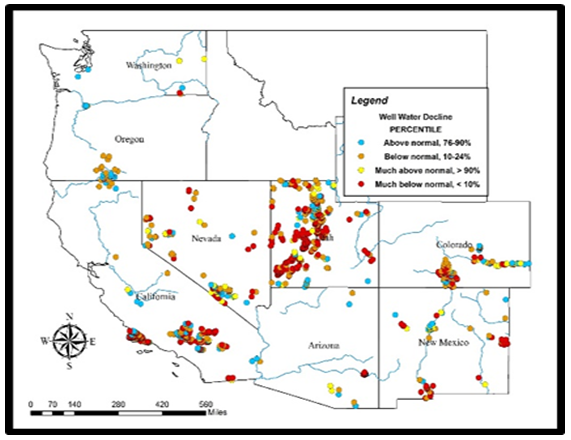 | Figure 5. Ground Water Level Decline (Source: USGS 2000, 2003) |
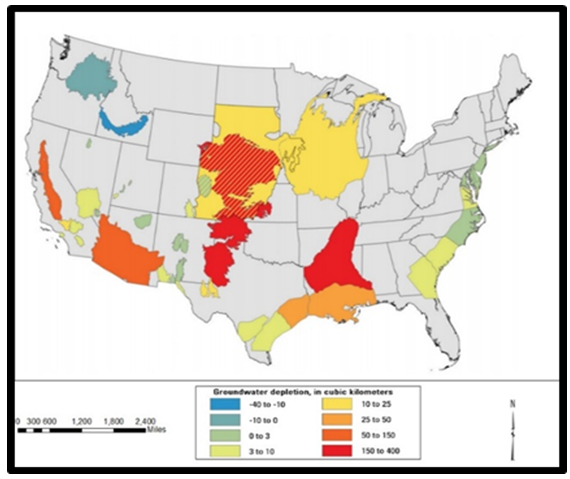 | Figure 6. Accumulative Ground Water Depletion 1900-2008 (Source USGS, 2013) |
 | Figure 7. Reservoir Depletion in California, 2011-2014 (Source: USGS and NASA, 2014) |
 | Figure 8. Drought Intensity Distribution 2013 (Source: USDA) |
 | Figure 9. Drought Intensity Distribution 2014 (Source: USDA) |
3.5. Factors Influencing Water Stress
The incidence of water stress and depletion does not operate in a vacuum in the study area. It is predicated on a set of policy, socio-economic, demographic, physical and environmental factors. These elements are noted in detail in the following paragraphs.
3.5.1. Ineffective Policies
The big problem when it comes to limiting factors is that California, incredibly, does not regulate or even monitor groundwater pumping like they do in some of the other states [32]. Against that background, the government of California has no clue about groundwater withdrawals and does not require farmers to report the amount of water they use. Perhaps no other issue is far more critical in all these than the challenges posed by the lack of data [27-29]. Considering the significance in the actual policy delivery, its absence has been hampering the other way California confronts the threats posed by drought. Being a place where the water market policy allows farmers to buy water from other growers or cities, such practices occur with little focus on mitigating depletion. With the rarity of regulation in groundwater extraction, there is very little cooperation in the Colorado basin for monitoring. All too often in these places, groundwater extraction is by far part of the local rights bestowed on landowners. In accordance with the existing laws, they the landowners can drill a well and pump as much water as they want without limitations. Under such a policy of license to over pump, there is no basin-wide view on the magnitude of changes in water volume occurring underground in the area.
3.5.2. Socio-Economic Elements and Demography
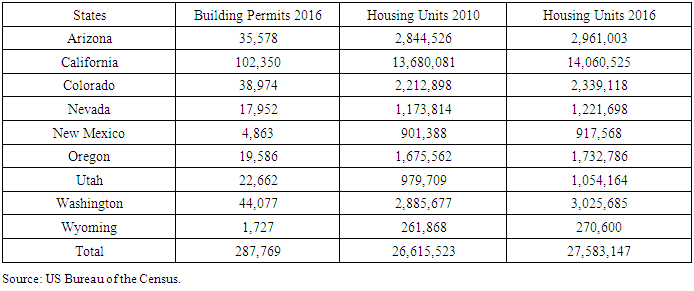
The region is heavily urbanized with over 70 M people at a growth rate of 7.06-8.11% from 2010/2016-2010/2017. As a result, the population of the area over the years surpassed the United States yearly national average at a significant rate (Table 7); [49]. Of the states in the area, California has the highest population of over 37-39 million along with a quartet of states listed in order of their rankings such as Arizona, Washington, Colorado, and Oregon. To serve a teeming population of that size, the pressures induced by the demand for housing and irrigation farming grew quite substantially. This triggered the issuance of permits for the design of new home units and industrial lay outs and farming operations in need of regular and abundant water withdrawals in their daily activities (Table 7). The influx of people in that way, meant more water extraction to sustain sectors like households, the public sector, industries and agriculture and the hydroelectricity sector to power the economy in the region. In that way, the pressures from drought, forced farmers with no access to surface water to spend millions of dollars to dig deep wells in the quest for scarce and vanishing water resources. For that, the booming demand for new water wells in Tulare County, Central Valley, California prompted the issuance of about 834 new drilling permits [28, 29].
3.5.3. Physical and Environmental Factors
At the center of the situation in the study area stands the weight of physical, environmental and hydrological dimensions as indicated by the pace of water extraction levels in the various states of the region. The daily use of 372,910 MGLD of water since 1995-2010 at an average of 93,228 MGLD, no doubt seriously impacts the available water sources. At that level over the years, the daily consumption of water continues to grow substantially at over 80,000 MLGD throughout the years [57-60]. With the ground water losses in the region linked to the unsustainability of growing population centers in the metro areas, the water-intense agricultural practices in the basin raises further challenges. In view of that, the Southwest trait as the hottest and driest region in the US does compound the fate of the communities in the zone as natural systems in the Pacific area now face climate change risks. Additionally, it has been shown that by 2050, climate change will spur groundwater deficit much faster than usual for the four economically important aquifers in the West while declining snowpack, raging wildfires, months of hot weather and dried forests threaten long-term capacity of water sources. Under such a scenario, it comes as no shock that the hydrological parameters of the Western region are now under heavy stress due physical and environmental factors. The physical and ecological factors as mentioned herein, are continually inhibiting water access and security in the Western region of the country at an alarming rate. Table 7. The Housing Data of the Study Area 2010-2016
 |
| |
|
3.5.4. Overuse of the Water in Colorado River
The threats of over extraction on the basin seems responsible for the hydrological stress there, due to over-allocation and misuse. The watershed spanning a remarkable 8 percent of the continental US drains into the sixth-longest river of the country. Up till now, inflated volumes of the river’s abundance dating back to when the Colorado River Water Compact was approved in 1922 created the basis upon which it is always in shortage. Because of ensuing decades of inefficient water management plans and activities, the extraction of the river’s water now exceeds its supply, and storage capacity at Lake Powell and Lake Mead remains drastically short. In a region where more dams and diversions are planned, particularly in the upper basin in Colorado, 50% of the headwater flows are already diverted east. Elsewhere, the Lower Colorado River, already faces a one-million-acre-foot deficit and is in danger of running dry far before the Pacific. At the same time, 7 Western states that rely on the Colorado River Basin for valuable water are drawing more heavily from the groundwater supplies than previously believed and that is threatening the region’s future access to water. About two-thirds of the water lost over the past nine years came from underground water supplies, rather than surface water [14, 30-32, 52]. For that, they are huge concerns as to how much water was depleted underground.
3.6. Mitigation Measures
Given the recurrent spells of water stress in the Western region and the forces at work, actions are being taken to the address the problems. This involves many initiatives undertaken by local, state, regional and federal entities to mitigate the discomforts brought by hydrological stress in the study area. For more on the efforts of the agencies and stakeholders bent on minimizing the risks faced by communities in the respective states, refer to Appendix 1.
4. Discussion
The enquiry highlighted the scope and form of water consumption and the prevalent depletion, the dependence of different parts of the economy on surface and ground water sources and the common issues of water security, supply and accessibility. The other essential findings in all these, comes from the connections between water security and hosts of socio-economic, physical and ecological elements made up of urban population surge in major centers across the West and rising water pumpage and pollution. To undertake the enquiry, the research utilized a mix-scale approach connected to GIS and descriptive statistics together with secondary data at the state and regional level. From what emerged in the study, the Pacific North West is a region under grave water depletion crisis. The area faces numerous challenges in water use. Despite its propensity to water stress, in 2010 the state of California logged in more water use in most of the use categories. In that year, California extracted significant volumes of water for public and domestic purposes. With California’s dominance in almost category of hydrological indicators from volume consumed to hydro-electricity. Being the largest state, it sprinkled more water for irrigation than others alongside Colorado, Oregon and Wyoming. Thus, the study area saw notable changes in water use from 1995-2010. The pressures emanating from over pumping of water left in its wake multiplicity of impacts as evidenced with the recourse to policy efforts to regulate ground water use due to over extraction as subsidence threatened public infrastructure in some parts of the West. There is also the issue of salinity that is impeding water quality and rising price of water driven by excessive pumpage. This is further manifested with the damages inflicted to the natural and built ecosystem in several of the states. In addition to that, major hydrological systems like Colorado basin and Lake Mead and the regional aquifers have been severely depleted. The GIS analysis of the patterns showed the dispersion of hydrological stress threatening water sources, the core river systems therein and the intersections between large population urban centers and water intense farming sites. Other aspects of the spatial analysis revealed the extent of water deficits and the outbreak of drought disasters in the region. Despite ongoing efforts to mitigate the challenges, the study proffered some suggestions. The suggested areas for mitigation consist of the need for effective policy, regular monitoring, the adoption of growth management measures, and improvements in water infrastructure. The others involve more use of GIS, sustainable water use and the design of a regional water information system.
5. Conclusions
The research stressed the extent of hydrological stress and the recurrent issues with insightful conclusions listed under the following rubrics: a) mix-scale approach quite effective; b) depletion caused by many factors; c) water deficit evident; d) consumption on the rise; e) impacts of the crisis apparent. In highlighting the issues of water resource use and stress in the West from 1995 and 2017, mix-scale model provided distinct steps not seen previously for planners. The applications of descriptive statistics in that mode, showed promise in the capacity of the model to detect the vulnerability of cities and states threatened by hydrological stress. Considering the scope at which GIS mapping pinpointed the spreading of ground water depletion, changes in reservoir volumes and drought intensity in various states. The picture painted so far raises alert levels that would probably drive immediate actions by managers. Also, the overall, GIS mapping was quite effective in visualizing the scale of extreme events involving droughts coupled with fluctuations in aquifer output and the quantity available. Without this type of tool, policy makers run the risk of proposing strategies built on defective logic. With these prognoses now available, planners and water users now have access to info on the risks of shrinking hydrological assets as a template for wise use in the areas facing stress. The factors impeding water usage and access in the US Pacific North West Region as shown in the enquiry do not occur in isolation; they encompass lousy policy, socio-economic elements of teeming population and urbanization, physical and environmental factors and rising pumpage in the Colorado basin. Among the elements limiting water access, ineffective policy stood out very glaringly knowing full well that a state like California with high water dependency lacks the regulatory oversight for monitoring ground water extraction, and as such, consumers do not necessarily record water withdrawal data. While policy lapses of that nature hamper the ability to contain depletion threats, there seems to be inadequate commitment towards joint monitoring among the Colorado basin states. This is compounded by the pressures on water assets by teeming population and urbanization. Added to that are the region’s exposure to both the hottest and driest extreme climate events in the country that puts hydrological parameters of the area under stress. In revealing these factors, this study reiterated its capacity in detecting hydrological stress parameters. After scrutinizing the emerging trends and the patterns of changes involving the consumption and misallocation of hydrological assets across the states over the years. The damages from depletion, transcends many areas and ongoing. In that light, the scale of deficits in the budgets of the region’s hydrological sources like the Colorado River Basin and ground water assets in California reveals notable depletions. From the pressures from various forces, water security threats are now a recurring thing ravaging the New Mexico and Arizona axis of the Desert South West ecozone coupled with the declines in the PNW states. Given what has been gleaned already during this research, the hydrological stress involving depletion surged remarkably in the West. From the gravity of what is at stake, the impacts depletion left on its wake in the Western region, now threatens the life support of the ecosystems germane to every day activity. The capacity of this study in delineating the occurrence of water deficits and associated depletion offers a rallying point for meaningful discourse through collaboration among water sharing states of the basins and others. This should address ecosystem stress caused by drought spell and the over use of water. Fundamentally, the exploitation of vast reservoir of hydrological assets in the region as presented in the enquiry involves provision of services to sustain segments of the economy and the environment from agriculture to households. Aside from the risks to water insecurity through depletion, misallocation and the potentials for efficient use and rising consumption across sectors. The Western region saw widespread extraction of its hydrological assets with pressures to both surface and ground water sources. From the rising volumes in allotment from 1995-2010, the US Western region thus has major cravings for water. The amount of water consumption therein, soared by the tens of millions from 1995 to 2000 and continued further in 2005 and 2010. The region’s allotments along sectoral lines point to a surge in civic supply and households. The compilation of water indices herein not only augments the readiness of policy makers to track usage, but it keeps the region more aware of the changing patterns and the essence of best practices. Part of the key findings that came out of this study stems from how the current approaches to water use impacted the policy making, the environment and the economy in the US western region over the years. With the presence of hydrological assets, teeming population and the emergence of large metro areas, water crisis induced by a whole range of elements, has affected every aspect of society in the region in several ways. The persistence of hydrological stress in the Western region over the years, left on its tracks notable effects that have been glaringly felt in the areas of policy and economy and the physical environment. The physical and environmental effects of the over use of water comes in the form of subsidence and salt water intrusion that threaten water quality. Displaying these dangers considering the scale of hydrological stressors, the dwindling water assets and environmental risks, ranks as a major step towards security.Bearing in mind the consumption levels in surface and water ground resources over the years, and the warning signals emanating from deficits in major water sources as shown in this study. Managers and scholars will be required to seek urgent responses to many questions that are relevant to water stress. The queries are as follows: How would future consumption levels shape water security? What is the role of extreme climate events in the changing hydrology of the West? In what way will the pressures from large urban centers and water intense farming fuel depletion? What are the effects of water over use on regional aquifers? How effective will regulatory standards across the West be in containing the problems? From these questions, there are many opportunities for research and policy to reinforce the emphasis on regional water security.
Appendix - 1
3.7. Efforts and Initiatives (Contd.) 3.7.1. Interstate Agreements and CollaborationsEven through regulation and monitoring of groundwater extraction are rare, the Colorado River basin’s surface water is apportioned precisely under the Colorado River Compact, a 1922 agreement among seven states. These seven Western states continue to adhere to these requirements in the face of ongoing water crisis in the region. Under the Colorado River System Conservation Program, the basin pays for voluntary reductions in water use – whether by fallowing farm fields or other ways. The management of Colorado River Basin water which is also overseen by federal and state authorities, in recent years, has seen collaboration among the parties improve over time. On July 31, 4 affected states (Arizona, California, Colorado and Nevada) signed an $11 million agreement with the US Bureau of Reclamation to start managing water supplies beginning in 2015 and 2016.3.7.2. Water Supply and Projections by Government AgenciesFederal government agencies like The Bureau of Reclamation and NOAA have been in the forefront of efforts towards water security. For that, the Bureau of Reclamation operates as the nation's biggest provider of water and second-main source of hydroelectric power, delivering water, converting sagebrush to luxurious agricultural land and distributing water to construct new towns and major cities in the West. On its part, NOAA has focused extensively in delivering innovative scientific expertise to combat problems of declining water via projections. NOAA also offers policy assistance for water scarcity through the National Integrated Drought Information System (NIDIS) program Center for the West.3.7.3. Water Sharing Initiatives and ConservationFor years, the Colorado Basin states were anxious about their shares of the River as early as the 1900s. Recently, growth within the state of California was viewed with concern, as burgeoning expansion meant increased water demands. The signing of the Colorado River Compact in 1922 was an important milestone in the management of the Colorado River and became the foundation for the law of the river. This compact included the 7 Colorado River Basin states, and apportioned water from the Colorado Basin states. In 1963, a US Supreme Court decision stated the amount of water to be apportioned among the lower-basin states and federal public lands. Consequently, the City of Tucson has implemented a water conservation program leading to a nearly 40-year surplus of recharged groundwater supply even if water drops are below critical levels in Lake Mead. 3.7.4. Cooperative Efforts through Regional Agencies The Western States Water Council (WSWC) as an organization since its creation, through adoption of a resolution at the Western Governors’ Conference in 1965, has always striven to fulfill its chartered purposes including the areas of water cooperation. While the emphasis and focus of the Council has changed over the years, the essential principles remain to foster cooperation among its member states, and to provide a forum for discussion of a broad spectrum of water resource challenges facing the West. The purposes of the Council also center around accomplishing effective cooperation among western states in the conservation, development and management of water resources. As part of that mandate, in 2012, the WSWC, began a cooperative effort to address a need for greater access to information from state water agencies.
Appendix – 2
Acronyms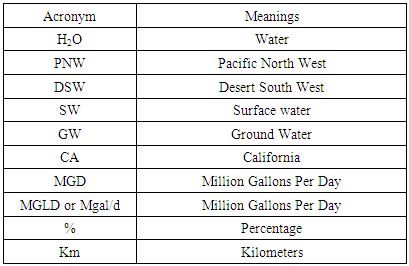
References
| [1] | Barlo, P. (2000 September). Atlantic Coastal Zone. Reston, Virginia: USGS. |
| [2] | Galloway, D.L. (2000 December). Groundwater Resources For The Future: Land Subsidence In The United States. Reston, Virginia: USGS. |
| [3] | Snead, M. (2003 October). Earthquakes-Rattling The Earths Plumbing System. Denver, CO: USGS. |
| [4] | Provost, A. (2009 November). US Geological Survey Groundwater Modelling Software: Making Sense of a Complex Natural Resource. Reston, Virginia: USGS. |
| [5] | Bartolino, J.R. (2003 November). Groundwater Depletion Across The Nation. Reston, Virginia: USGS. |
| [6] | USGS. (2001 December). Real Time Ground-Water Data For The Nation. Reston, Virginia: Office of Ground water, USGS. |
| [7] | Plummer, B. (2015 March). Can Water Markets Help Solve American West's Water crisis? VOX. |
| [8] | Barber, N. (2014 November). Summary of Estimated Water Use In The United States in 2010. Reston, Virginia: USGS. |
| [9] | Drury, S. (2014 August). Serious Groundwater Depletion In Western US. Retrieved May 5th From https://wileyearthpages.wordpress.com/2014/08/15/serious-groundwater-depletion-in-western-us/. |
| [10] | USGS. (2002 October). Fractured-Rock Aquifers Understanding an Increasingly Important Source of Water. Office of Ground Water. Reston, Virginia: USGS. |
| [11] | Merem, E.C. (2018 February). Assessing Water Resource Issues in the US Pacific North West Region. Proceedings of Mississippi Political Science Conference (MPCC). Jackson: Mississippi, February2018. |
| [12] | Leake, S.A. (2000 August). Groundwater Resources For The Future. Desert Bains of The South West. Reston, Virginia: USGS. |
| [13] | USGS. (2009). Effects of Climate Change Variability and Change on Groundwater Resources of The United States. Idaho Falls, Idaho: USGS, Department of the Interior. |
| [14] | Dimick, D. (2014 August). If You Think the Water Crisis Can't Get Worse, Wait Until the Aquifers Are Drained. National Geographic. 1-5. |
| [15] | Bawden, G.W. (2003 December). Measuring Human Induced Land Subsidence From Space. Sacramento, California: USGS. |
| [16] | Alley, W.M. (2002). Flow and Storage In Groundwater. Systems Science. 296: 557: 1985–1990. |
| [17] | Brekke, L.D. (2009). Climate Change and Water Resources Management A Federal Perspective. US Geological Survey Circular. 1331: 65. |
| [18] | Ghil, M. (2002). Natural Climate Variability. Encyclopedia of Global Environmental Change. Chichester: John Wiley and Sons. 544–549. |
| [19] | Green, T.R. (2007). Potential Impacts of Climate Change and Human Activity on subsurface Water Resources. Vadose Zone Journal. 6:3:531-532. |
| [20] | Meixner, T. (2016). Implications of Projected Climate Change for Groundwater Recharge In the Western United States. Journal of Hydrology. 534: 124. |
| [21] | Galloway, D. (2002). Ground Water Depletion and Spaced-Based Monitoring of Aquifer-System Compaction In the Western USA. Proceedings of Geological Society of America Annual Meeting. Denver: Colorado October 2002. |
| [22] | Environmental News Network. (2015 August). Impacts: Is the California Drought Causing Land to Sink. Pasadena: California Jet Propulsion Laboratory. |
| [23] | Environmental News Network. (2017). Know Your Environment Over Pumping Reduces California's Groundwater Storage. Pasadena: California Jet Propulsion Laboratory. |
| [24] | Simonetti, J. (2014). What Will Become of Groundwater in the West as the Drought Continues to Deplete this Resource? Hydrowonk Blog. |
| [25] | US Government (2014). Climate Change is Affecting Every Region of the U. and Key Sectors of the Economy, Federal report finds. US Climate Change Program. Retrieved 5th May From 2018 From www.sciencedaily.com/releases/2014/05/140506172342.htm |
| [26] | Hand, E. (2014 July). Western US States Using Up Ground Water at An alarming Rate. American Association for the Advancement of Science Retrieved 5th May From 2018 From https://www.sciencemag.org/news/2014/07/western-us-states-using-ground-water-alarming-rate. |
| [27] | Nagel, T. (2014 July). Water In The West: Understanding California's Groundwater, Stanford Report. Retrieved 5th May From 2018 From https://news.stanford.edu/news/2014/july/groundwater-lane-woods-073114. |
| [28] | Chaussee, J. (2014). California's Drought Expected To Cost State $2.2 Billion In Losses. Scientific American. |
| [29] | Howard, B. (2016 August). California Drought Spurs Groundwater Drilling Boom in Central Valley. National Geographic. |
| [30] | Postel, S. (2014 July). Groundwater Depletion in Colorado River Basin Poses Big Risk to Water Security. National Geographic. |
| [31] | Famiglietti, J. (2014 July). How The West Was Lost. National Geographic. |
| [32] | Wilson, R. (2014 July). Study: Colorado River Basin drying up faster than previously thought. Washington Post. Retrieved 5th May From 2018 From http://www2.csr.utexas.edu/grace/publications/press/20140724_WashingtonPost.pdf. |
| [33] | Environmental News Network. (2009 December). NASA Study Shows Major Groundwater Loss in California Since 2003. |
| [34] | Environmental News Network. (2014 July). Ground Water Depletion and Western US Water Supply. Pasadena, California: Jet Propulsion Laboratory. |
| [35] | Galloway, D.L. (2003). Evolving Issues and Practices in Managing Ground-Water Resources: Case Studies on the Role of Science. US Geological Survey Circular. 1247: 73. |
| [36] | Alley, W.M. (1999). Sustainability of Ground-Water Resources. US Geological Survey Circular. 1186: 79. |
| [37] | Theis, CV. (1953). Outline of Ground-Water Conditions at Albuquerque. Talk Given to Chamber of Commerce. Albuquerque, New Mexico: USGS. |
| [38] | Pavelko, M.T. (1999). Las Vegas, Nevada, Land subsidence in the United States. Reston, Virginia: USGS. |
| [39] | Winter, T.C. (1998). Ground Water and Surface Water— A Single Resource: US Geological Survey Circular. 1139: 79. |
| [40] | Burns, A.W. (1997). Sidebar 2-2—Ground-Water Resources in The Western United States-Sustainability and trends, in Western Water Policy Review Council, Water for the West-The challenge for the next century, Public Review Draft. 2.10-2.16. |
| [41] | Merem, E.C. (2017). Techniques of Remote Sensing and GIS as Tools for Visualizing Impact of Climate Change-Induced Flood in The Southern African Region. American Journal of Climate Change. 6: 306-327. |
| [42] | Merem, E.C. (2014). Analyzing Water Issues In the State of Mississippi. British Journal of Applied Science & Technology. 4: 2: 3179-3216. |
| [43] | Merem, E.C. (2012). Using Geospatial Information Systems in Assessing Water Quality in The Mid-Atlantic Region Agricultural Watershed of Maryland. International Journal of Ecosystem. 2:5: 112-139. |
| [44] | Merem, E.C. (2017). Analyzing Water Management Issues Using GIS: The Case of Nigeria. Geosciences, 7:1: 20-46. |
| [45] | Merem, E.C. (2008). Using Spatial Information Technologies as Monitoring Devices in International Watershed Conservation along the Senegal River Basin of West Africa. International Journal of Environmental Research and Public Health. 5:5: 464-476. |
| [46] | Merem, E.C. (2008). Geospatial Information Systems Analysis of Regional Environmental Change along the Savannah River Basin of Georgia. International Journal of Environmental Research and Public Health, 5(1) 281-294. |
| [47] | Merem, E.C. (2006). Hydropolitics: Case of the Niger River Basin. GIS Development: Africa, 24-28. |
| [48] | Merem, E.C. (2012). Visualization of the Rangeland Resources From Space: A Case of Sahel Region, West Africa. International Journal of Geomatics and Geosciences. 3:1: 259-267. |
| [49] | United States Bureau of the Census. (2018). Census Quick Facts. Washington, D.C: US Bureau of Census. |
| [50] | Kaufman, R. (2018 May). Water Crisis In The West. Can The Region Overcome Worsening Drought. CQ Researcher. 28:18. |
| [51] | Atkins, WA. (2018). Colorado River Basin. Retrieved 5th May From 2018 From http://www.waterencyclopedia.com/Ce-Cr/Colorado-River-Basin.html. Salinity. |
| [52] | Hudson, C. (2014 September). Colorado River Basin Sees Severe Groundwater Depletion. Earth Magazine. |
| [53] | American Rivers. (2017). The Beating Heart of The American Southwest. Washington, DC: American Rivers. |
| [54] | USGS. (2007a). Climate Variability and Change: USG S Fact Sheet. 2007-3108. |
| [55] | Bates, B.C. (2008). Climate Change and Water: Technical Paper VI of the Intergovernmental Panel on Climate Change (IPCC). Geneva: IPCC Secretariat. |
| [56] | Dragoni, W. (2008). Climate Change and Groundwater A Short Review. London, UK: Geological Society, Special Publications. 288: 1-12. |
| [57] | Soley, W. (1998). USGS Estimated Use of Water In The United States In 1995. Denver, Colorado: USGS. |
| [58] | Hutson, S. (2004). Estimated Use of Water in The United States in 2000. Denver, Colorado: USGS. |
| [59] | Kenny, J. (2009). Estimated Use of Water in The United States in 2005. Reston, Virginia: USGS. |
| [60] | Maupin, M. (2014). Estimated Use of Water in The United States in 2010. Reston, Virginia: USGS. |

 Abstract
 Reference
 Full-Text PDF
 Full-text HTML