-
Paper Information
- Paper Submission
-
Journal Information
- About This Journal
- Editorial Board
- Current Issue
- Archive
- Author Guidelines
- Contact Us
International Journal of Mining Engineering and Mineral Processing
p-ISSN: 2166-997X e-ISSN: 2166-9988
2018; 7(1): 1-13
doi:10.5923/j.mining.20180701.01

Correlations between Point Load Strength Index and Physical Properties of Hydrothermally Altered Rocks
 Abstract
 Reference
 Full-Text PDF
 Full-text HTML
Masanori Kohno1, Hiroyuki Maeda2
1Faculty of Engineering, Tottori University, Tottori, Japan
2Sapporo Technology Professional Training College, Sapporo, Japan
Correspondence to: Masanori Kohno, Faculty of Engineering, Tottori University, Tottori, Japan.
| Email: |  |
Copyright © 2018 The Author(s). Published by Scientific & Academic Publishing.
This work is licensed under the Creative Commons Attribution International License (CC BY).
http://creativecommons.org/licenses/by/4.0/

The purpose of this study was to clarify the correlation between point load strength index and several physical properties in hydrothermally altered rocks, which are typical of the soft rocks found in northeastern Hokkaido, Japan, using axial and irregular lump point load strength test specimens. The numbers of specimens tested were 3,828 rock specimens for the point load strength test. These came primarily from the earth’s surface in ancient hydrothermal fields. The rock specimens underwent point load strength test using a laboratory testing machine with specimens in dry and saturated conditions. This study clarified the decrease in strength that can be assessed by measuring the elastic wave velocity. In addition, the results suggest that future landslide and collapse potential within a hydrothermal area can be assessed based on the hydrothermal alteration type, and point load strength index change ratio.
Keywords: Point load strength index, Physical property, Hydrothermally altered rock
Cite this paper: Masanori Kohno, Hiroyuki Maeda, Correlations between Point Load Strength Index and Physical Properties of Hydrothermally Altered Rocks, International Journal of Mining Engineering and Mineral Processing , Vol. 7 No. 1, 2018, pp. 1-13. doi: 10.5923/j.mining.20180701.01.
Article Outline
1. Introduction
- The strength of fresh rocks and altered rocks, as well as hydrothermally altered or weathered rocks, is generally evaluated based on uniaxial compressive strength (UCS). However, rock core pieces for UCS tests cannot always be obtained from outcrops of faulted, jointed or cracked rock masses. In these cases, the point load strength (PLS) test is a convenient and an effective alternative to the UCS test, because it can be done promptly using on-site testing equipment with various shaped small rock specimens taken from outcrops or floats. Many researchers have already studied the relationship between the PLS and UCS of soft rocks. For example, UCS = 13 PLS [1], UCS = 13.4 PLS [2], UCS = 16.4 PLS [3]. Some researchers have obtained a correlation between the PLS index and physical properties of rocks [4-8]. On the other hand, many researchers have studied the physical properties of altered rocks [9-18]. However, there are very few reports about the correlation between the PLS index and physical properties of soft rocks. Furthermore, when we examine the relationship for real between PLS and physical properties of rocks that we sampled, we will notice that they are not necessary subject to the relationships mentioned in existing studies. Especially, with regard to hydrothermally altered rocks, we will need to do the research about the relationship between PLS and physical properties of such rocks, because there is still little data available for it. One of the reasons why the correlation between the PLS index and physical properties of soft rocks have not been established is the difficulty in collecting and testing samples because of the influence of swelling clay minerals and other factors; the other reason is that the hard rocks with relatively major occurrence are found particularly in North America, Europe, and other places. However, it is important to determine the correlation between the PLS index and physical properties of soft rocks widely found in Japan, the Pacific Rim region, and other places.The purpose of this study was to determine the correlation between the PLS index and physical properties (density, water absorption, effective porosity, and elastic wave velocity) of hydrothermally altered rocks using axial and irregular lump PLS test specimens; these altered rocks are typically soft rocks found in northeastern Hokkaido, Japan. Furthermore, we clarified the relationship between the PLS index and physical properties of hydrothermally altered rocks based on the PLS index change ratio. In addition, we have obtained a significant result by examining the relationship between the PLS index change ratio and hydrothermally altered rocks.
2. Rock Samples
- A majority of the samples were collected from the Okushunbetsu area in Teshikaga Town, Japan. Figures 1 and 2 show the geological map and distribution of hydrothermal alteration zones in the Okushunbetsu area. The geology of the sampling sites consisted primarily of the Upper Miocene Oteshikaushinai, Hanakushibe, and Shikerepe Formations, and the Upper Pliocene Shikerepeyama Lava in the Okushunbetsu area of Teshikaga Town, northeastern Hokkaido, Japan. The geology and the distribution of hydrothermal alteration zones in this district were described mainly by Maeda et al. [19].
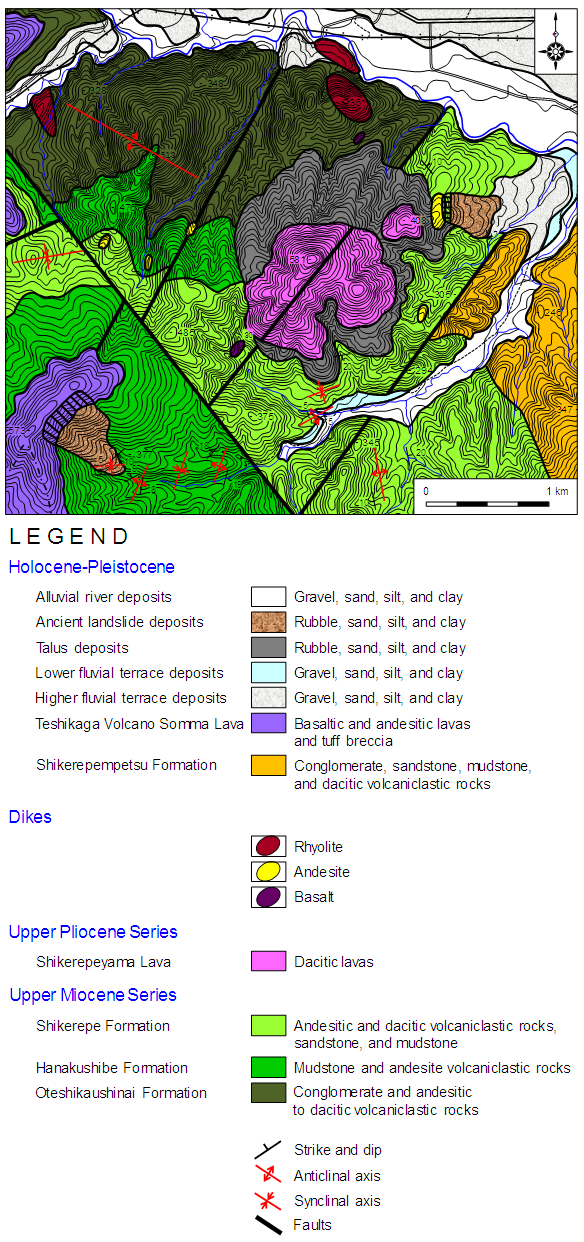 | Figure 1. Geological map in the Okushunbetsu area, Teshikaga Town (modified from Maeda et al. [19]) |
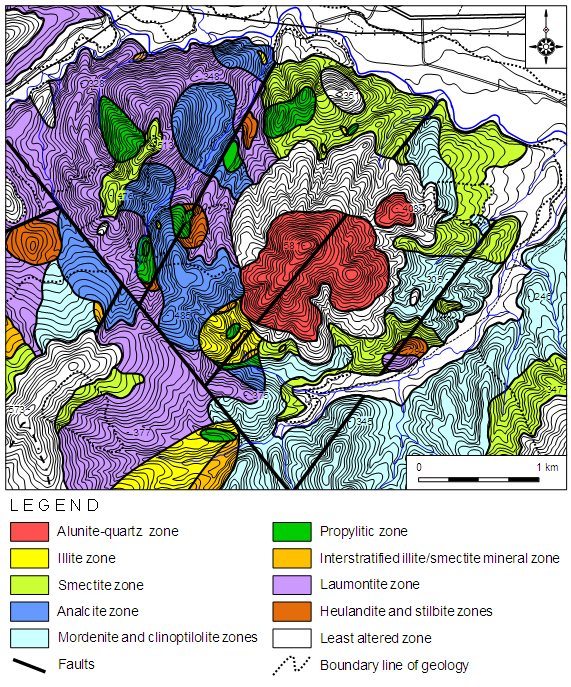 | Figure 2. Distribution of hydrothermal alteration zones in the Okushunbetsu area, Teshikaga Town (modified from Maeda et al. [19]) |
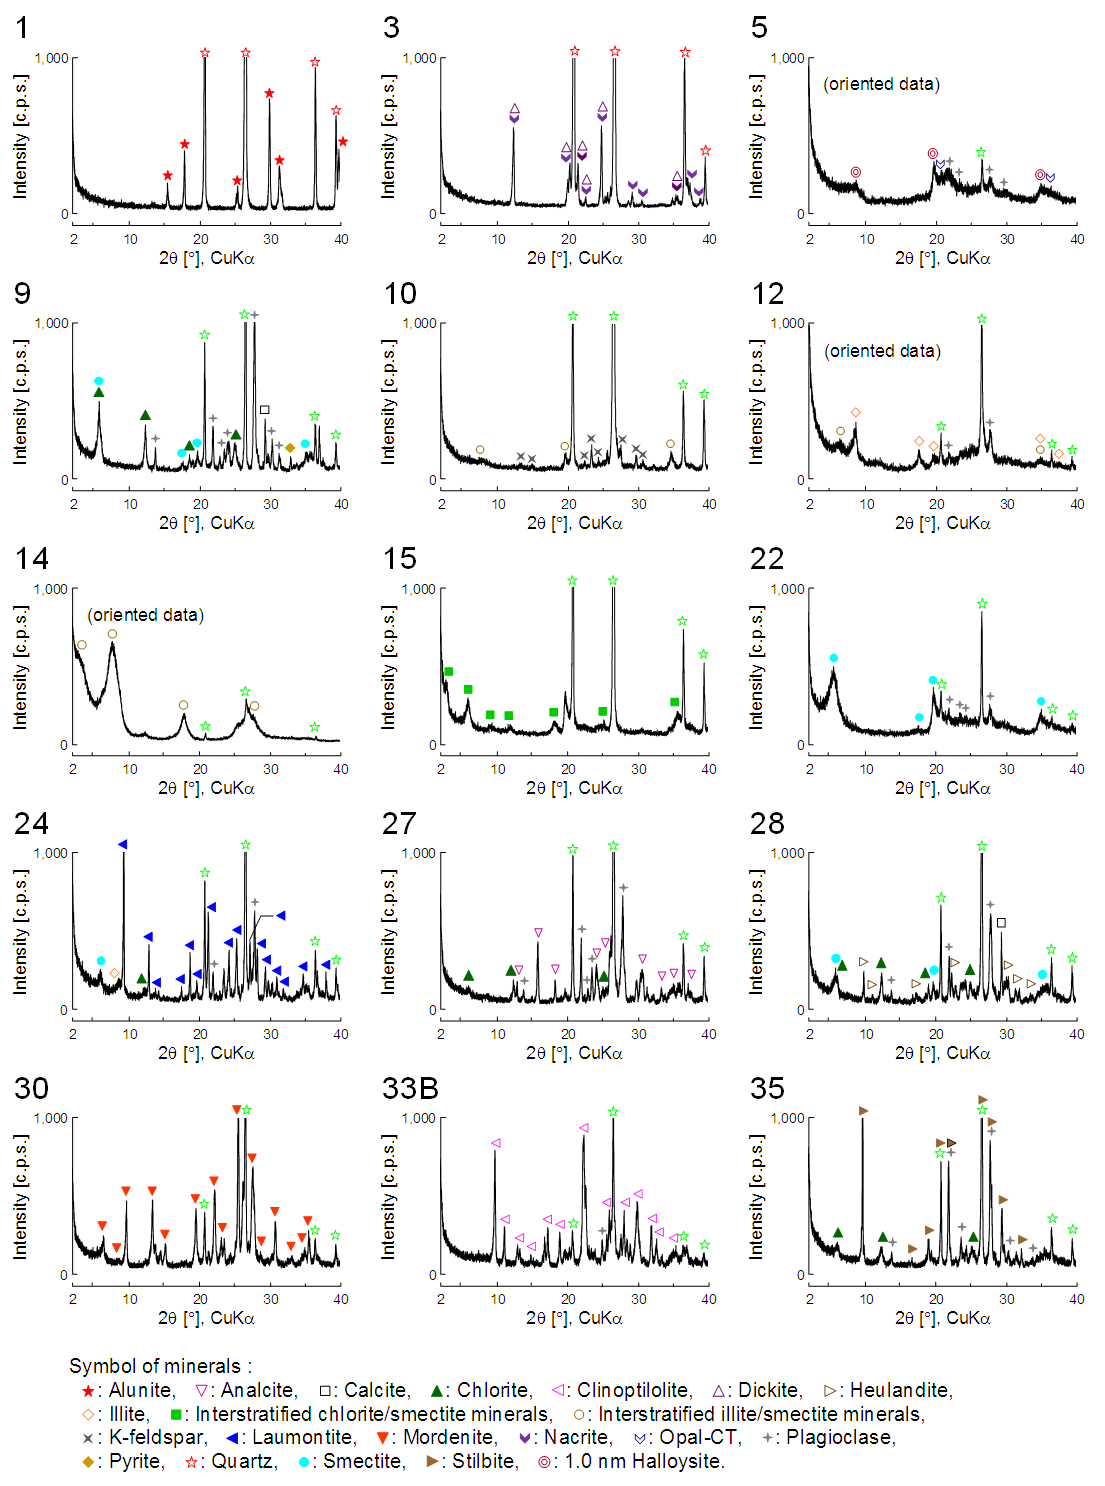 | Figure 3. X-ray powder diffraction patterns of hydrothermal altered rocks. Numbers correspond to “Rock code” in Tables 1 and 2 |
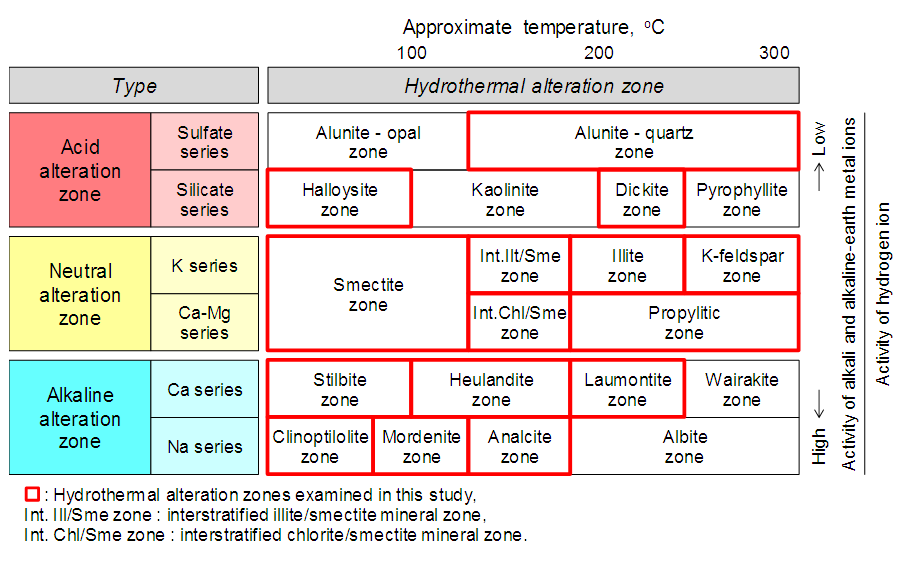 | Figure 4. Classification of hydrothermal alteration zones based on temperature and activity ratio of aqueous cation species in the hydrothermal solution (modified from Utada [20]) |
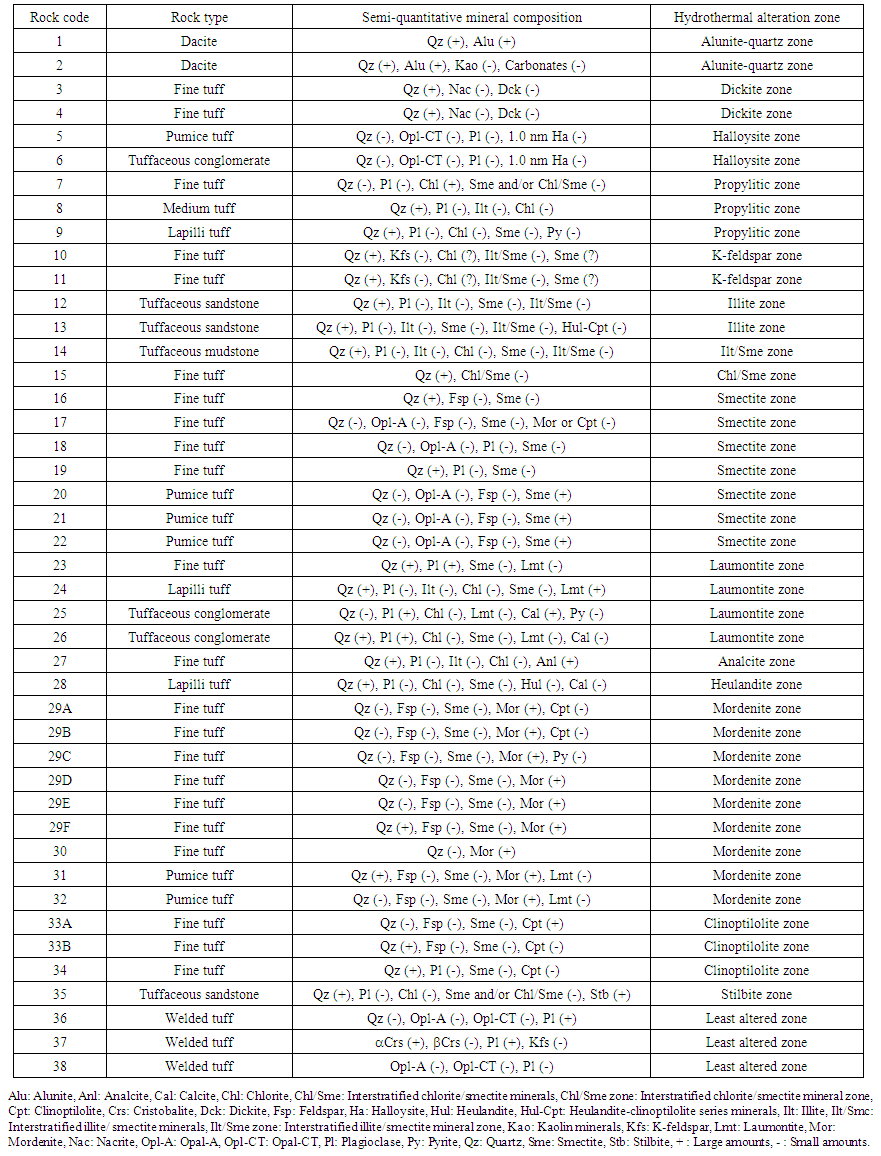 | Table 1. Rock type, semi-quantitative mineral composition, and hydrothermal alteration zone of hydrothermally altered rocks |
3. Methods and Equipment
3.1. Point Load Strength Test
- The PLS test was conducted in accordance with the ISRM Commission [21]. In the PLS tests, the specimens were loaded to failure by application of a concentrated load through a pair of spherically truncated, conical platens. The testing machine consisted of conical loading platens, loading frame, dial gauge, manual control handle, load cell, and load measuring system. The loading speed was set so that each specimen failed within 10–60 s. This was achieved using a manual control handle by loading each specimen continuously at a constant (as much as possible) loading speed up to approximately 100 N/s of load increase. The size-corrected PLS index of a rock specimen was defined as the value of PLS that would have been measured by a diametral PLS test with a diameter D = 50 mm (De2 = 2,500 mm2 where De is the equivalent core diameter). The PLS index can be represented by the formula:
 | (1) |
 | (2) |
 | (3) |
 | (4) |
3.2. Physical Tests
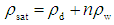
- The physical test was conducted in accordance with the ISRM Commission [22]. The density (dry:
 and saturated:
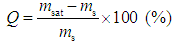
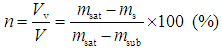
  ), water absorption Q, and effective porosity n are given by:
 | (5) |
 | (6) |
 | (7) |
 | (8) |
 is density of water, V is the apparent volume by buoyancy method, and Vv is the pore volume. The elastic wave velocity test was performed using a Fuji Bussan Co., Ltd. PUNDIT (minimum measurement interval: ±0.1
 ) testing machine. The elastic wave velocity Vp is given by:
 | (9) |
3.3. Test Specimen Preparation
- In this study, axial and irregular lump specimens were used for the PLS tests (Figure 5). The rock specimens used for the axial PLS test in this study were drilled to a diameter of 50 mm and cut to a length of 20 mm using a diamond cutter. This shape was easy to produce, having the advantage of using drilled cores, and it satisfied the conditional expression of 0.3W < D < W [21] (Figure 5A). The rock specimens used for the irregular lump PLS test in this study had an average diameter of approximately 50 mm, and the distance between the two loading platens was approximately 30 mm. The irregular lump PLS test specimen size satisfied the conditional expression of 0.3W < D < W and 0.5D < L [21] (Figure 5B).
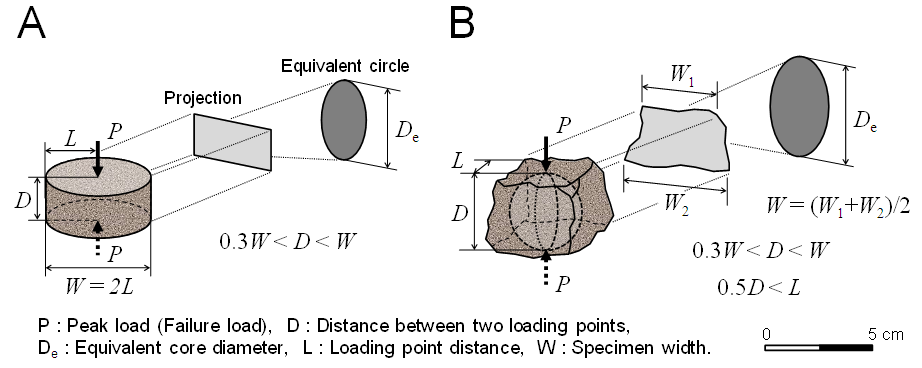 | Figure 5. Shape of rock specimens, load configuration, and conditional expression for axial point load strength test (A) and irregular lump point load strength test (B) |
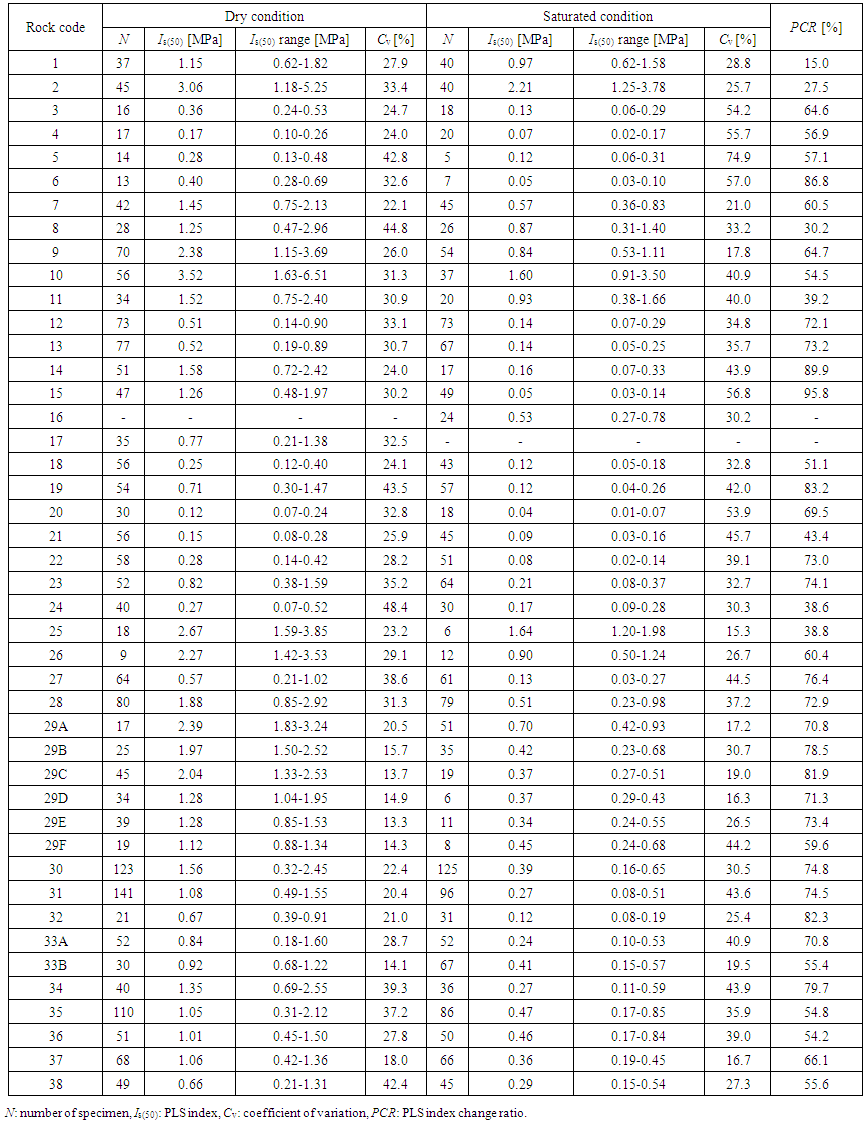 | Table 2. Numbers of specimens and results of the point load strength test |
4. Results and Considerations
4.1. Physical Properties of Hydrothermally Altered Rocks
- The average of several physical properties of hydrothermally altered rocks were found to be in the following ranges: density
 = 0.599–2.518 g/cm3 (dry condition) and
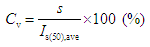
  = 1.334–2.594 g/cm3 (saturated condition); water absorption Q = 3.02–123.34%; effective porosity n = 7.55–74.91%; and elastic wave velocity Vp = 0.980–3.943 km/s (dry condition) and 1.076–4.280 km/s (saturated condition) (see Figure 6 and Table 3). As shown in Figure 7, strong correlations were found between density and water absorption, density and effective porosity, and water absorption and effective porosity. Among the hydrothermally altered rocks, the laumontite zone tuffaceous conglomerate (rock code 25) had the largest average density in the dry and saturated conditions, whereas the smectite zone fine tuff (rock code 18) had the smallest density. The smectite zone fine tuff (rock code 18) had the largest average water absorption and effective porosity of all the hydrothermally altered rocks, and the laumontite zone tuffaceous conglomerate (rock code 25) had the smallest values. The alunite-quartz zone dacite (rock code 2) had the largest average elastic wave velocity in the dry condition, while the laumontite zone lapilli tuff (rock code 24) had the smallest average elastic wave velocity. In the saturated condition, the laumontite zone tuffaceous conglomerate (rock code 25) had the largest average elastic wave velocity, and the halloysite zone tuffaceous conglomerate (rock code 6) had the smallest value.
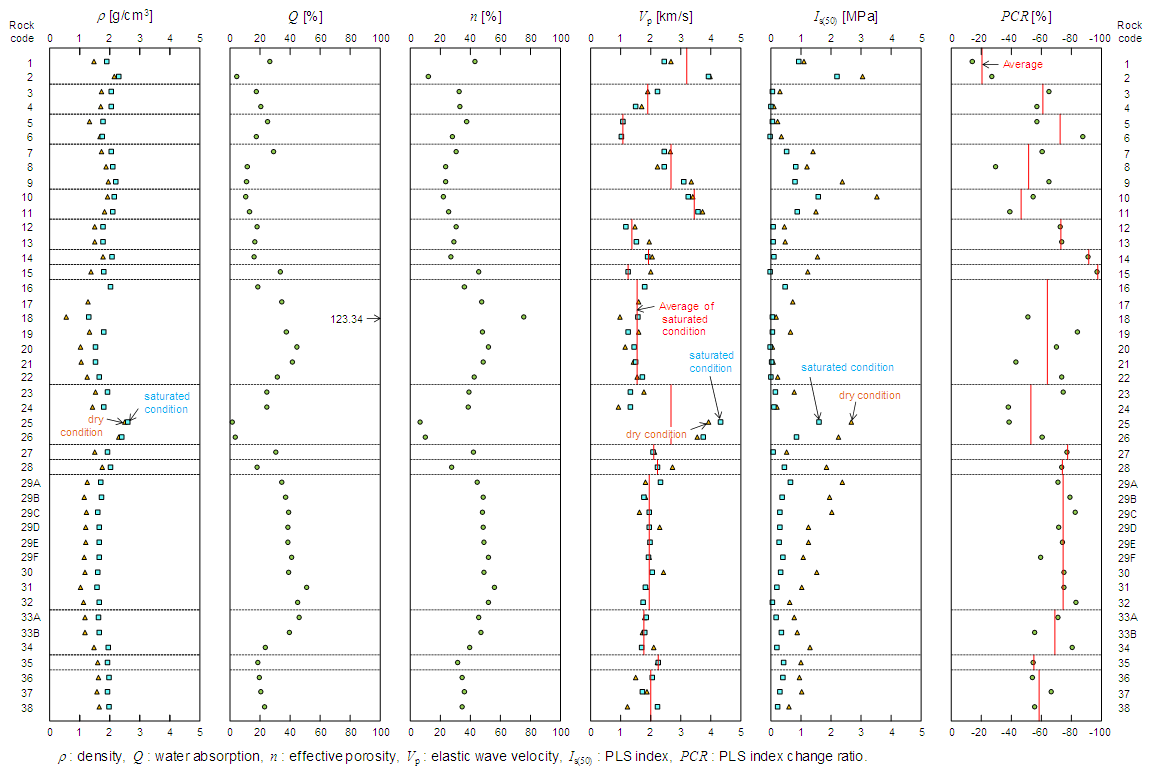 | Figure 6. Physical and mechanical properties of hydrothermal altered rocks |
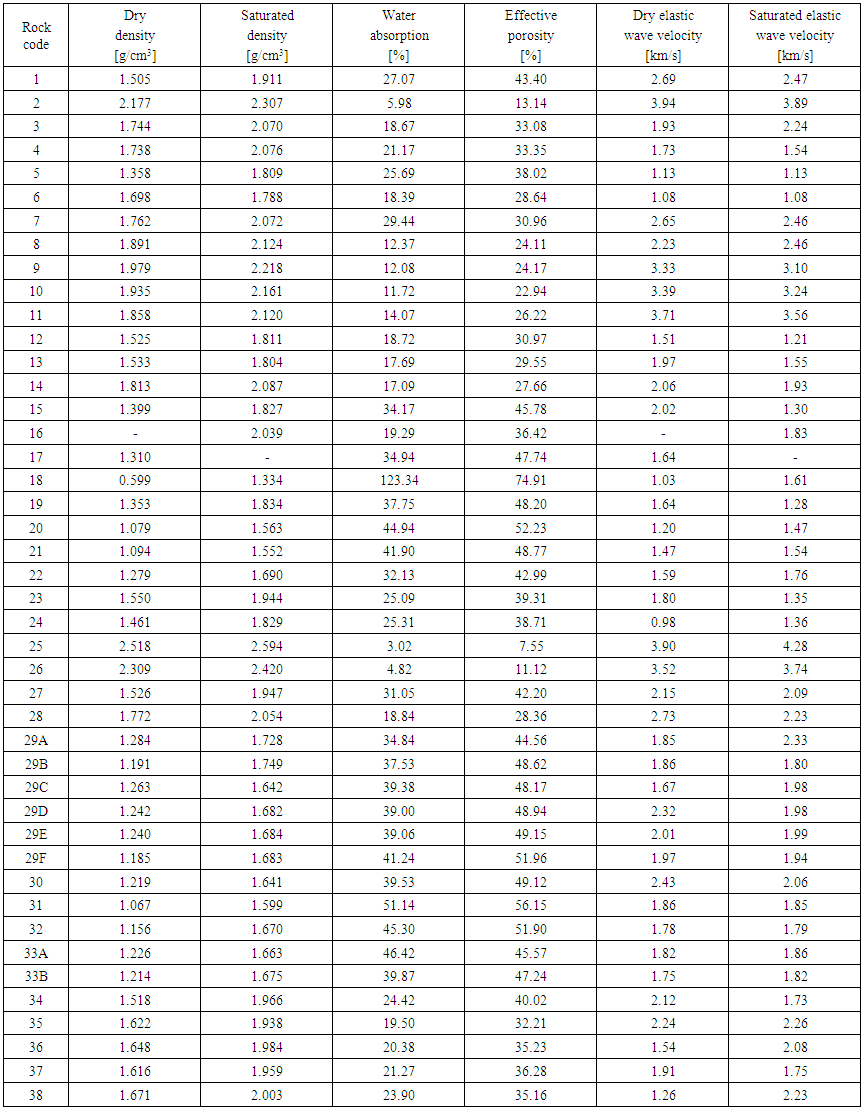 | Table 3. Results of the physical tests |
4.2. PLS Index of Hydrothermally Altered Rocks
- The average PLS indexes of hydrothermally altered rocks in the dry condition ranged from 0.12 to 3.52 MPa, while the average PLS indexes in the saturated condition ranged from 0.04 to 2.21 MPa (see Figure 6 and Table 2). The K-feldspar zone fine tuff in the dry condition had the largest average PLS index of all the hydrothermally altered rocks (rock code 10, 3.52 MPa), followed by the alunite-quartz zone weathered dacite (rock code 2, 3.06 MPa; Figure 6 and Table 2). The smectite zone pumice tuff in the dry condition had the smallest value (rock code 20, 0.12 MPa), with smectite zone pumice tuff having the next lowest strength (rock code 21, 0.15 MPa; Figure 6 and Table 2). In the saturated condition, the alunite-quartz zone weathered dacite had the largest average PLS index (rock code 2, 2.21 MPa), followed by the laumontite zone tuffaceous conglomerate (rock code 25, 1.64 MPa; Figure 6 and Table 2). The smectite zone pumice tuff in the saturated condition had the smallest value (rock code 20, 0.04 MPa), with the halloysite zone tuffaceous conglomerate and the interstratified chlorite/smectite mineral zone fine tuff having the next lowest strength (rock code 6 and 15, respectively, 0.05 MPa; Figure 6 and Table 2). The average PLS indexes of hydrothermally altered rocks tended to be large for the alunite-quartz and K-feldspar zone rocks, and small for the halloysite, smectite, interstratified chlorite/smectite mineral, and interstratified illite/smectite mineral zone rocks, which are characterized by the presence of swelling clay minerals.We examined the PLS index decrease ratios for a range of rock. The strength change ratio can be represented by the formula
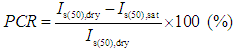 | (10) |
 | (11) |
 = 25% of the average value over a one-sided interval at a 90% confidence level was 5, 7, and 10 for a Cv of 20, 30, and 40%, respectively. Figure 8 shows the correlation between the number of PLS test specimens and the coefficient of variation. A sufficient number of specimens were used for most of the PLS tests, except for three samples (Nos. 5, 6, and 29F of “rock code” in Table 2.). Therefore, the PLS testing methods established in this study were highly representative.
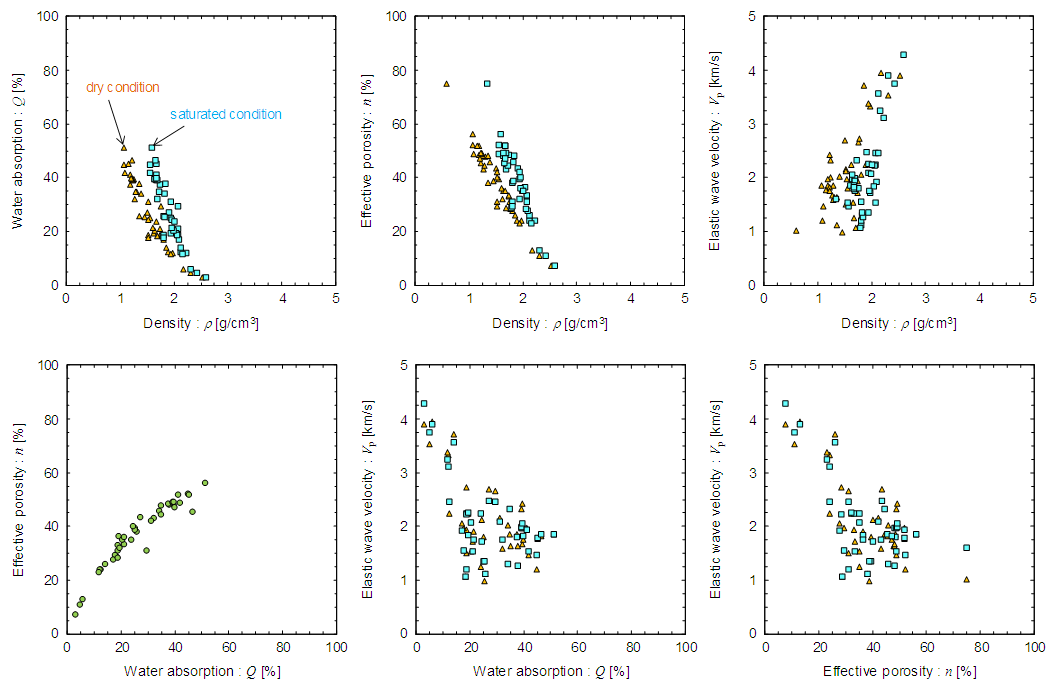 | Figure 7. Correlations between the average value of physical properties of hydrothermal altered rocks |
 | Figure 8. Correlation between number of specimen and coefficient of variation of the point load strength test. Numbers (5, 6, and 29F) of right graph correspond to ‘‘Rock code’’ in Tables 1 and 2 |
4.3. Correlation between PLS Index and Physical Properties of Hydrothermally Altered Rocks
- Figure 9 shows the correlations between the PLS index and the physical properties of hydrothermally altered rocks. The PLS index increased with the density and elastic wave velocity and decreased with the water absorption and effective porosity. The PLS index and elastic wave velocity was strongly correlated with R-values of 0.79 (dry condition) and 0.88 (saturated condition), while no strong correlation was observed between the PLS index and other physical properties, for which the R-values ranged from 0.34 to 0.65. The average PLS index change ratio and average elastic wave velocity in the saturated condition are strongly correlated (Figure 10). These results suggest that the PLS index change ratio can be determined by measuring the elastic wave velocity.
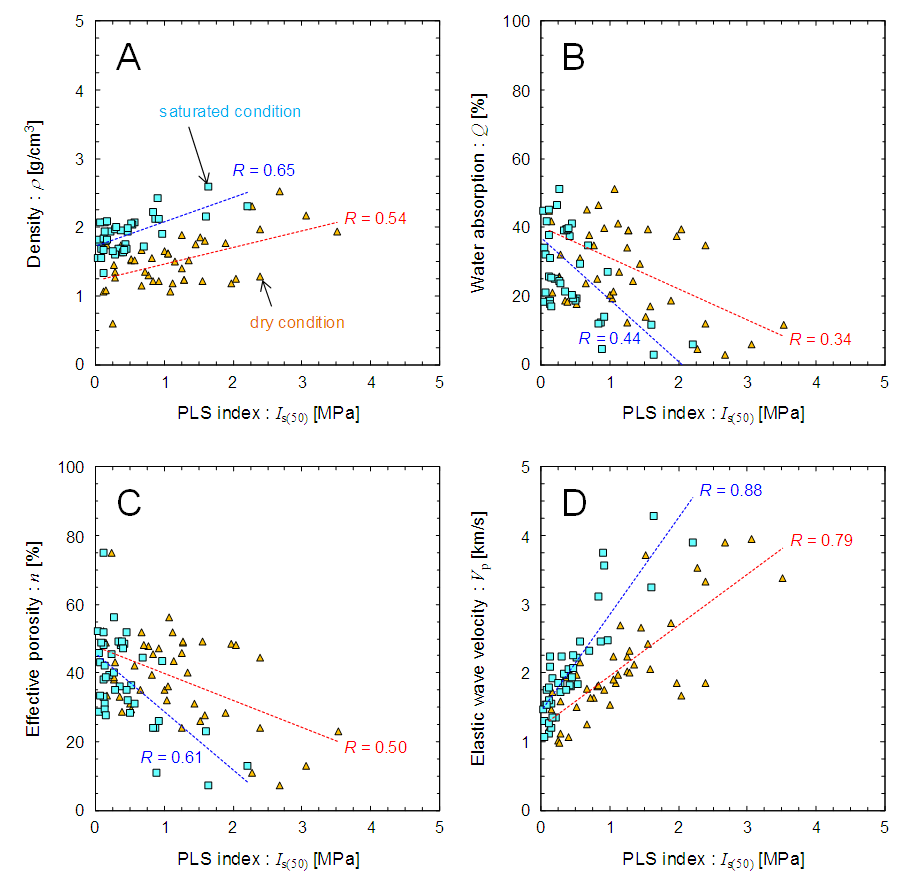 | Figure 9. Correlations between point load strength index and physical properties. A: density, B: water absorption, C: effective porosity, D: elastic wave velocity |
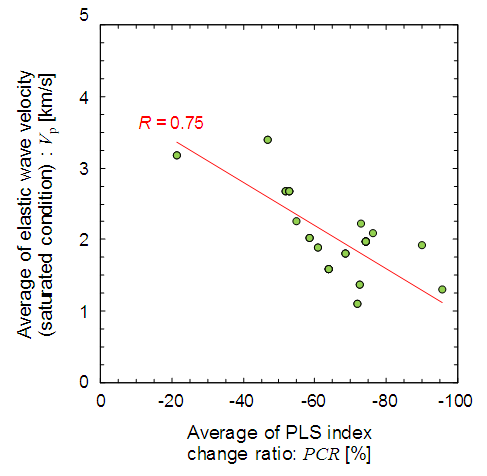 | Figure 10. Correlations between average of point load strength index change ratio and average of elastic wave velocity under wet condition |
5. Conclusions
- The following is a summary of the correlations between the PLS index and physical properties of hydrothermally altered rocks.Strong correlations were found between density and water absorption, density and effective porosity, and water absorption and effective porosity of the hydrothermally altered rocks. The PLS index increased with the density and elastic wave velocity and decreased with the water absorption and effective porosity. The PLS index was strongly correlated with the elastic wave velocity. The average PLS index change ratio and average elastic wave velocity in the saturated condition are strongly correlated. These results suggest that the PLS index change ratio can be determined by measuring the elastic wave velocity. The PLS index change ratio was closely associated with the ancient landslides. It was proposed that a PLS index change ratio of 60% could be used as reference standard when predicting landslides. The results suggest that future landslide and collapse potential within a hydrothermal area can be assessed based on the hydrothermal alteration type and PLS index change ratio. Our data provide a basis for resource development, stability evaluation of underground utilization, landslide hazard assessment, and others.