E. C. Merem1, Y. Twumasi1, J. Wesley1, P. Isokpehi1, M. Shenge1, S. Fageir1, M. Crisler1, C. Romorno1, A. Hines2, G. Hirse2, S. Ochai3, S. Leggett3, E. Nwagboso4
1Department of Urban and Regional Planning, Jackson State University, Jackson MS, USA
2Department of Public Policy and Administration, Jackson State University, Jackson, MS, USA
3Department of Health Policy and Management, Jackson State University, Jackson, MS, USA
4Department of Political Science, Jackson State University, Jackson, MS, USA
Correspondence to: E. C. Merem, Department of Urban and Regional Planning, Jackson State University, Jackson MS, USA.
| Email: |  |
Copyright © 2017 Scientific & Academic Publishing. All Rights Reserved.
This work is licensed under the Creative Commons Attribution International License (CC BY).
http://creativecommons.org/licenses/by/4.0/

Abstract
Nigeria’s abundant solid minerals constitute some of the largest known deposits in recent years under different categories. With the activities in the sector characterized by production and a growing environmental decline often overlooked. This research uses a mix scale approach of descriptive statistics and GIS methodology in analyzing the ecological impacts of mining in Nigeria. Emphases are on the issues, environmental and spatial analysis of the trends, factors associated with the issues and current efforts. The results not only reveal large deposits and changes in production, Nigeria’s mineral deposits showed continual growth much of the time despite a few declines. From a -16.98% drop in 2010-2011, aluminium deposits rose by 22.64-63.08% in 2008 to 2009 and the other years. With time, Illegal mining in Pandogari, Niger state stretched through a 17.5 km2-130 km2 radius from 1992 to 1998. By the year 2000, mining operations extended further into a vast area measuring 200 km2 and continued in 2004-2006 with more incursions onto 254-312 km2. The heavy toll of mining on the environment comes with the declines in forest land area in Bukuru, Plateau state where forest area of 420.52 km2 in 1975 fell to 399.56 km2 by 1986. The downward slide continued almost 20 years after in 2005 with only 155.63 km2 area left with green cover. The other burden of pollution risks involves the 1,000 abandoned mine ponds, alongside 1,100-4,000 tin and columbite mines left behind from the mining booms of past eras in the 1960s and spread all over Jos, Plateau. These threats are compounded further by the 400 fatalities from lead poisoning triggered by illegal quarrying in Zamfara in 2010. The GIS mapping of the trends showed clusters of areas prone to hazards and the dispersion of solid mineral potentials in the nation with the impacts linked to socio-economic elements. For mitigation, the study offered suggestions ranging from education to regular assessment of ecological liabilities and the need for policy enhancement.
Keywords:
GIS, Mining, Nigeria, Minerals, Pollution, Environmental effects, Policy
Cite this paper: E. C. Merem, Y. Twumasi, J. Wesley, P. Isokpehi, M. Shenge, S. Fageir, M. Crisler, C. Romorno, A. Hines, G. Hirse, S. Ochai, S. Leggett, E. Nwagboso, Assessing the Ecological Effects of Mining in West Africa: The Case of Nigeria, International Journal of Mining Engineering and Mineral Processing , Vol. 6 No. 1, 2017, pp. 1-19. doi: 10.5923/j.mining.20170601.01.
1. Introduction
Nigeria’s abundant solid minerals constitute some of the largest known deposits in recent years under different categories made up of precious metals, stones and industrial minerals like coal, tin, gold, marble, limestone and others [1-4]. The core of these mineral deposits scattered across the country remains a major attraction for informal and conventional mining activities even though they are yet to be fully exploited on a large scale. With the center piece of new national policy on solid minerals centered on the systematic development of mineral resources of the country, earth scientists have long noted the vast presence of over 40 to 50 different kinds of untouched sub-terrain assets hidden beneath Nigerian soil and un-prospected. Accordingly, the market worth of Nigeria’s solid mineral deposits in these settings stands at hundreds of trillions of dollars spread throughout the nation. Aside from these potentials, without efficient data infrastructure to gauge the viability of vast deposits of precious metals precisely from gold exploitation only, it is projected that Nigeria loses $50 billion year after year [5]. Lost in all these is the danger of overlooking the environmental externalities based on human-nature interactions associated with mining such as lead poisoning, air and water pollution and other risks across Nigeria [6-14]. Along economic lines, the mining sector in Nigeria has been touted as a potential player in the foreseeable future in a country where government still holds all mineral rights [15]. Many have noted that a sustained solid minerals industry provides a pathway for the rapid development of Nigeria through the generation of employment and improved national income earnings at levels higher than the petroleum industry [16]. Buoyed by overwhelming growth in exploration and mining interest in West Africa, the prospects for the sector are quite vibrant. This in particular has been encouraged by the depletion of easily accessible mineral deposits in Western Europe and the United States [16]. In all these, the opportunities for investments in the solid minerals sector of Nigeria remains enormous, bearing in mind the expansive areas of unexplored mineral potential. These prospects are not new for Nigeria, because over four decades ago, the revenues from solid minerals financed many government programs in the form of infrastructural design, education, health care and the emergence of the petroleum industry under the nation’s development plans. However, the discovery of oil and over dependence on petro dollars gradually quickened the decline and negligence of the solid minerals industry in Nigeria [16]. Notwithstanding the negligence in the past decades, the mining sector has been experiencing an ongoing resurgence with growing prospects. The physical inventory for coal estimated at over 639MT in proven reserves, coupled with an additional 2,750MT and an export value of 15 million tons per annum serves as a testament to the vast potentials of Nigeria’s mineral deposits. In 2013, the sector produced 60.54 million tons of mineral products and 1,254,200 rural based jobs from 1,710 quarries with accrued monetary benefits. With the current dominance of petroleum industry in the economy, informal miners and companies have become very active in the production of solid minerals in the absence of a clearly defined policy, better standards and reforms. This can be buttressed by the presence of 223 small scale mining operations, 195 mining leases, 845 artisanal mining cooperatives and the 2,048 exploration licenses issued in the country [2]. With that came widespread ecological impacts at the expense of adjacent communities. Seeing the recurrent hazards from thousands of abandoned mines across the country especially in Jos Plateau [6, 17], and other risks in the sector through in land sand mining and the effects of artisanal mining. The concentration of toxic residues from zinc and geological hazards and ecological disturbances of destruction of flora and fauna are major challenges from mining [18-21]. There are concerns that the country lacks adequate records of transactions and the exact inventory of traded mineral treasures and the impacts on the environment. Surely, there are damaging environmental effects from mining across the country aside from the potentials as mentioned earlier. While the ecological problems emanate from the activities of artisanal and small scale mining types, the impacts consist of toxic pollution of air, degradation of arable land, habitat loss, and contamination of water resources. Additional impacts involve the incursion of built up areas into the natural environment, the littering of mining wastes and abandoned quarries and radioactive contamination and fatal cases of lead poisonings in an artisanal mining community. These negative externalities would not have emerged in their lethal forms had there been no interactions between prospectors and the mining sites, hence the ecological mishaps. The ecological anomalies do not operate in a vacuum; they are attributed to a host of socio-economic elements made up of ineffective policy, economic variables, inadequate data infrastructure and the activities of the informal sector. This stems partly from the fact that the mining industry is largely underdeveloped and dominated by informal miners scrubbing minerals to make ends meet with little regulatory oversight to ensure conformance to operational standards. With meager use of geospatial information systems in tracking the patterns and forms of mining impacts in the country, these challenges can be analyzed by taking a cue from other studies where GIS served a vital purpose in pinpointing spatial dimensions of ecological liabilities [22-24]. Over the years, GIS use under a mix scale approach has not only been identified as decision support tool in environmental management, but it serves a vital purpose for policy makers in tracking emerging liabilities in the natural resources sector like solid minerals. In one study on coal mining impacts in West Virginia, spatial analysis revealed the dispersion of mining activities onto fragile environments comprising of open spaces, streams and mountain ecosystems [25]. Seeing the benefits in the analysis of water quality issues, managers are using GIS to monitor various land uses in a watershed [26, 27]. In realizing these capabilities, scholars are channeling their GIS data management expertise towards the calibration of watershed and water quality models [28]. In that fashion, Russell examined the role of GIS in selecting sites for riparian restoration based on hydrology and land use [29] in a manner consistent with the concerns of areas impacted by mining activities in Nigeria. With the negation of the emerging issues in Nigeria’s mining sector over the years [30-33], this research will fill that void by using a mix scale approach of descriptive statistics and GIS in analyzing the ecological impacts. The emphasis is on the issues, ecological and spatial analysis of the trends, factors associated with the issues and current efforts. The paper has five objectives. The first aim focuses on the use of geospatial tools to assess ecological impacts of mining activities, while the second objective is to design a support scheme for policy makers. The third aim stresses the development of a novel method for tracking indices for solid mineral management. The fourth objective is to craft a framework for effective planning in the sector. The fifth objective is to analyze solid mineral(s) resource use in Nigeria. The paper is divided into five parts. The first section presents the introduction, while the second part describes materials and methods. Part three highlights the results with GIS mapping and factors. While the fourth section contains the discussion, part five provides the conclusion and findings of the research.
2. Methods and Materials
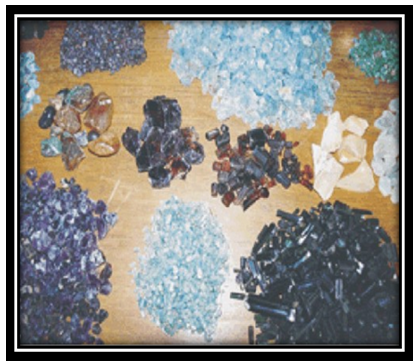
The study area (Figure 1) stretches through 923,769 km2 across 36 states from north to south [34]. With a population of 187 million in 2016, the nation boosts of diverse eco-zones containing vast reservoir of species of rare flora and fauna. The classification of these different life forms encompasses close to 1,000 species of birds, 247 species of mammals, 123 kinds of reptiles, around 1,000 types of fish and nearly 7,895 species of plants [35]. Being endowed with vast reserves of solid minerals, including precious metals, stones and industrial minerals in the form of gold, coal, barite, and iron ore (Figure 1.2), there are currently 44 different minerals found in 500 sites in Nigeria [36]. Of all the minerals, limestone which is essential in manufacturing cement, accounted for 52% of solid mineral production in 2013, while granite, laterite, and sand represented 27.8, 11.3 and 5.8% distinctly [5]. From its past history, the country was a major exporter of tin, columbite, and coal in the early and late 20th century.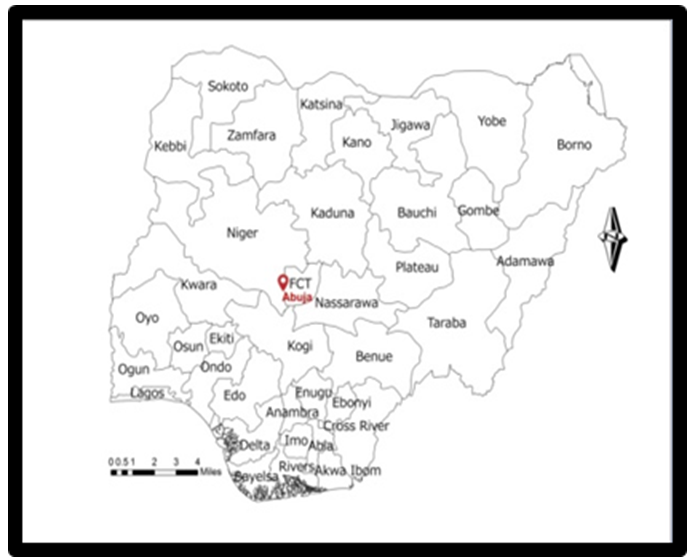 | Figure 1. The Study Area of Nigeria |
 | Figure 1.2. Images of Nigeria’s Solid Minerals |
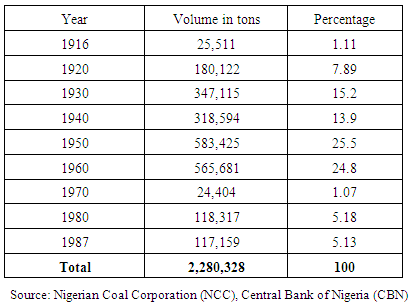
For a deeper insight into the genesis of mineral production in the country over the years, consider the temporal evolution of coal production between the early and later periods of the 20th century. At that time, the percentage of total coal production valued at 2,2800,328 tons occurred during the golden eras of the 1930-1940 when the country’s output ranged from 347,115-318,594 tons representing 15.2-13.9% of the entire production. That is different from the 1950-1960s production levels which rose from 583,425-565,681 tons with both periods accounting for 50% of all outputs during the early years. Even at that time when life expectancy was lower, no one bothered about the environmental impacts of mining activities in the country’s coal mines (Table 1). However between 1965 through 1975, the exploitation of some of the minerals occurring in Nigeria contributed over 12% to the nation’s GDP [16].Table 1. Coal Production Tends 1916-1987
 |
| |
|
By the time oil and gas production took center stage, and became a major earner of foreign currency, the solid mineral sector declined substantially. During the later years of 1990-2010, Nigeria’s GDP showed about an 89% increase with an estimated nominal level of $510 billion, surpassing South Africa as the largest economy in the continent under a much diversified economy than previously thought with potential for mining activities in the 21st century. Such performance of the economy seems underpinned by the favourable improvements in the non-oil sector of the economy with real GDP of growth rate of 5.4%, 8.3%, and 7.8% in 2011, 2012, and 2013 respectively [37]. In the context of economic contributions, the mineral sector has made some strides. From available records, 30 companies exported 7,107,099.80 metric tons of minerals valued at N11,496,070,691 with N31.449 billion contributed to the economy in 2012 [5]. On top of all that, the mining industry has been projected to account for 10% of the GDP by 2020 [38]. With all these potentials, come thousands of abandoned mines and tailings ponds scattered in many areas of the country, threatening the fragile ecosystems alongside endless degradation of air, land and water and human fatalities in areas adjacent to mining sites. For the purposes of effective management of solid mineral resource in the study area, these ecological liabilities merit a mix scale analysis using GIS. With very little understanding of the gravity of accumulated impacts, GIS analysis provides us a tool for understanding the spatial patterns of mining effects on fragile ecosystems in Nigeria.
2.1. Methods Used
The paper uses a mix scale approach of descriptive statistics and secondary data connected to GIS. The spatial information for the research was obtained from various sources including the University of Maryland Online Data services, the United Nation Economic Commission for Africa (ECA), the US Geological Survey (USGS) Mineral Resource System Online Spatial Data, The Federal Government of Nigeria and The Federal Ministry of Mines and Steel Development. Others include The Nigerian Federal Bureau of Statistics and the USGS World Mineral year book International mineral and statistics and information, The British Geological surveys, world mineral production, African Mineral production, and Nigeria’s national archives. The USGS World Mineral year book International mineral and statistics and information and databases provided the solid mineral time series data for the periods of 2008-2012 while Nigeria’s Federal Bureau of statistics and the African Economic Outlook furnished the economic data. Accordingly, Federal geographic identifier codes for the cities and states were used to geo-code the information contained in the data sets. This information was analysed with basic descriptive statistics, and GIS, with particular attention to the temporal-spatial trends at the city and state boundary level. The relevant procedures consist of two stages.
2.2. Stage 1: Identification of Variables, Data Gathering and Study Design
The first step involves the identification of non-fuel solid minerals; land use and land cover elements and economic variables needed to assess degradation in areas adjacent to mines. The solid mineral variables consist of aluminum, gold, iron ore, lead-zinc ore, columbium, steel, tin and coal. Others include barite, marble, gypsum, laterite, cement, limestone, granite, topaz and clays while economic elements cover the monetary equivalent of production among states and the percentages. The land use elements encompasses number of abandoned mining sites, average area coverage (km2) in illegal mining, percentage of area, the number of indigenes and none indigenes engaged in mining, percentages of change, land use and land cover elements of arable land, degraded area, forest, water body, built-up area, hills/rocks and the differences. Additionally, access to databases that are available within the federal and state archives in Nigeria and other foreign agencies quickened the search process. The process continued with the design of data matrices for solid mineral, socio-economic and land use (environmental) variables covering the periods from 1975-2005, 2008, 2009, 2010, 2012, and 2013. The design of spatial data for the GIS analysis required the delineation of state and national boundary lines. With boundary lines unchanged, a common geographic identifier code was assigned to each of the units to ensure analytical coherency.
2.3. Stage 2: Step 2: Data Analysis and GIS Mapping
In the second stage, descriptive statistics and spatial analysis were employed to transform the original socio-economic and land-use data into relative measures (percentages/ratios). This process generated the parameters for establishing degradation and change on the landscape in areas devoted to mining. This was facilitated by measurements and comparisons of the trends over time. While this approach allows for change detection, the tables highlight stressors, indicators of degradation, mineral usage, demands and supply and number of fatalities. The remaining steps involve spatial analysis and output (maps-tables-text) covering the study period, using Arc GIS 10.4 and SPSS 20.0. The spatial units of analysis consist of mining sites across states and cities. The geographic data for Nigeria, which covered state boundaries and cities, also include contamination and ecological data of land cover files, paper and digital maps from 1996-2004. The outputs of the spatial data were mapped and compared to see the dispersion of stressors and socio-economic factors fuelling environmental degradation. With very little understanding of the gravity of accumulated impacts, GIS analysis provides a tool for understanding the spatial patterns of mining impacts on fragile ecosystems across Nigeria.
3. The Results
This section of the paper presents the results of the data and environmental analysis of ecological impacts of mining in the study area. There is a first focus on the temporal profile of commodity minerals trends. This is followed by a description of percentages of change and the differences, ecological impacts of illegal mining and land cover change, and miscellaneous analysis of mining across Nigeria. The others include GIS mapping and factors responsible for the ecological decline from mining activities in the country.
3.1. Temporal Profile of the Minerals
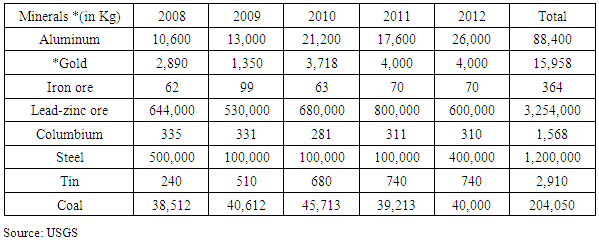
In terms of the amount of precious minerals present in various areas of the country, the commodity mineral distribution shows the presence of many of them from aluminum to coal between the periods of 2008 through 2012. Many of the nonfuel minerals displayed on the table are very crucial in the development of many areas as major currency earners. Beginning with an overall total of 88,400 tons in aluminum deposits, the opening quantity mined stood at 10,600 to 13,000 in 2008 through 2009 and continued at 21,200, 17,600 to 26,000 tons all through the periods of 2010 to 2012. Gold had initial values of 2,890 to 1,350 tons in the first two years of production, followed by a run up of 3,718 -4,000 tons in the ensuing periods of 2010 through 2012. Just as iron ore deposits in the country varied significantly (by 62-99 tons and 66 -70 tons) in the entire four years, the total quantity of lead zinc ore of 3,254,000 tons showed a major spread mostly in the six figures (644,000, 530,000, 680,000, 800,000 tons). In a similar vein, columbium deposits reached identical proportions of 335, 331, 281, and 311 to 310 tons in the periods of 2008, 2009, 2010, 2011, 2012. Notwithstanding the obsession in the country, steel production levels at almost half a million tons in 2008 dropped to 100,000 to 400,000 tons in the other years between 2009 through 2012. Among these minerals, tin deposits tonnage in the individual years which stood at 240 tons reached about 510 tons in 2009 and continued with major increases of 680-740 tons in the ensuing years of 2010-2012. Coal deposits also fluctuated from initial stocks of 38,512-40,612 tons and 45,713-39,213 tons until a late rally of 40,000 tons in 2012 (Table 2).Table 2. Commodity Minerals in Thousand Metric Tons, 2008-2012
 |
| |
|
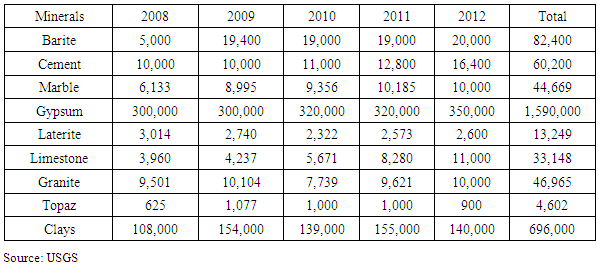
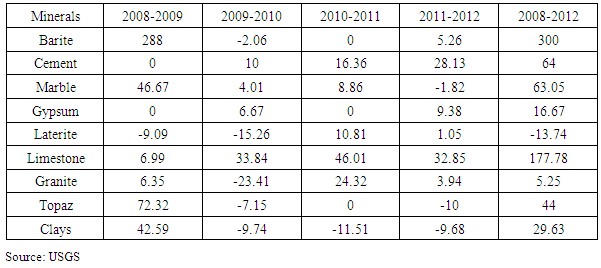
Turning to precious minerals, the table outlines their presence across the years ranging from barite to clays in the country. For a breakdown of the minerals, the nation saw its barite production level move from 5,000 to 19,400 tons in 2008 to 2009 and 19,000 to 20,000 tons between the remaining five years. With somewhat stable levels of 10,000 tons for cement production in the first two years, the production picked up by 11,000 to 12,800 and 16,400 (in 2010-2012). Marble stayed on the upside at 6,133, 8,995 and 9356 tons in 2008-2010 and with 10,185-10,000 tons all through 2011-2012. Of the total of 1,590,000 tons and average of 316,000 tons of gypsum deposits in place for the entire years under analysis, the opening values of 300,000-320,000 tons in the 2008-2011 jumped to 350,000 tons. Regarding the other minerals like laterite and limestone, aside from the 3,014 tons in production for the former, note the gradual variations of 2,740, 2,322, 2,573 and 2,600 in tonnage produced. In contrast, Nigeria’s limestone deposits went from 3,960 tons in 2008 to 4,237 tons in 2009. The notable rally which extended into the other years involved a notable jump from 5,671 to 8,280 and 11,000 tons from 2010-2012. Additionally, granite in the country showed opening value of 9,501 and 10,104 tons in the initial two years and continued with an upswing in the neighbourhood of 7,739-9,621 and 10,000 tons. While topaz posted fluctuating values (of 625,-1,077, 1,000-900 tons), the quantity of clay rose from 108,000 to 154,000 tons and in the other periods, the trend continued with 139,000 to 155,000 tons followed by 140,000 tons in 2012 (Table 3).Table 3. Other Minerals and Precious Stones in Thousand Metric Tons
 |
| |
|
3.2. The Percentages of Change in Mineral Deposits
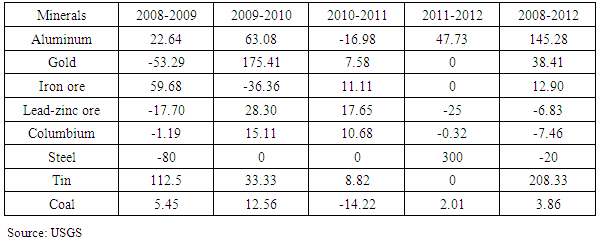
In terms of the percentages, Nigeria’s mineral deposits over the years showed continual growth much of the time not withstanding a few instances of declines. Accordingly, with exception of the double digit declines of -16.98% between 2010-2011, the country saw notable gains in aluminium deposits estimated at 22.64% to 63.08 during the periods of 2008-2009. As time went on, the momentum sparked from the increases, stretched further into the other years (2011-2012 and 2008-2012) by 47.73-145.28 percentage points. Even though gold declines stood at -53.29% in the 2008-2009 fiscal years, the nation posted back to back surges of 175.41-7.58 and 38.41% between 2009-2010 through 2010-2011 and 2008-2012. Iron ore which had an initial growth rate of 59.68% in 2008-2009 saw a -36.36% slide in the subsequent period of 2009-2010. Deep into the ensuing years, the mineral grew further by 11.11-12.90%. Elsewhere lead zinc ore and columbium each maintained identical patterns in percentages of change with different rates of declines (-1.19-80, -25% -0.32% to -6.83-7.46). Under the gains column, lead zinc rose from 28.30-17.65% while columbium experienced increases of 15.11 to 10.68% all through 2009-2010 and 2010-2011. With only 300% gains in 2011-2012 for steel production in the country coupled with substantial declines (-80 to -20%) in the other years, tin mining sector raked in uninterrupted gains of 112.5% to 33.33% and 8.82 -208.33 in the different years between 2008 through 2012. Coal mining on its part not only grew much of the time (at 5.45%, 12.56% and 2.01%-3.86%), but it did post a single loss of 14.22% in 2010-2011 like the other minerals on Table 4.Table 4. Percentages of Change Commodity Minerals and Metals
 |
| |
|
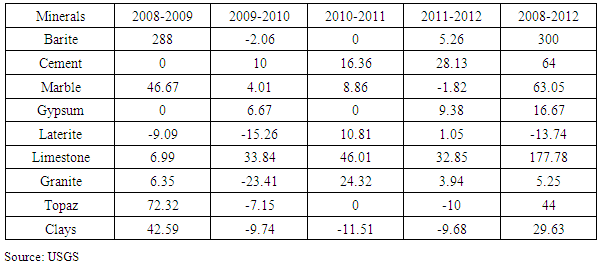
Among the precious stones types of minerals, the rates of gains seem to outpace the declines in the industry. As a result, barite production rose by triple digit points of 288-300% in 2008-2009 and 2008-2012 with an exception of the 5.26% gains in 2011-2012 while the only loss stood at -2.06% in 2009-2010. Starting with no gain in 2008-2009, cement surged consistently at double digit rates (of 10-16.36% and 28.13 -64%) by 2009-2010 to 2010-2011, 2011-2012 and 2008-2012. Other major precious stones such as marble and gypsum saw also visible increases. In the case of marble, it grew in the first two periods (2008-2010) by 46.67-4.01% and continued the surge at 8,86% -63.5% in the other years until a -1.82% drop crept in between 2011 through 2012. Gypsum followed up at 6.67, 9.38 and 16.67%. In as much as laterite deposits in the country during the years of operation went through even splits of gains and declines of -9.09- 15.26 and -13.74 in three different periods, the production revealed gains of 10.81 to 1.05% all through 2010-2011 and 2011-2012 while limestone operations posted gains year after year in the order of 6.99% to 33.84%. This was followed by additional higher digit gains of 46.01, 32.85, and 177. 78%. Of the three remaining group of minerals (granite, topaz and clays), only granite saw more gains of 6.35%, 24.32, and 3.94-5.25 percentage points much of the time followed by single period of declines in 2009-2010. Topaz and clays all posted increases in production at 72.32-42.59 and 44.0-29.63% respectively in the fiscal years 2008-2009 to 2008-2012 coupled with pockets of declines as well (Table 5). Table 5. Percentage of Change for Other Minerals and Stones
 |
| |
|
3.3. Differences in the Quantity of Sub-terrain Assets
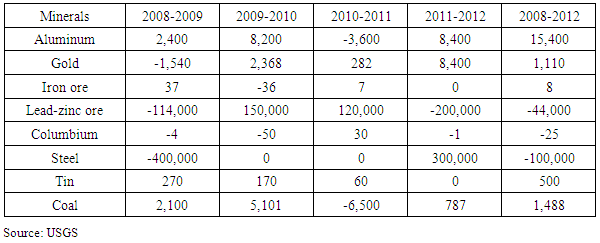
The magnitude of changes among the commodity minerals in the country reveals gains and deficits across time. With declines of -3,600 tons in the 2010-2011 periods in the quantity produced. Between 2008-2009, 2009-2010 and the other two years, aluminum showed notable gains with surpluses in supply worth 2,400 tons -8,200 in 2008-2009 to 2009-2001 and 8,400 to 15,400 tons all through 2011-2012 to 2008-2012. Notwithstanding the initial change of -1,540 tons in 2008-2009, gold production in Nigeria still had a strong showing with substantial gains estimated at 2,368-282, and the 8400-1110 tons in the following years of 2011-2012 and 2008-2012. With gains (37-7 and 8 tons) spread over the years in the country, iron ore’ only deficit of -36 emerged in 2009-2010 while lead ore zinc fluctuated by -114,000, -200,000 to-44,000 tons as a measure of demands in the market place. By 2009-2010 and 2010-2011, the industrial production of iron held firm with superb rallies of 150,000-120,000 tons (in gains) likely to sustain the market demands among users. On the downside of mineral production in Nigeria, one point worth noting stems from the state of columbium and the steel industry where the later saw its output fade continuously (from -4, -50 to -1,-25 tons) while declining level of steel production went unabated at -400,000 to -100,000 tons despite a surplus or gains of 300,000 tons in the 2011-2012 fiscal year. Just as the tin sector held on to a surplus of 270 to 170 tons and continued with additional 60 -500 tons, coal production showed some gains (2,100-5,101 and 787-1,488) much of the time with the exception of a deficit of -6,500 tons which is a sign of active use of the mineral (Table 6). Table 6. Differences for Commodity Minerals and Metals
 |
| |
|
In terms of the precious stones, the first four minerals on the table such as barite, cement, marble and gypsum showed more consistencies when it comes to gains. A case in point is barite which had notable increments (estimated at 14,400, 1,000 and 1,500 tons, while the surpluses for cement production stood at 1,000-1,800, 3,600 to 6,400. The increments in marble deposits followed up (at 2,862-361, 829 and 3,867). The same can also be said of gypsum with considerable level of gains in the order of 20,000-30,000 to 50,000. Given that the frequency of drops (-274to-418 and -414 tons) in laterite seemed to have outpaced the gains (2609-2720 tons), limestone industry not only grew much of the time, but it piled up substantial surpluses (of 277-1434, 2,609, 2,720, and 7040). Having seen the visible level of surpluses estimated at 603-1,882 and 376-499 tons for granite all through 2008-2009 and the other years, topaz and clays maintained a mix of gains and declines in outputs (Table 7). Table 7. Differences for Other Minerals and Stones
 |
| |
|
3.4. The Ecological Impacts of Illegal Mining Trends and Land cover Changes
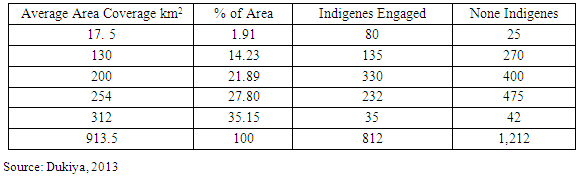
In the context of illegal mining in the Pandogari area of Niger state, the activities picked up pace year after year at a geometric proportion over a period spanning through 1992 -2006. From a total area of 913.5 km2 covered by mining operations in the district, note that as time went on, informal mining activities in 1992 to 1998 stretched through a 17.5 km2 -130 km2 radius. Knowing the toll on natural habitats and biodiversity, by the year 2000, mining operations extended further into a vast area measuring 200 km2 and continued in 2004-2006 with further incursions into 254-312 km2 of the area. Among the mining labor, within that period, the numbers ranged from close to 812 locals compared 1,212 outsiders of mostly non-indigenes. Of those years in Pandogari, the number of miners on both sides between 1992 through 1998 consists of 80-135 to 25-270 while in the subsequent periods, the population of informal miners jumped to 330-232 and 400-475. After that, a sudden slide in illegal mining labor in Pandogari (of 35-42) ensued among indigenes and non-locals in the mining zone. During these periods, note also that the influx of outside illegal miners outnumbered the locals (Table 8) [39]. Table 8. Illegal Mining Activities in Pandogari and the Impacts 1992-2006
 |
| |
|
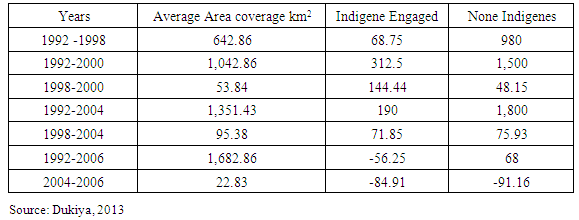
The percentages of change for the average area coverage point to substantial increases during the years. By 1992 -1998 through 2000, areas under illegal mining in km2 increased geometrically at rates of 642.86 to 1,042.86%. In the ensuing periods of 1998-2000 and 1992-2004 informal mining areas again grew further by 53.84 to 1,351,43 percentage points with further extensions into other years (1992-2006 to 2004-2006) at 1,682.86 and 22.83 percentage points. Over the years as the table shows, the number of informal miners grew much of the time among all the categories (indigenes versus non indigene). The only exceptions occurred in 2004-2006 when the decreases in none indigene illegal miners who flocked into the Pandogari mining region in search of greener pastures reached -56.25% and -84.91 and -91.16 percentage points. With the large presence of illegals from outside, the percentage increases reached all-time highs of 1,500-1,800% compared to 312.5% -190% for the indigenes engaged in illegal mining between 1992-2000 and 1992-2004. The impacts indicate that the average areas converted by illegal mining rose all through the years from 112.5 km2 -182.5 km2 followed by further increases of 236.5 km2 -294.5 km2 (Table 9) [39].Table 9. Percentages of Change
 |
| |
|
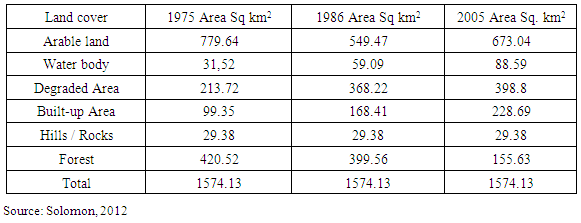
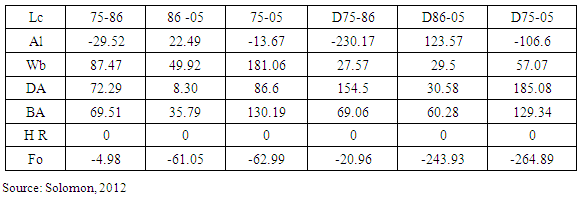
To further buttress the growing impacts of mineral production in Nigeria on the environment over the years, one need look no further than the size of or area of land use and landcover changes in km2 that occurred between 1975 through 2005 in the Bukuru area of Plateau state. Among the different land cover types, with a total of 1574.13 km2 areas under mining activities during those years, arable land size went from 779.64 to 549.47 km2 and 673.04 km2 all through 1975 to 1986 and the 2005 period. During the same period, water body area in the Bukuru mining zone began at 31.52 and rose to 59.09 to 88.9 km2 while degraded area also showed immense levels of increase of 213.72 km2 in 1975. In the ensuing 11 years later, degraded area jumped up to 368.22 km2 coupled with further encroachment measuring 398.8 km2 in 2005. Under these prevailing trends in the mining zone, built up areas which covered an initial land mass of 99.35 km2 in 1975 wasted little time in an unprecedented expansion into other areas estimated at 168.41 to 228.69 km2 between 1986 and 2005 while uninhabitable terrains like hills and rock at 29.98 km2 stayed the same from 1975-2005. The heavy toll of mining on the environment especially forested landscape is evident from declines in forest land area. From the ensuing disturbance, Bukuru’s forest landscape opening value of 420.52 km2 in 1975 fell to 399.56 km2 by 1986 and continued the downward slide almost 20 years after in 2005 with only 155.63 km2 of area left with green cover (Table 10).Table 10. Land Use and Land Cover 1975-2005 in Bukuru Plateau
 |
| |
|
In terms of the percentages of change, it is clear that of all the land cover types in Bukuru under analysis, only water body, degraded areas and built up environments saw consistent growth levels of significant proportion from 1975 to 2005. This is different from the two others like arable land and forested land that saw much of their areas under notable declines during a span of 30 years in Plateau state. Water body area which increased at a rate of 87.47% to 49.92% posted further gains of 181.06% between 1975-2005 while in the same period, the size of degraded area showed gains of 72.29%-8.30%, followed by a major upsurge of 86.6% in 1975-2005. Furthermore, during those years, built areas showed growth rates of all-time highs. This involved the 69.51% -35.79% in 1975-1986 and 1986-2005 as well as the 130.19 percentage point gains for 1975-2005. Overall, Bukuru’s mining district arable land size experienced major declines of -29.52% to -13.67 in the periods of 1975-1986 and 1975-2005 only to rebound with a gain of 22.49 percentage points. Further instances of declines comes with forested areas of the district which began at a single digit rate of -4.98% in 1975 through 1986 followed by high double digit percentage declines of over sixty (-61.05% to -62.99%) during the periods of 1975-1986 and 1975-2005 (Table 11) [40]. The extent and magnitude of change that occurred in km2 mined areas remains quite significant under the different land classes in the Bukuru mining district. The data shows that about -230.17 to -106.6 km2 representing a total of -336.77 km2 in arable land not only disappeared, but they stayed unaccounted for. In as much as significant chunks of areas were taken out of operations for mining activities in the form of losses, they represent about 21.39% of the Bukuru mining district’ total land base of 1574.13 km2 in the entire period between 1975-2005. With such an unprecedented vanishing of vast tracts of arable land essential for farming and more than or close to the distance between Lagos and Owerri, Imo state, so came gains of 123.57 km2 in 1986 through 2005. Water body which stood firm much of the time (in terms of increments covered 27.57 km2 -29.5) later extended to 57.07 km2 from 1975-2002. Two other indicators (degraded area and built up areas) representing ecological dis-benefits of mining inherent in the area also surged considerably at the expense of biodiversity based on gains in their physical attributes (Table 11) [40].Table 11. Percentages of Change and Differences to 1975-2005
 |
| |
|
The indelible havoc left by degraded area on the surrounding ecology of the zone stretched over vast areas measuring 154.5 km2, 30.58 km2, and 185.08 km2. When summed up, this amounts to an overall total area of 370.16 km2 at an average of 185.08 km2. The encroachment of built up areas also reflects similar change patterns of increments estimated at 69.06 -60.28 km2 and 129.34 km2 with a total and average areas of 258.68 to 129.34 km2 all through 1975-1986, 1986-2005 and 1975-2005 in the Bukuru area. With no changes in the uninhabitable terrains of hills and rocks, forested areas as major repositories for biodiversity posted the biggest losses with forest cover. This involved the loss of -20.96 km2 -243.93 km2 and -264.89 km2 worth of forest areas totaling 528 km2 at an average of 176.32 km2 in the periods of 1975-2005. When tallied against the overall size of the mining area, the lost forest landscape amounts to 33.54% of the Bukuru land base in a span of over 30 years.
3.5. Miscellaneous Impact Analysis of Mining Activities across the Country
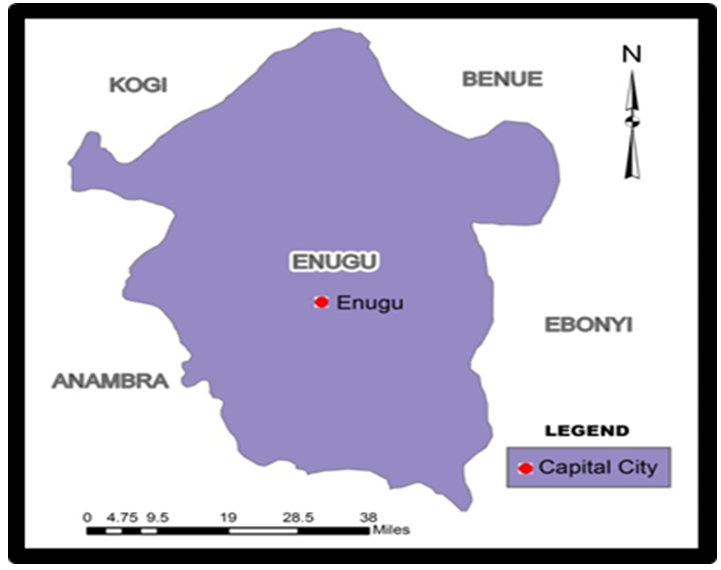
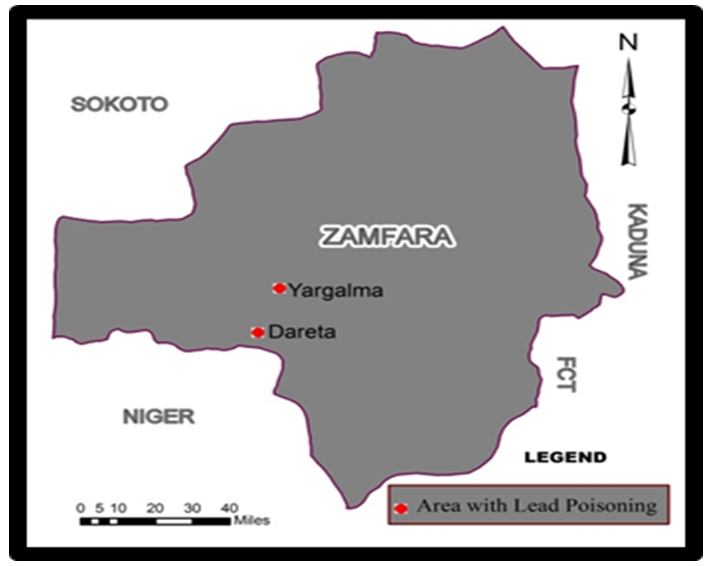
Considering the fact that mining activities in Nigeria operate at below capacity in the absence of proper regulations and standards. Mining practices in the country has resulted in widespread environmental degradation in the form of air particulate emissions, the flow of chemicals from abandoned mines and ponds, water contamination, littering of radioactive waste and land degradation. The cases of human fatalities from lead poisoning prompted by mining remain widespread as well. Furthermore, the doses of air pollution unleashed by solid mineral processing involving limestone quarrying and cement industry along Shagamu and Ewekoro areas of Ogun state in the western region constitutes serious hazards to the public. While the discomfort miles away involves public complaints of eye pains and asthmatic attacks by airborne particulates laced with toxic dust, the concentration and impacts of the plumes on flora led to the decline of kola nut production from local plantations [21]. Elsewhere in the Middle Belt area of the country, communities in several ways have been at the receiving end of damages caused by abandoned mines. Obviously, the people of Plateau state have reluctantly endured the burden of risks from abandoned mines in the country over the years. Considering the damage done to the area from past eras, there are now recurrent dangers from radioactive mine tailings scattered all over to people living around mining fields in Jos, Barkin-Ladi, Bukuru, Bossa and Riyom districts. The risks stem from over 1,000 mine ponds spread all over abandoned minefields along Jos Plateau. While many of the mining ponds within major roads, farmlands, and human settlements in communities with higher level of radiation led to mysterious deaths of citizens in areas that used high level of monazite-rich sand for building. The presence of 1,100 to 4,000 tin and columbite mines, abandoned after the mining boom of the 1960s, now pose serious health hazards to close to 2 million residents in Jos. Most of these abandoned mines when flooded become death traps where citizens drown. This has been compounded by the exposure of citizens to 325 km2 of contaminated land coupled with the presence of carcinogenic radioactive materials and the littering of brain damaging mining wastes in the Jos plateau area [6, 17, 41]. Other instances of fatalities through mining occurred in the Madaka Rafi Local government of Niger State in 2015. The outbreak was far more devastating along the Kwao village area near to the lower stream of the River Kaduna tributary known for the mining of gems and gold. The debacle was characterized by a seemingly exploitative patronage by wealthy dealers of poor artisanal miners operating illegally with risky techniques and little considerations for environmental hazards. Under those conditions, sediments from washed gems and gold on nearby stream flowing down Kawo village turned into a nightmare when citizens unknowingly utilized lead poisoned water for domestic needs from the stream. This exposed villages to deadly poisoning that resulted in many fatalities [42]. Other instances of health risks come from the death of 400 hundred children from lead poisoning due to illegal mining activities in 2010 in Zamfara state in Northern Nigeria [9], and water contamination threats from coal mines in the Enugu area. Of great danger to the ecosystem are the 2000 dug pits from gold mining in the Igun Ijesha area of Ogun state and the fact that the menace of illegal mining in Afikpo, Ebonyi state continues to ravage communities in the area.
3.6. GIS Mapping and Spatial Analysis
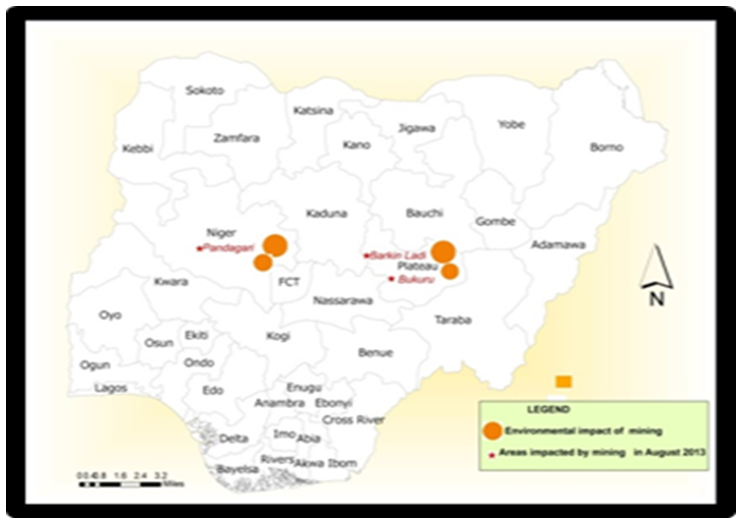
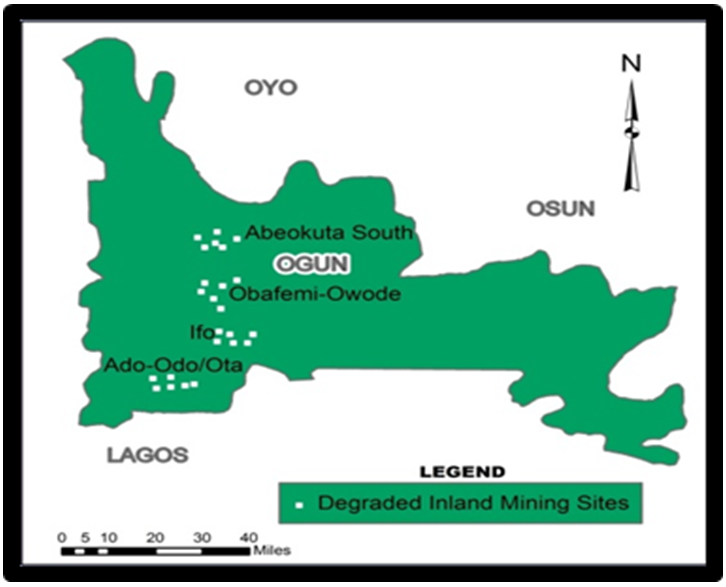
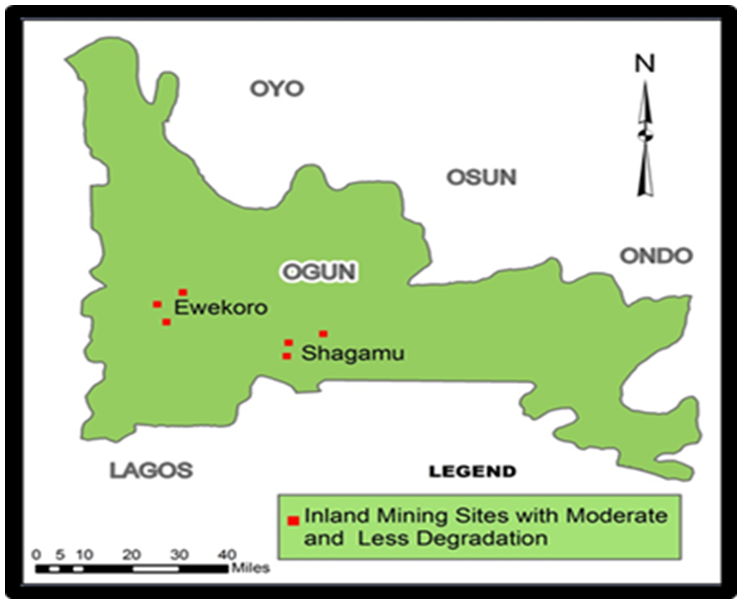
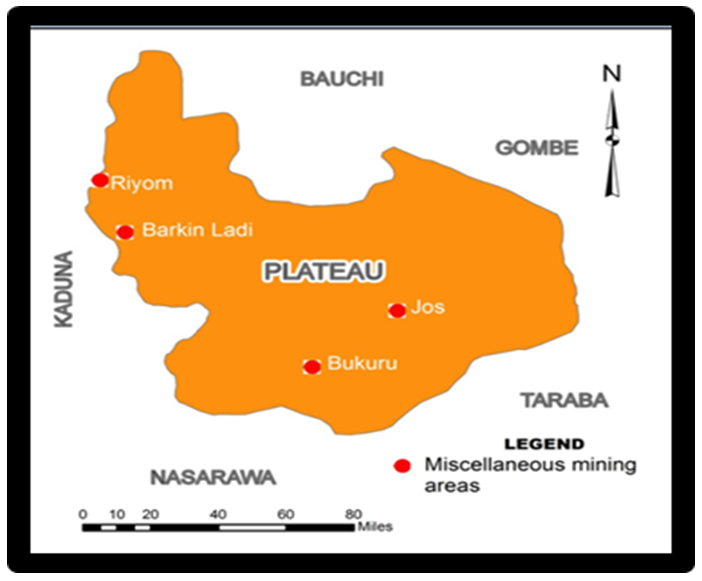
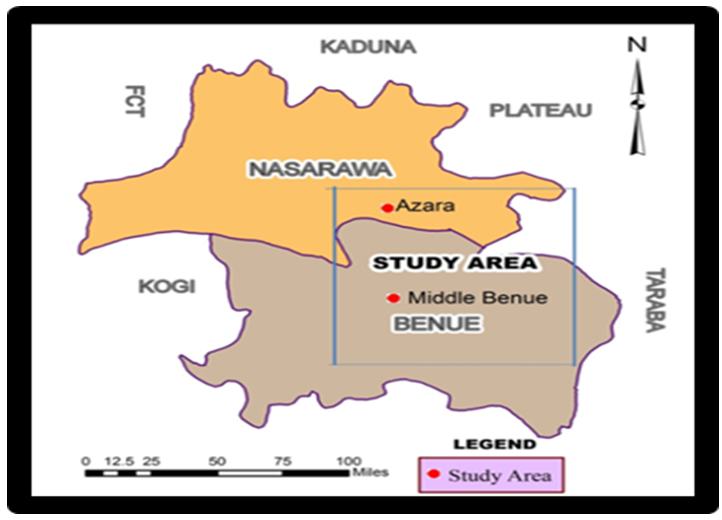
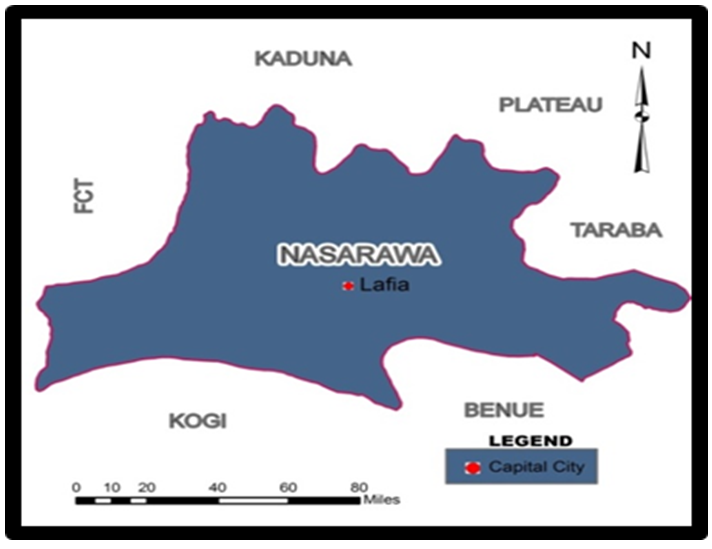
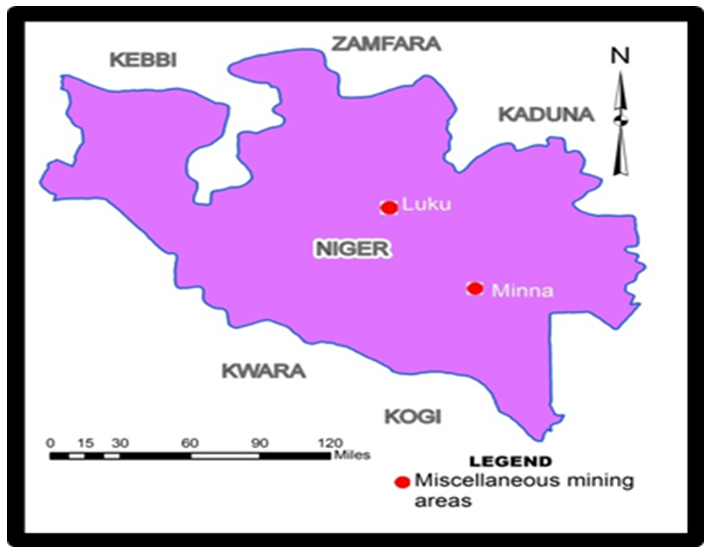
The vast network of mining activities (from the upper north to the lower south areas) in the country left in their wake potential impacts stretching through various geographic regions. In the core areas of the north the ecological effects of mining showed visible presence in the Kalambaina area of Sokoto of the Northwest and Ashaka in the Gombe portion of the region. Although the Middle Belt areas (of Jakura, in Kogi and Gboko in Benue), comes a cluster of areas devastated over the years by quarrying coupled with some spots in nearby South East town of Nkalagu, at Enugu state known for cement production. Elsewhere, the South West and South-South (or South East- Mid-West) zones of the map offers further insights on patches of impacted areas at Shagamu and Ewekoro axis of Ogun state as well as Okpilla in Edo state on the lower side (Figure 2). Other places in Northern Nigeria impacted in August of 2013 consists of major hotspots in the Middle Belt where Pandagori, Niger state and Barkin Ladi and Bukuru, Plateau still bear the scars of environmental damages caused by illegal mining (Figure 3). The recurrent instances of sand mining impacts involving inland and gold mining in the South West between 2010 through 2013, not only stands out as shown in the maps, but reflects negative ecological cost on the surrounding areas in Abeokuta south and Obafemi –Owode, Ifo and Ado-Odo/ Ota in the central and south west areas of Ogun state. With the proximity of the area to coastal zones of Lagos rich in moist tropical forests and biodiversity habitats, repeated disturbances from inland mining resulted in vegetation loss (Figure 4). In the same Ogun state, one notices visible pockets and dispersion of areas exhibiting moderate and less degradation mostly in the Ewekoro and Shagamu areas (Figure 5).From the maps, it is clear that gold mining activities at Igun Ijesha in the northern part of Ogun state during 2012 and 2013 precipitated the concentration of higher levels of heavy metal pollutants in ground water samples than the surface hydrology at the expense of public health (Figure 6). Between 1975 through 2000, came more dispersion of mining impacts onto the landscapes which left many areas in Jos and Bukuru parts of Plateau state badly degraded (Figure 7). Further along in 2009, relentless disasters and dislocations from mining operations continued with incursions into Jos South, Sabon Barki and Gyel in the Plateau area (Figure 8). Aside from that, note also a snapshot of socio-economic impacts of mining highlighted in the Jos south local government areas of Plateau (Figure 9), and the miscellaneous listing of areas on the maps where the environment remains under threat from mining stretching from Riyom-Barkin Ladi areas in Northern Plateau and Jos and Bukuru in the southern portion of Plateau state (Figure 10). Given the interstate dimensions of mining hazards evident along the Azara mines axis and Wuzue in middle Benue and Nassarawa (Figure 11). One need not lose sight of the spatial trends of associated risks and how problems at Uywa marble mining in 2004 prompted degradation and displacement of people at Lafia in Nassarawa and the central part of the state (Figure 12). With similar impacts manifested at Luku and Minna mining districts of Niger state (Figure 13). Instances of water degradation from pollution and land degradation in 2014 and 2010 seemed visibly pronounced at Onyeama mine and other mines in the Enugu area known for coal production (Figure 14), while Yargaima and Darete in Zamfara represent sites of lead poison epidemic in 2012 where many children in the informal mining communities died (Figure 15). | Figure 2. Areas Impacted By Mining Over the years |
 | Figure 3. Locations of Illegal Mining Impacts in 2013 |
 | Figure 4. Inland mining Degradation in the South west |
 | Figure 5. Inland Mining sites with Slight Degradation in Ogun State |
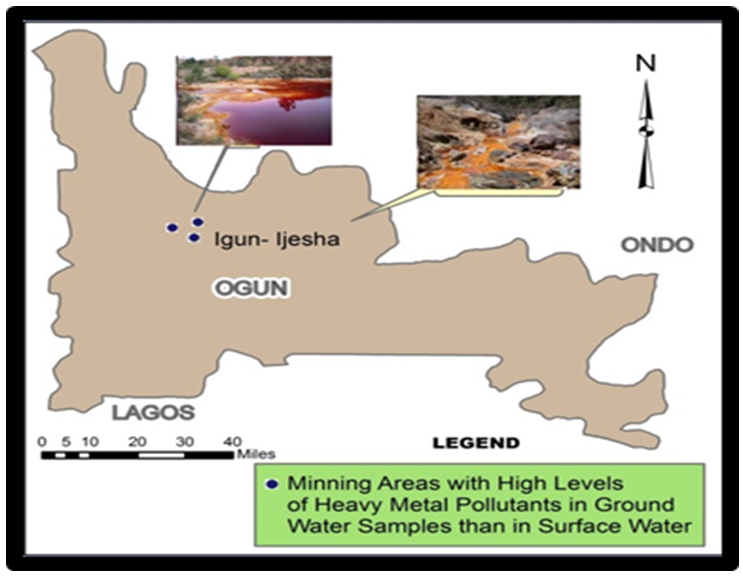 | Figure 6. Dispersion of Heavy Metal Contaminants from Gold mines |
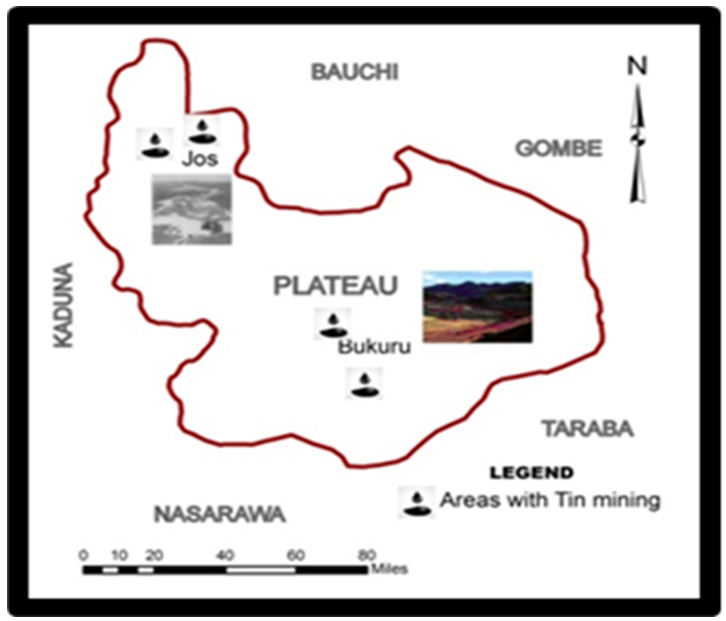 | Figure 7. Tin Mining Impacts in Bukuru-Jos, 1975-2007 |
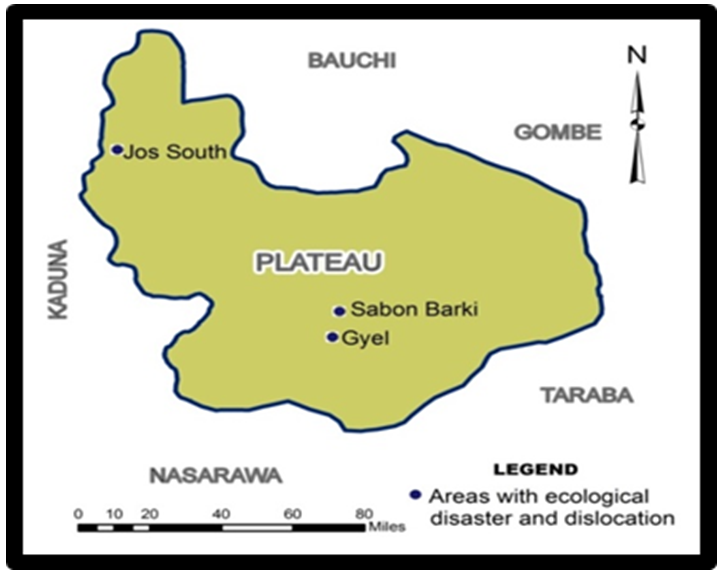 | Figure 8. Sites of Eco Hazards and Social Dislocation, 2009 |
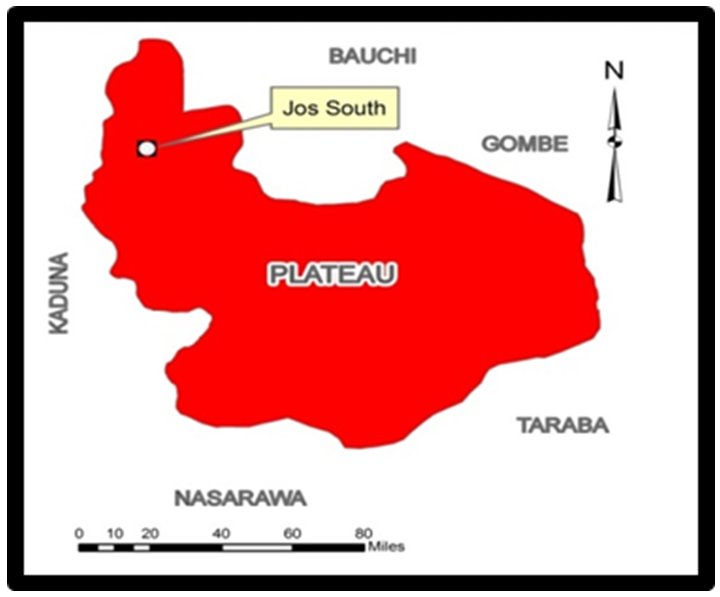 | Figure 9. Location of Socio-Economic Impacts of Tin Mining |
 | Figure 10. Multiple Sources of Tin Mining hazards |
 | Figure 11. Interstate Areas Impacted by Artisanal Mining, 2010 |
 | Figure 12. Degrdation from Marble Mines / Displacemnt, 2009 |
 | Figure 13. Other Sources of Mining Hazards |
 | Figure 14. Sites of H2O Pollution/Land Degradation in Coal Mines, 2014 |
 | Figure 15. Areas Impacted by Lead Poisoning of Children, 2012 |
Aside from the liabilities, the geographic dispersal of minerals under current exploration in the country since 2007 shows a mix of projects involving silver and marble spread across the north west areas of Kalambaina in Sokoto and Kwakuti and Wumo. In the North East areas of the country, note a visible spread of marble deposits in Kano and and Fika and lead mining in the Ashaka area. Stretching into the North Central region, there are vast presence of projects associated with tin and clay mining projects in Jos coupled with a concentration of marble and tin in Azara, Nassarawa and others in Itakpe, Jakura and Igara known for Iron and silver mining activities. On the east of the Niger in the South East and South-South portion of the map, comes a vast network of mining projects dedicated to tin and gold. With the vast presence of marble and clay projects firmly planted along the upper part of the West within the Lagos-Badagry axis to Saki in Oyo, see the vast combination of clay, marble and silver projects stretched through the Mid-West areas of Okpilla, Warake Ughelli, Edo and Delta (Figure 16). 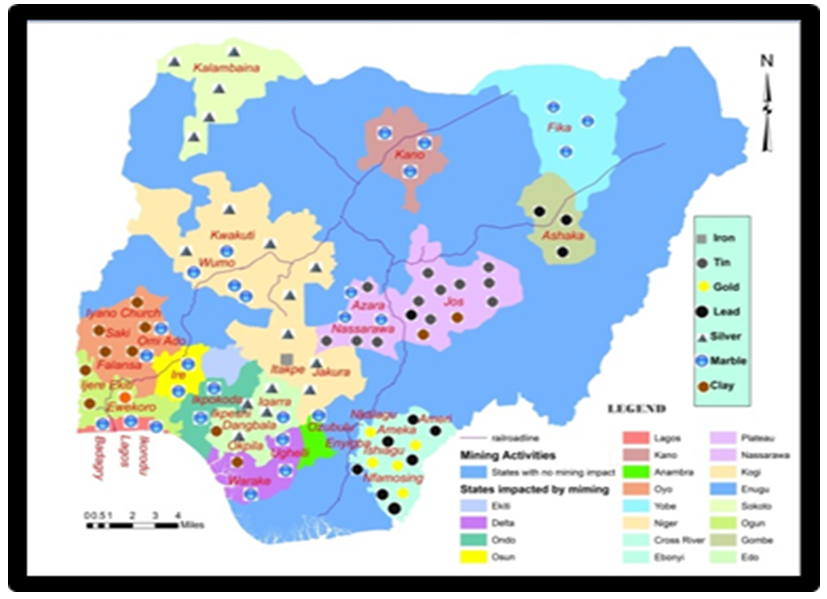 | Figure 16. Spatial Distribution of Mining Sites, 2007 |
3.7. Factors Associated with Mining Liabilities
The ecological liabilities in the Nigerian mining sector are attributed to host of elements. They consist of the lust for economic benefits among the relevant actors, the activities of the informal sector, prevalence of ineffective policy and the lack of records on mining activities across the country.
3.7.1. Economic Elements
The mining sector has been touted as a potential player in the foreseeable future in a country where the federal government still holds all mineral rights. Over the years, government revenues from the solid minerals sector increased from NGN 26.925 billion in 2011 to N31.449 billion in 2012 [5]. The lawful exploration of solid mineral deposit in Nigeria comes with prime benefits such as employment and income generation and ecological dis-benefits. The production and monetary amount of minerals in the country in 2006 among the states shows Lagos alone outpaced the others by N34.73 billion followed by the rest of the other states at N14.98 (with percentage equivalents of 21 to 49). The group of other states active in the production of minerals encompasses Rivers and the Federal Capital Territory where revenues stood at 6.52- 9.95 billion naira representing 9 to 14% of the totals. The trio of states Bayelsa, Delta and Kano posted moderate amounts of 1.67, 1.79, and 2.16 at the rates of 2 to 3 percentage points (Figure 17). Given these benefits, artisanal and small-scale gold mining in Nigeria has been bolstered by historically high gold prices, demands for precious stones and gems and the drive to ensure better livelihoods [43]. Despite its potentials, the mining industry remains largely dominated by informal miners trying to make ends meet without regulatory compliance. Those driven to make a living that way operate under the most difficult conditions fraught with risks to human life and the environment. This in turn translates into mounting ecological liabilities as exemplified by recurrent degradation. As a result, the current activities in the sector are characterized by production and growing environmental declines that were overlooked over the years.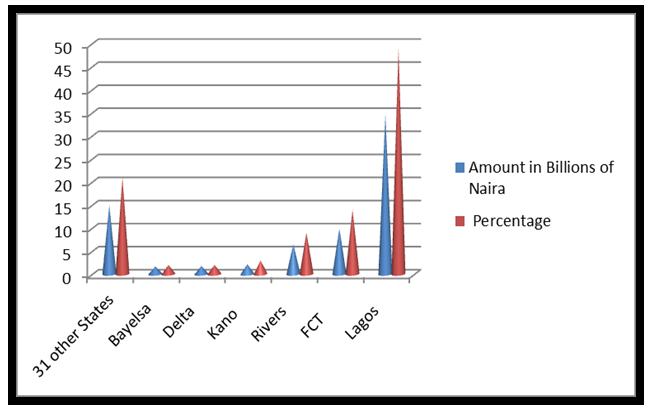 | Figure 17. Mineral Production in 2006. Source: Nigeria National Bureau of Statistics, 2005 |
3.7.2. The Activities in the Informal Mining Sector
The unregulated activities in the informal mining sector over the years have fueled many ecological problems nationwide. In the process, the pressing issues are further compounded by a lack of oversight and the observance of standard procedures in the sector. In the absence of standards, the sector is faced with recurrent hazards from illegal activities, abandoned mines and socio-economic problems of child labor and the exposure of women to health hazards. The nature of recurrent risks in the sector was such that, no year passed without news of major mishaps resulting in human fatalities. In 2010, unregulated small scale mining in Zamfara resulted in an epidemic of childhood lead poisoning from contaminated gold ore, in addition to extensive mercury exposure in the process. This led to the death of at least four hundred children under the age of five within a six month period [9]. The growing ecological health issues not only lead to the loss of human lives in peasant communities adjacent to mines, but they reflect patterns of hazards associated with informal activities. Under such unregulated settings, the use of women and under age children in the informal processing of minerals and the exposure to life threatening hazards which go unchecked continues to magnify [44]. Notwithstanding that, the industry faces numerous constraints within the informal axis that are exacerbating ongoing environmental concerns. These include the threats of illegal mining and the resultant hazards, the lack of conventional mining infrastructure and the smuggling of minerals out of the country. All these elements under the informal sector are linked to the ecological problems in the mining sector.
3.7.3. Ineffective Policy
The lack of efficient policy frameworks vital in the orderly enforcement of regulatory standards guiding mining activities stands as a key constraint in Nigeria. Added to that, in the area of policy, the mineral and mining Act of 2007 vests control of all properties and minerals on government and prohibits unauthorized exploration of minerals. Unlike nations such as Ghana and Burkina Faso, Nigeria does not have a well-developed large scale –mining sector, and the majority of gold mining in the country is carried out by artisanal and small scale mines [16]. Because much of the artisanal mining activities in Nigeria operate outside current laws and regulation, the sector suffers from large scale illegal operations due to such weak policies and lack of institutional oversight and negligence with risks to the environment. For that, the solid minerals sector has been treated poorly when compared to investments priorities in the oil and gas industry, hence the regulatory failures. In Nigeria where the regulation of overall mining activities shows no differences, the critical concerns facing informal sector are relegated to the background and as a result, they are not accorded the priority that they deserve. When the current mining law addresses artisanal and small scale activities, it is mainly on the provision of extension services; they do not offer meaningful incentives for formalizing informal miners. In fact, the requirement that artisanal miners form cooperatives in order to receive any form of technical assistance from the Ministry of Mines and Steel Development is a big obstacle for many miners, and that means they would continue to operate informally and unable to seek a small scale mining license – the only license available to them under the mining law. Even the membership of and formation of cooperatives among miners does not clearly guarantee eligibility to technical assistance. Such uncertainty only amplifies their involvement in illegal mining activities, hence the ensuing environmental hazards.
3.7.4. Lack of Records on Mining Activities
It is no hidden fact that the current disasters are linked to lack of records to periodically track the scale of emergent stressors from mining activities and the actors involved. With much of the mining activities in the nation carried out by an informal sector lacking regulatory control, environmental liabilities from them get swept into anonymity due to lack of records. Being a common problem in the mining sector, the cadastral office and its appointed officials have no proper way to assess what amount of solid minerals are produced, sold, or consumed by companies let alone track the extent of environment impacts, As a result, when critical disasters occur, they are only made known when they are overly threatening with the damage already done. More so, royalty payments made by the companies are often based on what the operators disclose to the regulators [5]. This is similar to what obtains in the oil industry where the Federal Government finds it difficult to determine how much crude oil is really produced daily, but relies on the figure submitted by the oil producing companies. This has become a problem considering the lack of adequate information on mining operators as well as the scale of resultant impacts. Such scenario makes it hard for the regulators to monitor operators effectively and their associated liabilities. How can one assess degradation without records of the sources and the actors when there is no inventory of mineral stocks? With the key players being informal miners and medium scale operators who hardly keep records, there are no complete official data from the Ministry of Mines and Steel Development on the volume of minerals exported out of Nigeria within the period under review. This makes it difficult to capture the extent of liabilities and the recurrent degradation in the sector. Even when responses occur they are often ad-hoc in nature.
4. Discussion
The paper offered insightful outlook using mix scale approach of GIS and descriptive statistics with solid mineral data, socio-economic, land use and land cover and spatial information although 2008-2012 at the state and local levels in Nigeria. Aside from 208-8% increases (of 240-740 to 38,577-40,000 tons) in tin and coal production from 2008-2012 and the 300% rise in barite output. Annual production of aluminium and gold grew at a rate of 145 to 38.45% nationwide. From the overall analysis, it is clear that Nigeria is well endowed with vast deposits of solid mineral resources stretched across multiple areas across the country. With its history of mining and extensive reserves of solid minerals, including, but not limited to precious metals, stones and industrial minerals, the country has so far not secured the growing benefits from these resources despite their potentials as major revenue source. Despite being a major exporter of tin, columbite, and coal in the early 1970s, the solid mineral sector of Nigeria still tumbled noticeably with the emergence of oil and gas as main revenue generator. This could be attributed to the non-integration of Nigeria’s mining sector fully as a priority into national economic and social policy framework. In as much as the mineral sector still manages to generate revenues for the country in the midst of these challenges. The county is saddled with far reaching ecological degradation with serious consequences on flora and fauna in the areas adjacent to mining activities. At the regional level in the country, there exists notable land loss and degradation in Pandagori and in Bukuru mining areas in Niger and Plateau states. The Bukuru mining districts of Plateau state saw major declines in arable land size (of -29.52 to -13.67 %) in the periods of 1975-1986 and 1975-2005. Further instance of declines involves loss of forested areas of 60% from 1975-1986 and 1975-2005. In the process, a total of -336.77 km2 to 528 km2 in arable land and in forest areas not only disappeared from 1975 to 2005, but they went unaccounted for. With no changes in the uninhabitable terrains of hills and rocks, forested areas as major repositories for biodiversity still posted the biggest losses. The implications in all these from an ecological standpoint is that the disappearance of arable land amounts to putting large tracts of farmland out of operation to the detriment of agricultural productivity and the income earning potentials of local people in affected areas. The same thing can also be said of the degradation of forested land area at a time many are concerned about preserving habitats for biodiversity and the need to contain deforestation. The damage done to the ecosystem from mining through the destruction of sensitive habitats accelerates the threats of soil and wind erosion and loss of green cover in a region already prone to desertification. This is compounded by the incursions of built up places into pristine environments during landscape disturbances brought about by mining activities. The recurrent doses of pollution through solid mineral related activities seem to originate several miles away from cement factories along the Shagamu and Ewekoro axis in Ogun state. In the process citizens outside of the cement production area experience the daily discomforts of eye pains and asthmatic attacks in the area. Elsewhere, the exposure to radioactive minerals created serious health problems for communities in the Middle Belt area of Jos in Plateau state. The hazards stemmed from natural radiations emitted by radioactive byproducts of tin mining and materials left behind due to lack of markets and abandoned mines. This resulted in high level of radiations in adjacent communities and mysterious deaths of citizens where the deceased dwelled in homes built with sands tainted with radioactive materials. Considering that the 1,100 tin and columbite rogue mines orphaned after the mining boom of the 1960s, currently constitutes major hazards to millions of inhabitants living in the Jos Plateau area. The health threat from illegal mining in 2010 in Zamafara triggered mass poisoning from lead contamination. While the GIS mapping reveals clusters of areas prone to mining hazards in the country, the problems stem from several socio-economic elements in the sector. The analytical capability of mix scale tools of descriptive statistics and GIS stood out remarkably in identifying the risks from mining activities. In that light, the paper not only showed the spatial dispersion of the nation’s mineral potentials, but mining activities resulted in serious impacts like landscape degradation and ground water impairment in some areas coupled with social dislocation. Using GIS in that setting to track inland mining degradation of natural areas and heavy metal presence in ground water and the areas threatened with radioactive contamination from abandoned tin mines, enhances our awareness of the nature of ecosystem stress. This in turn provides a framework for analyzing ecosystems at risk. Despite the enormity of challenges including lack of institutional oversight of the sector, the support for oil and gas, negation and the underdeveloped nature of the industry, the activities in the solid mineral industry remains buttressed by the increasing demand over the years for precious metals and mineral commodities from 2008-2012. This is evident with variations in the production of minerals (coal, tin, aluminum, gold, barite and host of others) with notable impacts on the ecosystem [45-47]. Given that the usefulness of GIS stems from its capability in pinpointing the ecological risks of mining and location of minerals. As a remedy, the study offered suggestions ranging from education to the strengthening of policies and environmental protection in the solid mineral producing states of the country. See Appendix A for details of the recommendations.
5. Conclusions
This portion of the study highlights the concluding segment of the research with revealing insights on mining under the following rubrics. a) Minerals deposits are abundant in Nigeria; b) Mounting threats to public environmental health from mining; c) The relevance of the mix scale approach in the study; d) The activities and state of Nigeria’s mining sector attributed to many elements.From the analysis, Nigeria boosts of vast deposits of solid minerals made up of precious metals and various stones such as coal, tin, gold and others with economic benefits and growing impacts on the ecology. From 2008-2012, the total values ranged from 200,000-204,050 thousand metric tons for steel and coal coupled with 3,254,000-1,590,000 tons for lead-zinc ore and gypsum while aluminum finished at 88,400 TMT. Accordingly, the paper identified untapped mineral potentials scattered all over the country from the upper North to the South with their economic stock assessed at trillions of dollars in a way beneficial to the industry. In spite of the negligence of mining for petroleum over the years, commodity statistics shows coal with proven reserves of over 639 TMT and an export potential of 15 TMT yearly. The compilation of information on these minerals in this study is quite vital in the commodity trading sector where daily info on tradable items are quoted regularly among market insiders in major financial centers of the globe to guide investors. In that light, the analysis as carried out here thus stands out as an essential tool for both resource managers and those in the solid mineral sector involved in promoting the industry and attracting investments to boost revenue earnings. Because of the nation’s new policy focus on the promotion of efficient development of mineral resources and the fact that mineralogists identified well over 40 to 50 various types of sub-terrain assets buried across the country. This research is quite timely in providing a rare inventory on the nation’s mineral resources for policy makers, the industry and investors so that they would gain deeper visions on the nation’s solid minerals and optimize the delivery of effective policy to sustain it. Showcasing the nation’s mineral abundance inventory this way validates the relevance of this research in strengthening the capacity of policy making with opportunities for the sector in general. Another important revelation from the analysis stems from the impacts of mining on the surrounding ecology under the human-nature interface theory in which interactions between both results in major changes over a period of time. The effects of mining activity on the ecosystem most notably forest land areas involves green cover losses in Bukuru, Plateau state where initial forest area dropped by 420,52 km2 -399.56 km2 from 1975 to 1986. This went on all through the next two decades until 2005 as the damage on the ecosystem stretched over 370.16 km2 areas with threats to natural habitats. Although mining activities occur at lower scale in the county, they are sources of environmental hazards including air particulate emissions, spewing of contaminants from abandoned mines and ponds, cluttering of radioactive wastes and land loss. Added to that, are the fatalities from lead poisoning during illegal mining and health discomforts of eye and lung irritation and declining farm output. The presence of abandoned mines in central Nigeria decades after operation now threatens millions of citizens in Jos Plateau with mysterious deaths from elevated radioactivity in homes designed with tainted soils. While assessing these hazards provides mitigation opportunity against future occurrences in the communities at risk through restoration. Pinpointing these interactions in light of the inability to anticipate their accumulated impacts in the country remains a major upside in the research for theory, knowledge and management. Identifying such risks as radioactive contaminations from abandoned tin mines and other externalities as done herein not only accords them careful consideration in mitigation, but it puts future recovery and reclamations of abandoned mines to their pre-land use form in the country on a much firmer theoretical footing than before. From the study findings, the applications of mix scale methodology did stand out quite convincingly in helping chart the directions of mining research in Nigeria. Utilizing descriptive statistics and GIS mapping as operational tools under the model added new awareness to nationwide analysis of ecological impacts of mining. Since sustainable use of solid minerals is critical to both mining and market activities in the nation, the mix scale model did emerge crucial in calibrating the index. This approach was quite valuable in delineating the study location and in categorizing the trends, as well as the assembling of information on solid minerals index and land degradation. The other areas of importance in the model center around the design of temporal and spatial distribution of minerals and the identification of the parameters of land cover areas impacted by mining. It also outlined changes in the production and use of precious metals and stones and the number of informal miners and others. This scheme remains vital in serving those undertaking spatial analysis of mining impacts, mineral abundance and the risks. For that, GIS mapping was essential in highlighting the vast concentration of mineral deposits across the nation and the ecological dangers and the scale of their spread as a step towards sound planning and impact mitigation. Pinpointing the dispersion of mineral deposits and production hazards that way helps in the promulgation of safety standards and new regulations to guide the sector. The practical applications of a mix scale approach involving mappings and the compilation of mineral index, as analytical devices, thus enhances our knowledge of Nigeria’s mineral assets and their potentials as well as the ecological risks germane to the mining sector. The socio-economic and physical elements located within the larger mining sector including informal mining and the economic benefits are quite important in assessing the state of the industry and the changes within. With the large deposits of solid minerals in Nigeria, the sector stands as an emerging actor in a nation where state revenues from the solid minerals sector rose from NGN 26,925 billion in 2011 to N31.449 billion in 2012. In showing this, the study not only reiterated the importance of socio-economic and geophysical factors in the country’s solid mineral activities, but also it indicated the manner in which the ecosystem could be impacted by many stressors including air contaminants, abandoned mines, radioactive water pollution and other elements at the expense of citizens. Echoing these links given the omission in the literature, injects a key concern into the forefront of planning and research. In the absence of such examination, little would have been known about how the activities of the solid mineral industry are shaped by factors impacting the ecosystem. With the emphasis on impacts, the results will help shape how countries and resource managers react to ecological costs of mining using compilation of stressors and the index of minerals. These are not only critical tools tailored to sustain policy by changing the behaviour of producers; it will help them become better stewards of the land. This would allow states and communities and the federal government design the right measures for minimizing the vulnerability of fragile ecosystem to recurrent degradation from mining. In that light, the research offers decision makers an improved understanding of unknown risks factors. Realizing the widespread challenges in Nigeria’s mining sector, the huge deposits, the economic benefits and ecological degradation in the context of this research, policy makers and scholars in the country would be hard-pressed in the future to pursue serious answers to several burning questions germane to the management of solid minerals. The questions involve how will mining be carried out in an environmentally sustainable manner? What role will policy instruments play towards the attainment of environmental safety in the exploration of minerals? How will Nigerian institutions adapt to the emerging role of solid minerals as a force in the economy? Drawing from these questions, there are full opportunities for the learned community and the policy arena to redirect the scheme on mineral management with policies emphasizing environmentally safe exploration. This will make Nigeria harness its vast deposits of commodity minerals more sustainably for the common good of citizens and the economy and ecosystem protection in the foreseeable future.
Appendix - A
4.1. Recommendations4.2.1. Education and Social ProgramMining operations as practiced in the real world require specialized expertise with extensive capital and mechanized techniques to ensure proper handling of mineral ores under a cumbersome process full of occupational and ecological risks. Yet in Nigeria known for lax regulations, informal miners dominate the sector under the worst conditions devoid of permits and no records of activities. Unregulated small scale activities of that nature in 2010 in the Northern state of Zamfara led to lead poisoning and the death of 400 children under the age of five and the exposure of women to the health hazards of mining camps. The risks involved call for compulsory education and social programs to alleviate the sufferings of those trapped in artisanal mining camps. Because the technical difficulties encountered by informal miners frequently come from their lower education levels, they also have no knowledge of the policy demands on work-related health safety measures and environmental law. Turning their lives around under the proposed scheme should involve skills training and knowledge acquisition efforts to boost basic income earning potentials for women. There is also a need for mandatory primary and secondary education for the victims of child labor under the direct supervision of the state so that they are not lured back to the harsh conditions of illegal mining camps. Had these impoverished peasants in the artisanal mining communities been fully integrated into their localities, through the necessary education and enlightenment campaigns about their rights, and the environmental hazards involved in illegal mining, and keeping children in schools instead of wooing them into mining camps, many lives would have been saved. In that light, the paper recommends the need for education and social programs to sustain the welfare and needs of citizens in various mining districts of the country. 4.2.2. Policy Enhancement The Nigerian mining policy is punctuated with ambiguity, in which the government solely promotes oil and gas sector with incentives, while doing nothing for solid minerals. This is contrary to the early days when mining and agriculture dominated the economy. Such inability to design a structure that harnesses the solid minerals commonly found in Nigeria to the benefit of citizens remains the bane of the nation since 1960. While presently, minerals in Nigeria represent only 0.3 per cent of its GDP [3, 16], due to the incoherent policy and the influence of oil. The local mining industry not only languishes in underdevelopment making Nigeria import supplies it could produce locally from salt to iron sheets. It is estimated that of the 3,163 companies granted 1,443 mining titles during this fiscal period; just 30% partake in mining. Consequently, 70 per cent of mining title holders in Nigeria are inactive companies, and some engage in speculative activities in which only a few pay their annual fees as required by law [5]. With this anomaly, the low activity in the sector is not yielding the desired financial benefit as there are no records of payment of taxes and royalty to the government. In the process, Nigeria is losing revenues from untapped minerals and the little being mined mostly by the illegals. Under the current disarray in which regulators are overwhelmed, it becomes daunting to ensure sustainable management of minerals with enforceable regulations in a sector dominated by orphan mines. As a remedy, the paper suggests the strengthening of current policy using command and control measures built on accountability and polluter pay principles. This can be attained by reforming the industry in line with stipulated standards and attracting investors with yearly infusion of $10 billion, in a way that makes the nation attain its aim of emerging among the top 20 economies in the world by 2020. 4.2.3. Solid Mineral Mapping and Information SystemAt the writing of this paper, there was no locally held data clearing house on solid mineral activities in Nigeria. Much of the time series on Nigeria’s mineral industry were housed in foreign data bases such as the United States Geological Surveys global data bases and others. Even when available, they were not comprehensive enough in showing the corresponding socio-economic data like price of minerals, taxes, royalties, costs, and profits along with the liabilities made up of number of abandoned quarries and occupational hazards or mining accidents. Additionally, a review of the various data agencies in Nigeria including the Ministry of Mines and Steel Development showed an absence of any consistent inventory on the state of the solid mineral industry and the corresponding ecological costs. There are also no records on the exact volume of trade activities involving solid minerals produced, sold or consumed. Any country lacking information on the size of its natural resource potentials and deposits faces hard times managing the sector sustainably. The absence of public records on such precious commodities results in loss of tax revenues and access to opportunities, which in turn makes illegal mining and smuggling lucrative for some. Aside from all these deficiencies, the country lacks up to date geological mappings pinpointing the vast deposits of mineral resources scattered across the states. There is also no interactive nationwide geospatial data system on mining information that could track the interactions between the market demands of solid minerals and the environment. Having such a tool sharpens regulatory capacity in areas threatened by unsustainable mining activities. In light of that, the paper proposes the design of a comprehensive solid mineral information system anchored in GIS to track interactions with the ecosystem coupled with regular geological mapping of the nation’s solid minerals. 4.2.4. Regular Assessment of Ecological Liabilities The mining districts in Nigeria have for years been the sites of widespread degradation in the absence of regular assessment of these liabilities. This is evident from the extent of ecological disturbances involving artisanal and conventional operators in the country. The propensity of artisanal mining to landslides and radioactive contaminations pushes miners onto easy-to-find minerals and instant exit from the scene of hazards in adjoining communities once the ore is extracted. Given the risks involved and outbreak of lead poisoning epidemic in Zamafara state in 2010, the mining sector will benefit from monitoring the activities of informal mining techniques often linked with health hazards and unsafe environmental practices. Accordingly, the periodic monitoring of essential indicators of flora and fauna, hydrology and the human environment will serve a useful purpose from a regulatory standpoint in areas where abandoned mines seriously threaten the public through water contamination and land degradation. With the degradation of large areas of land cover types between 1975 through 2005 in the Bukuru area of Plateau state and Pandogari, Niger state resulting in the disappearance of natural habitats from mining. The country will benefit from an inventory of biodiversity by assessing the status of sensitive areas adjacent to mining sites. Therefore, the paper supports the assessment of ecosystems adjacent to mining activities across the nation.
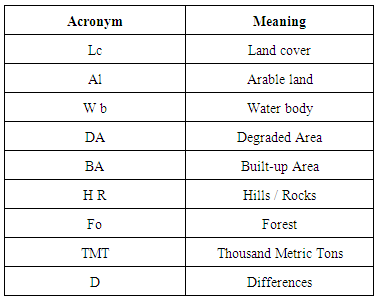
Acronyms
References
| [1] | Nwadialor, I.J. (2011). Minimizing The Impacts of the Mining Alternatives for Sustainable Mined Out area Conservation. FUTY Journal of The Environment. 6:2. |
| [2] | Musa, M.S. (2013). Mid Term Report For The Minerals and Metals Sector. Ministry of Mines and Steel Development. Abuja, FCT: Ministry of Mines and Steel Development. |
| [3] | Fayemi, K. (2015 December). State of The Solid Mineral Sector and Formal Inaugural briefing Meeting. Presented at the office of Solid Mineral and Development. Abuja, FCT: Office of the Minister. |
| [4] | Extractive Industry Transparency Initiative (EITI 2015). Nigerian Mining Sector Open Up. Olso, Norway: EITI. |
| [5] | Omoh, G. (2016 May). Dangote Contributes 53% of Govt Revenue In Mineral Resources Sector. Retrieved on 26th May 2016 from http://www.vanguardngr.com/2016/05/dangote-contributes-53-govt-revenue-mineral-resources-sector/. |
| [6] | Edun, E.O. (2013). Inventory of Abandoned Mine Ponds/Dams On The Jos-Bukuru North-Central Nigeria Using G.I.S And Remote Sensing Technique. The International Journal of Engineering and Science IJES. 2:5: 62-73. |
| [7] | Grossman Elizabeth (2012). How Gold Mining Boom is killing the Children of Nigeria.Yale Environment. Yale School of Forestry and Environmental Studies. |
| [8] | Plumlee, G. (2013 June). Linking Geological and Health Sciences to Assess Childhood Lead Poisoning From Artisanal Gold Mining In Nigeria. Environmental Perspectives. 121; 6: 744-750. |
| [9] | Katz, A. (2010 December). African Gold Rush Kills Children as Miners Discovers Lead Dust. Business Week. 1-9. |
| [10] | Awala, C.O.C. (2014). Environmental Impact Assessment of Coal Mining Activity in Enugu Metropolis, Enugu State Nigeria. Journal of Software Engineering and Simulation 2:5:01-15. |
| [11] | Onkwuka, S.U. (2013 July). Socio-Economic Impacts of The Tin Mining In Jos Plateau Nigeria. International Journal of Engineering Science Invention 2: 7: 30-34. |
| [12] | Ayantobo, O.O. (2014). Gold Mining In Igun Ijesha, South Western Nigeria: Impacts and Implications For Water Quality. American Journal of Engineering Sciences. 10:3:289-300. |
| [13] | Haruna, Musa (2011). An Assessment of Mining Activities On Vegetation in Bukuru. Jos Plateua State Using Normalized Differentiated Vegetation Index NDVI 4:6: 150-159. |
| [14] | Ashano, E. (May 2010). The Effects of Mining On Water Quality and The Environment: The Case Study of Parts of the Jos Plateau, North Central Nigeria. The Pacific Journal of Science and Technology 11:1:631-639. |
| [15] | United States Geological Survey (USGS 2014 February). USGS Minerals Year Book 2012: The Nigerian Mineral Industry 2008-2012. Washington, DC: United States (US) Department of the Interior, p 34.1-34.6. |
| [16] | Onwuemenyi, O. (2016 a April). Nigeria Struggles with Perception Issues in Investment a Review of Nigeria’s Energy Industry. Sweet Crude. |
| [17] | Wapwera, D. (2005). Abandoned Mines, Potential Home For The People, A Case Study of Jos Plateau Journal of Civil Engineering and Architecture. 9: 425-445. |
| [18] | Adedeji, O.H. (2014) Assessing The Environmental Impacts of Inland Sand Mining In Parts of Ogun State Nigeria. Ethiopian Journal of Environmental Studies and Management. 7:5:478-487. |
| [19] | Chanada, M.S. (2010). Environmental Impacts of Artisanal Mining of Barytes In Azara Area , Middle Benue Through Nigeria . Online Journal of Earth Sciences . 4:1:38-42. |
| [20] | Ekeleme, I.A. (2013). Environmental Impacts of From Lead –Zinc Mining and Lead Arsenic Toxicity Effects in Arufu Area, NE Nigeria. Journal of Environmental Science, Toxicology and Food Technology. 6:2;72-89. |
| [21] | Aigbedon.1 (2007). Environmental Effect of Mineral Exploitation in Nigeria. International Journal of Physical Sciences. 2:2:033-038. |
| [22] | Merem, E.C. (2016). The Growing Issue of Mercury Exposure and the Threats in the African American Community. Journal of Frontiers in Science.1-15. |
| [23] | Merem, E.C. (2016). The Geography of Wind Energy Use in the Mid-West Region of the US. Journal of Energy and Power. 6:1:1-15. |
| [24] | Merem, E.C. (2016). Assessing the Environmental Impacts of Agricultural Subsidy in the Mississippi Delta Region Using GIS. International Journal of Agriculture and Forestry. 6:1:1-21. |
| [25] | Merem, E.C. (2014 April). The Analysis of Coal Mining Impact on West Virginia’s Environment. British Journal of Applied Science and Technology. 4:8:1171-1197. |
| [26] | Merem, E.C. (2015 March). GIS Assessment of Farm Landscape Change In South Carolina Lower Region. International Journal of Agriculture and Forestry. 5: 2: 92-112. |
| [27] | Merem E.C (2015 March). Analyzing Environmental Issues In The Lower Savannah Watershed, In Georgia and South Carolina. American Journal of Environmental Engineering. 5:1. 1-20. |
| [28] | Usery. E.L. (2004). Geophysical Data Resampling and Resolution Effects On Watershed Modelling: A Case study Using Agricultural Non-Point Source Pollution Model. Journal of Geophysical Systems. 6:289-306. |
| [29] | Russell, G. (2007). The Role of GIS In Selecting Site For Riparian Restoration Based On Hydrology and Land Use. Restoration Ecology, 56-68. |
| [30] | 30.Musa, D.M. (2015). Land Pollution: A Major Impact of Baryte Mining in Azara Nigeria. Asian Journal of Applied Sciences. 03:01:88-93. |
| [31] | Ndinwa, C.C. (2014). Environmental and Health Impact of Solid Mineral Exploration in South Northern Nigeria. A Case Study of Igara Edo State. Review of Environment and Earth Sciences 1:2:24-36. |
| [32] | Wulyer, E. (2011). Environmental Impact of Coal Mining and Coal Utilization in Nigeria. In Proceedings of The GSA Annual Meeting , Minneapolis, Minnesota USA. |
| [33] | Afoke, O. (2014). Nigeria Abandoned Tin Mines endanger Communities, Plateau State Nigeria. Environmental Justice Atlas/ Earth Rights Action. |
| [34] | Merem, E.C. (2016 March). Assessing the Ecological Effects of Mining in West: The Case of Nigeria Africa. Proceedings of 24th AEHS Conference, San Diego: CA. |
| [35] | Federal Government of Nigeria. (2001). First National Biodiversity Report. Abuja, FCT: FGN. |
| [36] | Onwuemenyi, O. (2016b February) Nigeria Sees Emerging Vision to Resuscitate the Mining Sector a Review of Nigeria’s Energy Industry. Sweet Crude. |
| [37] | Baroungi, B. (2014). Nigeria: African Economic Outlook. AIDB. |
| [38] | Salau, S. (2015 September). Mining to Lift Nigeria GDP in 2020 by 10%. The Guardian. 1-2. |
| [39] | Dukiya, J. (2013 Jul -Aug). The Environmental Implication of Illegal Mining Activities in Nigeria, a Case Study of Pandogari and Barkin Ladi/Buruku Surface Mines in Niger/Plateau States. IOSR Journal of Humanities And Social Science (IOSR-JHSS) 13-19. |
| [40] | Solomon, J. (2012 May). Impacts of Derived Tin Mining Activities on Landuse/Landcover in Bukuru, Plateau State, Nigeria Journal of Sustainable Development 5: 5: 90-100. |
| [41] | Faden, J. (2015 February). Jos a Century of Tin Exploration and Environmental Neglect. International Center For Investigative Reporting. |
| [42] | Nmodu, A. (2015). Comments: How Illegal Mining Led To The Deaths of 28 Children in Niger. Leadership. |
| [43] | Owen, O. (2008 21 November). Big Miners Stay Away From Jos Plateau. The Africa Report. |
| [44] | Environmental Law Institute (ELI). (November 2014). Artisanal and Small Scale Gold Mining In Nigeria: Recommendations to Address Mercury and Lead Exposure. Washington, D.C.: ELI, 1-42. |
| [45] | Idrisi, G.N. (2004). Environmental Impact on Surface and Ground Water Pollution from Mining Activities In Ikepshi Edo State Nigeria. International Journal of Geosciences. 5:749-755. |
| [46] | Ako, T. A. (2014). Environmental Impacts of Artisanal Gold Mining in Minna Niger State. North Central Nigeria Journal of Geosciences and Geomatics. 2:1:2:8-37. |
| [47] | Ololade, O. (2015 October). The Doom behind the Glitter. The Nation. |

 Abstract
 Reference
 Full-Text PDF
 Full-text HTML