Joan J. Kiptarus1, Alex M. Muumbo2, Augustine B. Makokha1, Stephen K. Kimutai1
1Moi University, Department of Mechanical & Production Engineering, Eldoret, Kenya
2Technical University of Kenya, Faculty of Engineering Science & Technology, Nairobi, Kenya
Correspondence to: Joan J. Kiptarus, Moi University, Department of Mechanical & Production Engineering, Eldoret, Kenya.
| Email: |  |
Copyright © 2015 Scientific & Academic Publishing. All Rights Reserved.
Abstract
Most of the minerals found in Kenya still remain unexploited due to inadequate knowledge on their status, economic viability and requisite mining technologies. Importing metallic products such as lead, iron, zinc, copper etc. from other countries are very expensive despite Kenya’s potential to exploit existing mineral resources. This study aimed at characterizing the selected mineral ore deposit from Katse area in Mwingi North Constituency in Kitui County, Kenya. The quality of the iron ore was evaluated to establish its suitability as a raw material for iron production in Kenya. Samples were obtained along the perimeter vertices and centre of a land parcel measuring 150m2 with each excavation being 50cm length, 50 cm width and 500cm depth. Detailed studies were conducted to establish the composition and properties of the 5 samples. X-ray Diffraction (XRD), X-ray Fluorescence (XRF), Atomic Absorption Spectrometry (AAS) and Petrography microscopy techniques were employed in the investigation. XRD studies revealed magnetite in excess of (86%) as the major mineral with subordinate amounts of hematite and quartz. XRF studies indicated a high content of iron (above 80%) with minor amounts of (5% Al2O3, < 5% TiO2, 1-44% SiO2, <1% of MnO, P2O5, SO3, K2O, V2O5). AAS experiment results indicated that the Iron content was above 90% with minor amounts of SiO2, Al2O3, CaO, MgO, Na2O, K2O, TiO2 and MnO elements. Petrography results indicated the major minerals in the iron ore to be magnetite with minor amounts of hematite and quartz; however, the iron ore is characterized by simple lamellar and specula texture with mutual grain boundaries between individual minerals suggesting the minerals breakage along grain boundaries. The quality of this ore was compared to generalized world market standards and ores from other nations. The results indicated that Katse ore is a rich Magnetite grade with Fe content above 80% with minor amounts of hematite, with quartz and clay as the major gangue (<1% SiO2 and <1% Al2O3) and low contents of the deleterious elements ( <1%), which correspond to acceptable levels for commercial iron ores.
Keywords:
Characterization, Magnetite, Iron ore, Composition, Analysis
Cite this paper: Joan J. Kiptarus, Alex M. Muumbo, Augustine B. Makokha, Stephen K. Kimutai, Characterization of Selected Mineral Ores in the Eastern Zone of Kenya: Case Study of Mwingi North Constituency in Kitui County, International Journal of Mining Engineering and Mineral Processing , Vol. 4 No. 1, 2015, pp. 8-17. doi: 10.5923/j.mining.20150401.02.
1. Introduction
Characterization of a mineral ore is a very important step to perform before any processing takes place whereby quantity, grade or quality, densities, shape, and physical characteristics are determined to allow for appropriate application of technical and economic parameters to support production planning and evaluation of the economic viability of deposits. Iron ore is the most abundant rock forming element and composes about 5% of the Earth's Crust. The most importantly used iron-bearing minerals from which iron compounds can be extracted includes: hematite, Fe2O3 (70% Fe); magnetite, Fe3O4 (72% Fe) and of much less importance: limonite, 2Fe2O3·3H2O (60% Fe); siderite, FeCO3 (48.3% Fe); pyrite, FeS2 (46.6% Fe) [1], where these iron percentages are in their pure states. Kenya has ample iron ore deposits which are yet to be fully exploited and utilized for the development and economic growth of the nation. There are iron ore deposits in counties like Taita Taveta (Manyatta), Tharaka (Marimanti) and Siaya (Samia) which have not been fully exploited and thus there is need to amass information on the quality of the iron ore deposits and the method for pre- processing as a precursor to setting up a steel plant [2].Katse iron ore deposits are situated in Mwingi North constituency in Kitui County, Kenya (Lying between Latitudes 0° 03’ and 1° 12’ South and Longitudes 37° 47’ East) about 236km off Nairobi - Garrissa road. However, they still lie unexploited and little study has been done on them. The primary objective in this research was to provide comprehensive data on the chemical composition. These included mineral phase analysis and elemental composition with a view of finding out and understanding the best possible technique by which the iron ore could possibly be processed. The analyzed chemical compositions of the ore are compared to those of major iron ore producing nations like China, Australia, Brazil, India, Russia, Ukraine, South Africa, USA, Canada, Iran, Sweden, Kazakhstan, Venezuela, Mexico and Mauritania.
2. Experimental Work
2.1. Sample Collection
Iron ore samples were collected from five locations within the Katse deposits area: location 719, location 720, location 721, location 722 and location723. The samples were collected along the perimeter vertices and centre of a land parcel measuring 150m2 with each excavation being 50cm length, 50 cm width and 500cm depth. In this study, the ores were designated as: Sample 1, Sample 2, Sample 3, Sample 4 and Sample 5 respectively.
2.2. Procedure
1 kg of each representative rock samples were dried in an oven at 105°C to a constant weight in a muffle furnace and then allowed to cool at room temperature in a desiccator. The samples were then pulverized to 300 microns for different analyses. 0.1g of each pulverized samples were put in a plastic bottle. The samples and the standard were analysed using AAS for Ti, Si, Al, Fe, Mn, Pb, Ca, Mg and Zn in the usual manner [3]. The Fe2O3 content was calculated from those results.10 g of the pulverized sample was mixed with 5g of flux starch and the resultant mixture mixed in a mortar and pestle. The resultant mixture was made in to pellets using hydraulic press. The pellets were fed in to the XRF machine for analysis of Ti, Fe, S, P, K, CA, Mn, V, Cr, Si and Al as oxides [4]. Analysis of X-Ray Diffraction was performed on the iron ore. Each sample was placed in a standard sample holder on the gionometer of the Rigako Miniflex II X-ray diffractometer. It was configured with a counter monochromator, ICCD software and an environmental dust determination (SiO2) software. The diffraction beam monochromate kβ foil filter operated at 30 kV and 15 mA with scanning range of -3 to 145° (2θ) and a scanning speed of 0.01 to 100°/min (2θ) with accuracy of ±0.02°. Minerals were identified using the ICDD software of the International Center for Diffraction Data. Petrographic analysis was performed on seven samples of the iron ore. An area measuring approximately 24.5cm2 was selected and cut from each sample, then dried at 30°C for several hours, before being vacuum impregnated with epoxy resin. The concrete slice was then glued to the etched surface of a glass slide using the Canadian Balsam.Each sample was reduced to a thickness of 30 microns by a series of grinding process. Polishing process was done to remove the last thin layer of the deformed metal for a smooth reflective surface and finally sealed with a cover slip and the thin-sections were subsequently examined under a combination of plane and cross-polarized light using a petrographic microscope.
3. Results and Discussions
3.1. Introduction
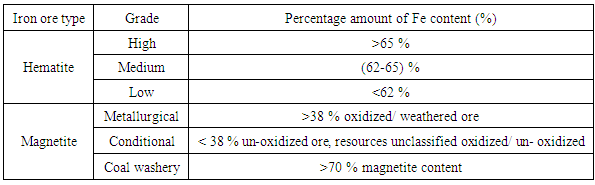
Iron ores should preferably have high Fe contents and low impurity element contents, in order to justify the investment during exploitation. In the world practice, no minimum standards have been set for iron, silica, alumina, calcium, and magnesium percentages in commercial iron ores, although certain generalizations can be made [5]. The generalized content for the most important elements in raw iron ores are given in Table 1.Table 1. Classification of the Major Iron Ores According to Quality Grade
 |
| |
|
3.2. Chemical Composition of Katse Iron Ores
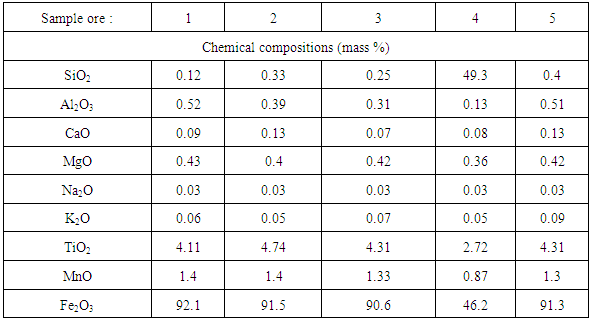
Table 2 shows the results of the chemical analysis of Katse iron ore in weight percentages. Samples from four locations (719, 720, 721 and 723) exhibit very high iron content of (90–92.5) %, with correspondingly low levels of silica (0.1–0.4) % and alumina (0.3–0.52) %, respectively.Table 2. Chemical Composition of Katse Iron Ore
 |
| |
|
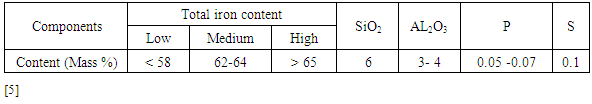
However, sample (4) from location 722 has a low iron content (46.2%), lower alumina (0.13%) and higher silica content (49.3%). In addition, the ores contain other impurities such as CaO, MgO, Na2O, K2O, TiO2 and MnO which exist in considerably negligible amounts. Alumina represents contamination in the steel making process and is specific targets during iron ore beneficiation [6].The ore from location 722 contains 46.2% Fe and correlates to the low-grade ores although it has a relatively high content of gangue materials (about 49.3%). The total iron content of most exported iron ores in the world is in the range of 62–64% [7]. Therefore, the average quality of iron ores from the five locations of Katse deposit is above and comparable with the best iron ores nations hence are among the world high-grade ores which can be exploited.Generalized contents for SiO2 and Al2O3 requirements in commercial iron ores are shown in Table 3. It can be observed that the silica and alumina contents of Samples 1, 2, 3 and 5 (0.1 – 0.4% SiO2 and 0.1 - 0.52% Al2O3) are within the acceptable limits for commercial ores. However, sample 4 has high silica content, which is above the acceptable level. The contents of SiO2 and Al2O3 in commercial ores should be less than (6 and 4) %, respectively which corresponds to the four samples analyzed.Table 3. Generalized Percentages of Elements of Major Interest in Analyzing Iron Ore
 |
| |
|
3.3. Elemental Analysis of Katse Iron Ores
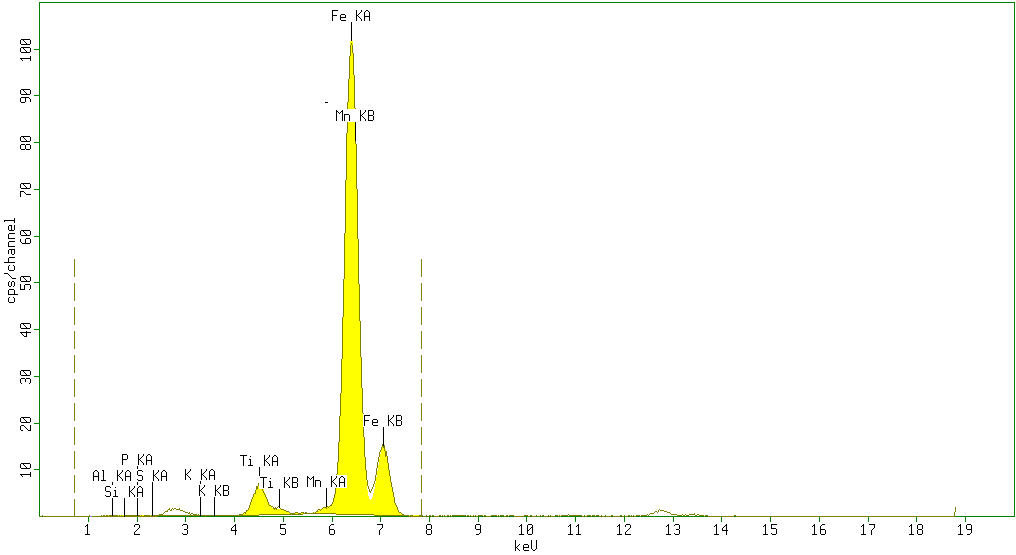
The results of X-ray Fluorescence analysis of iron ores from the 5 different locations of Katse deposits are as shown in figures: 1, 2, 3, 4 and 5 respectively.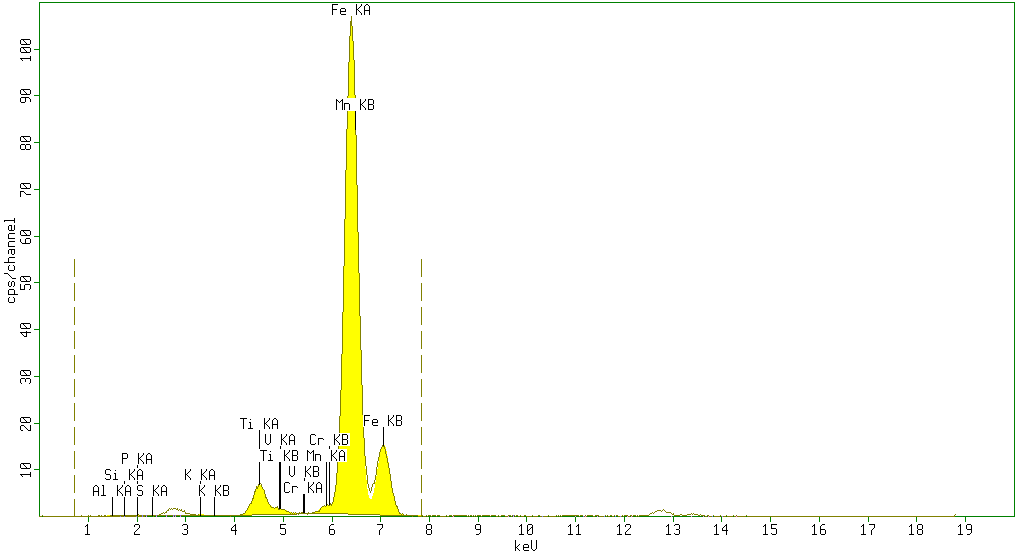 | Figure 1. Sample 1 showed high percentage of Fe2O3 (87.1%) and minor amounts of TiO2 (4.5%), Al2O3(5%) andSiO2 (1%) with neglegible amounts of P2O5 (0.7%), SO3 (0.4%), K2O (0.2%) V2O5 (0.1%) Cr2O3 (0.03%) and Mn (0.96%) |
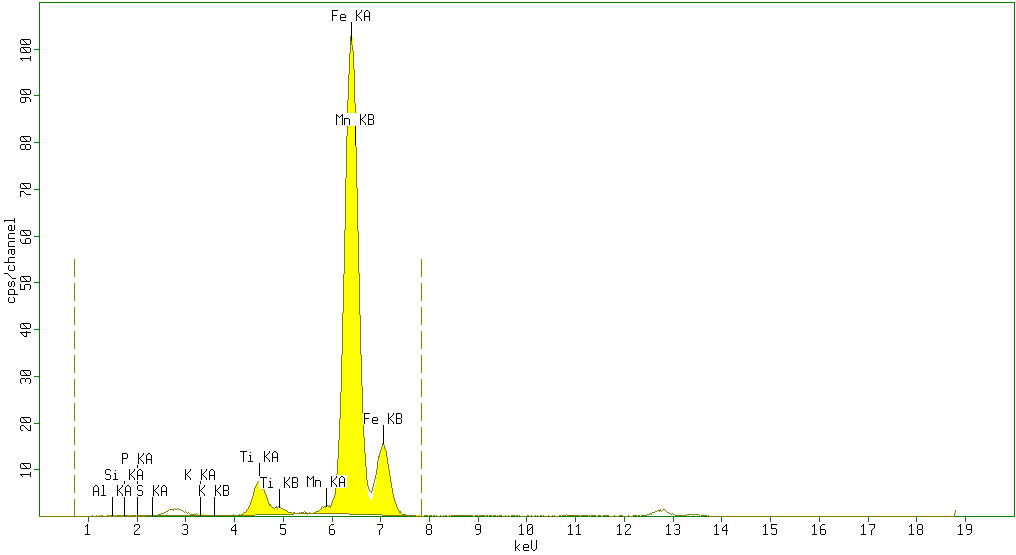
 | Figure 2. Sample 2 showed high percentage of Fe2O3 (84.4%) and minor amounts of TiO2 (4.7%), Al2O3 (5%) andSiO2 (0.8%) with neglegible amounts of P2O5 (0.2%), SO3 (0.4%), K2O (0.2%) V2O5 (0%) Cr2O3 (0%) and Mn (0.88%) |
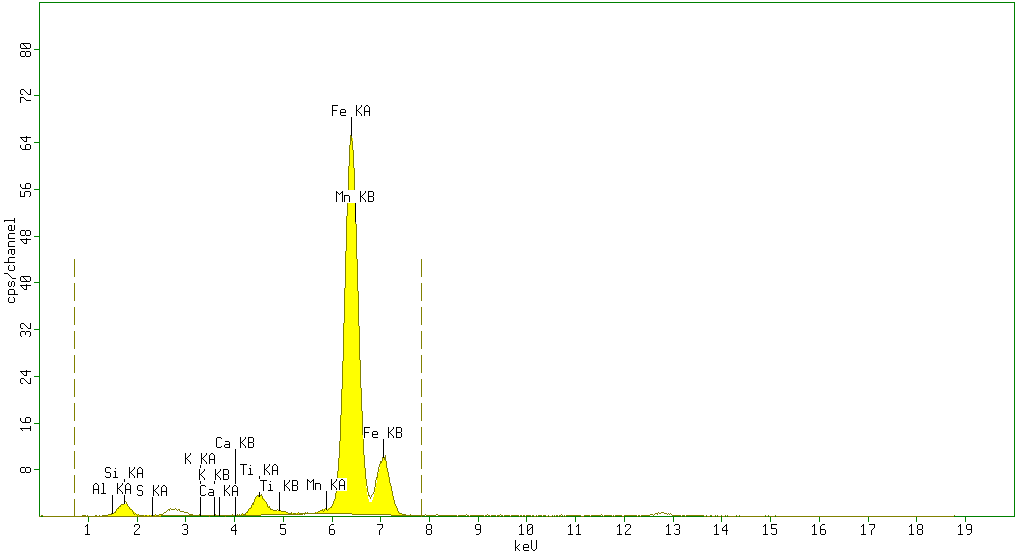
 | Figure 3. Sample 3 showed high percentage of Fe2O3 (88.5%) and minor amounts of TiO2 (5%), Al2O3(3%) andSiO2 (0.8%) with negligible amounts of P2O5 (0.7%), SO3 (0.4%), K2O (0.2%) V2O5 (0%) Cr2O3 (0%) and Mn (0.9%) as impurities |
 | Figure 4. Sample 4 showed moderate percentage of Fe2O3 (46.6%) and high amount of SiO2 (44%). Minor amounts of TiO2 (2.9%), Al2O3 (5%)with negligible amounts of P2O5 (0%), SO3 (0.5%), K2O (0%) V2O5 (0%) Cr2O3 (0%) and Mn (0.43%) Large percentage of impurities was evident in this sample |
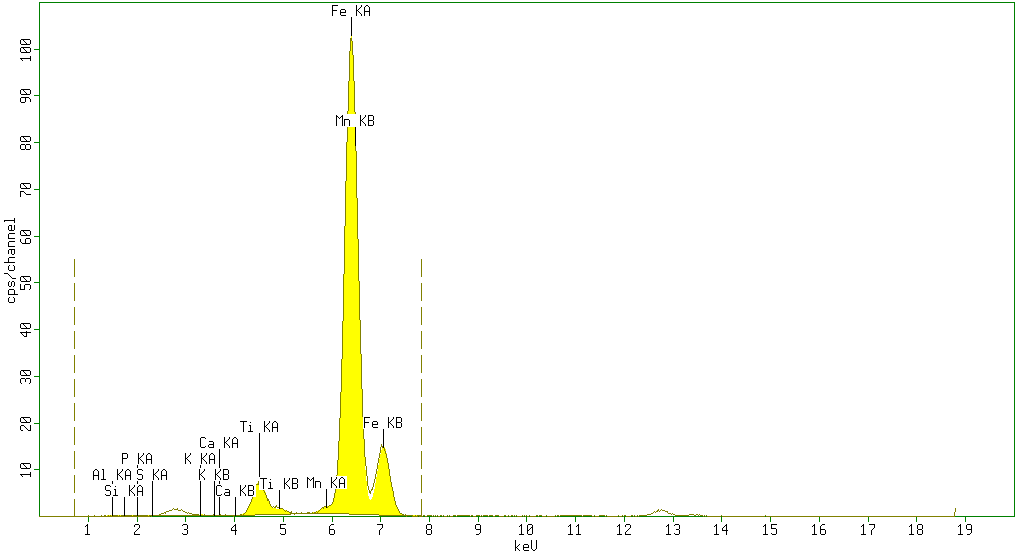 | Figure 5. Sample 5 showed high percentage of Fe2O3 (86%) and minor amounts of TiO2 (5.1%), Al2O3 (5%) andSiO2 (1%) with negligible amounts of P2O5 (0.6%), SO3 (0.6%), K2O (0.2%), CaO (0.07%) V2O5 (0%) Cr2O3 (0%) and Mn (0.82%) as impurities |
According to the results obtained from XRF analysis, it can be pointed out that the Sulphur(S) and Phosphorus(P) contents in iron ores from the Katse deposit are significantly low and the iron content is high (above 80%) and thus are somewhat superior compared to the iron ore from other regions.
3.4. Mineralogical Analysis of Katse Iron Ores
XRD technique was used to show the phases that iron presented and other mineral phases present especially the silicas and provide the quantification of all the phases.The typical results of X-ray diffraction analysis of the different iron ore samples are shown in Figures: 6, 7, 8, 9 and 10 respectively.  | Figure 6. Sample 1 (Physical appearance-Reddish brown in colour and the sample was crushed to powder form. Mineralogical interpretation- Ferric oxide appears to be an in-situ with no adverse weathering /erosional effects Chemical formulae – Fe3O4 > 86 %) |
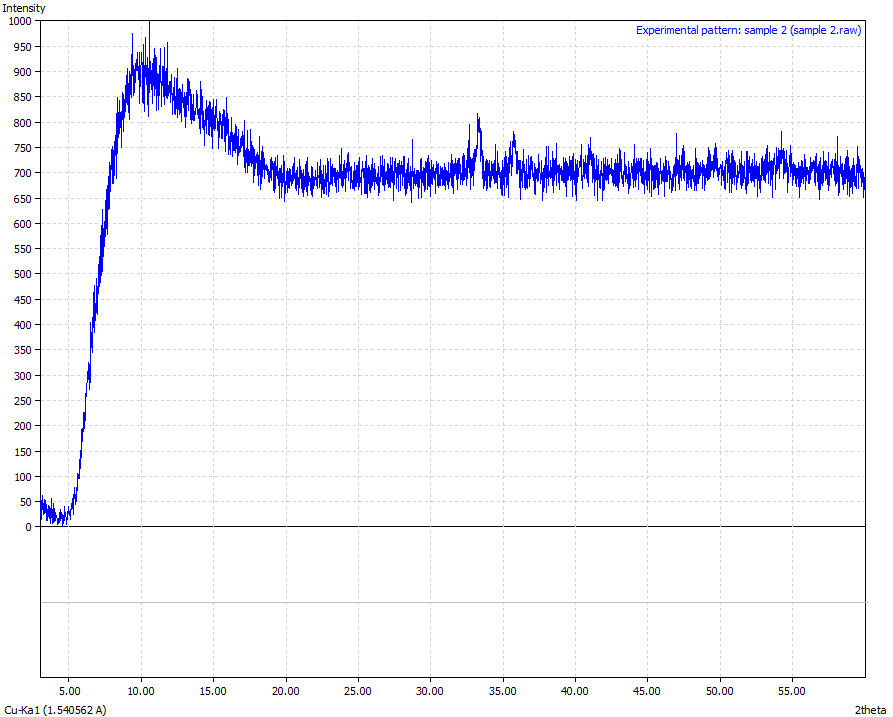 | Figure 7. Sample 2 (Physical appearance-Reddish brown in colour and the sample was crushed to powder form. Mineralogical interpretation-Ferric oxide with high background in the peaks due to loosely bonded iron high amounts of hematite precipitate from weathering Chemical formulae – Fe3O4 + Fe2O3 > 90 %) |
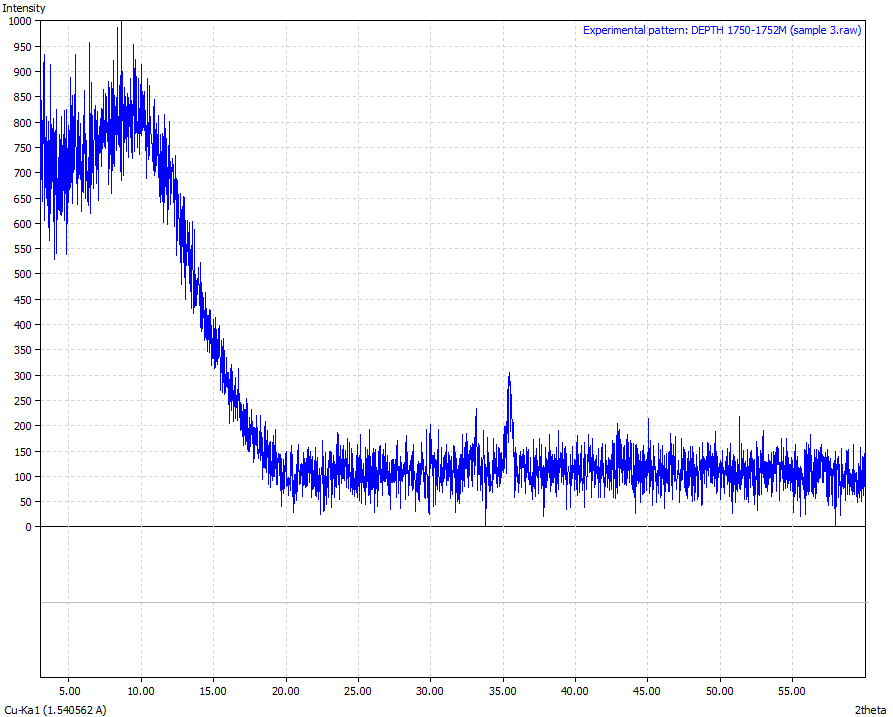 | Figure 8. Sample 3 (Physical appearance-Reddish brown in colour and the sample was crushed to powder form. Mineralogical interpretation -Ferric oxide appears to have silica material embedded Chemical formulae – Fe3O4 > 86 %) |
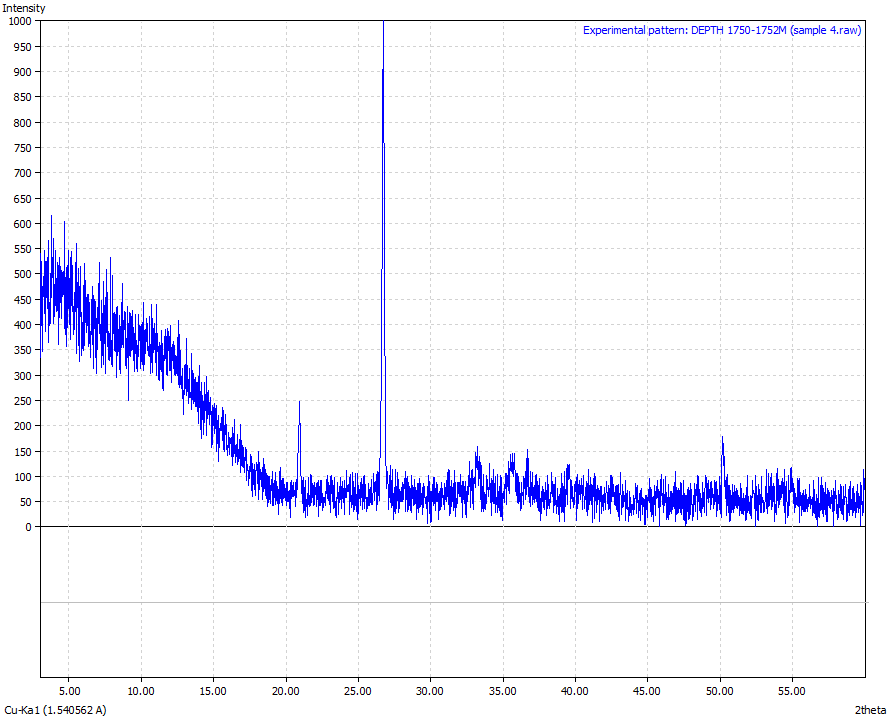 | Figure 9. Sample 4 (Physical appearance-Reddish brown in colour and the sample was crushed to powder form. Mineralogical interpretation-Ferric oxide appears to be an in-situ with adverse weathering /erosional effects Chemical formulae – Fe3O4 > 80 %) |
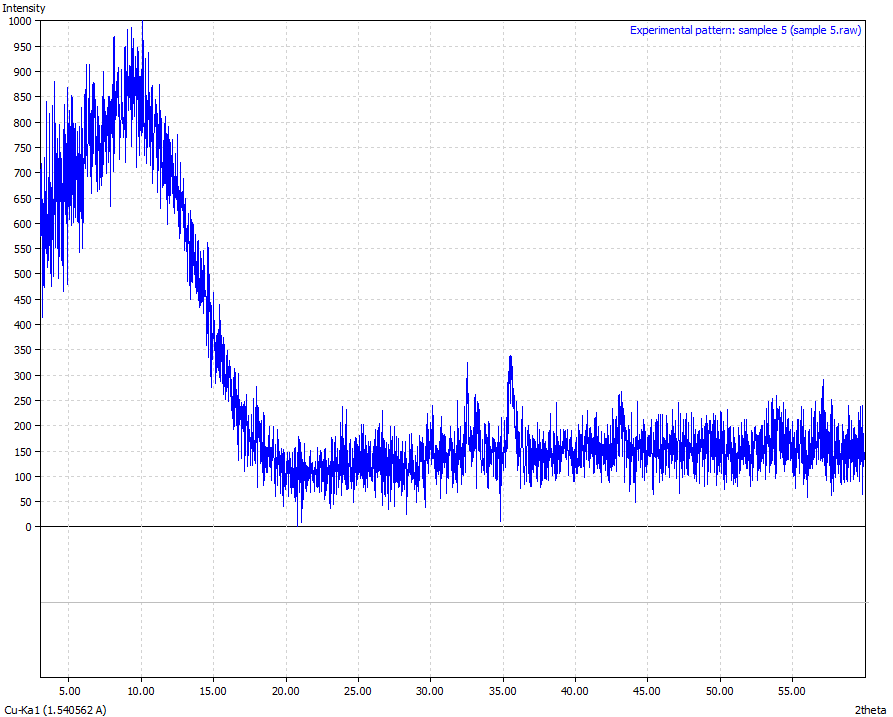 | Figure 10. Sample 5 (Physical appearance-Reddish brown in colour and the sample was crushed to powder form. Mineralogical interpretation-ferric oxide appears to have silica material embedded Chemical formulae – Fe3O4 > 86 %) |
From the results analysis, it is clear that the predominant crystalline element in each of the samples is magnetite (Fe3O4) which showed a very high phase of above 80%.
3.5. Petrographic Microscopy of Katse Iron Ores
The petrographic analysis was applied successfully to study and determine the transparent constituents of various samples from Katse iron ore deposits. Utilization of cross polarized light (XPL) was applied to identify the sample ores. The results of Petrographic microscopy of the seven different iron ore samples are shown in Figures: 11, 12, 13, 14, 15, 16 and 17 respectively. 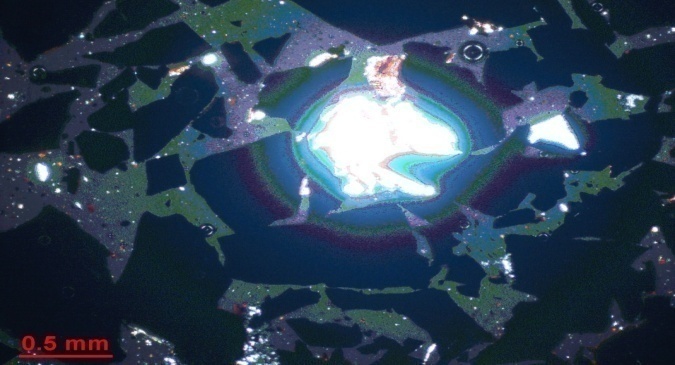 | Figure 11. Thin section of Sample One |
Thin section of Sample one consist of Magnetite, Quartz, Apatite and Hematite. The dark opaque is the Magnetite. The white central color indicates the apatite iron ore and bands of quartz. The brownish dark color indicate martitized magnetite hence Hematite presence.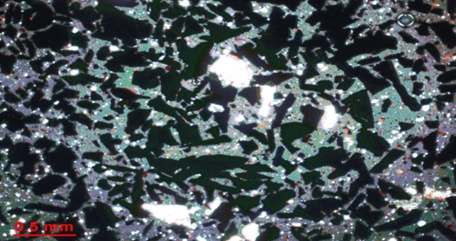 | Figure 12. Thin section of Sample Two |
Thin sections of sample two contains bands dominated by Magnetite (dark chips) followed by Quartz (whitish color). Scattered reddish brown color indicates small amount of Hematite.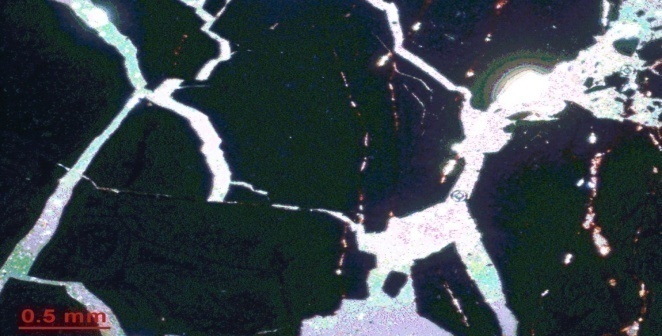 | Figure 13. Thin section of Sample Three |
Thin section of sample three shows a dominant opaque dark grey color which indicates Magnetite and the weathered side shows rust like colors of brown red iron hydroxide (Hematite). The white purple color indicates the Canada balsam chemical on the surface of the glass slide showing the grain boundaries between the magnetite grains.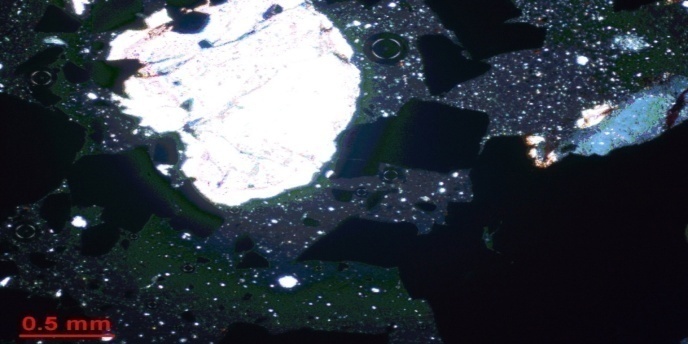 | Figure 14. Thin section of Sample Four |
Thin section of sample four consist of thick and thin grains of whitish color Quarts, dark grey color of Magnetite with small crystals of brownish hematite.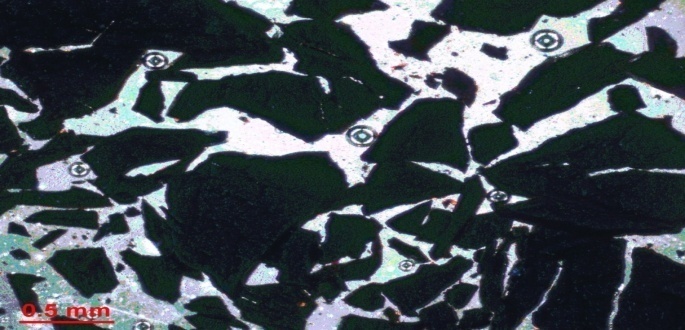 | Figure 15. Thin section of Sample Five |
Thin section of sample five is dominated by the opaque dark grey color of Magnetite with small tints of reddish color seen in the grain boundaries of the magnetite crystals.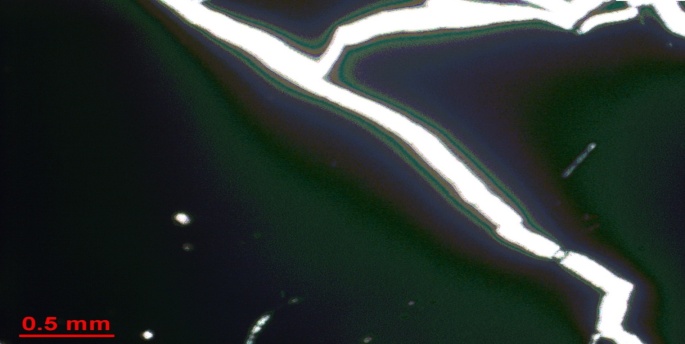 | Figure 16. Thin section of Sample Six |
Thin section of sample six shows large dark grey crystals being dominant and this indicates magnetite. The white color indicates the grain boundary between the crystals of magnetite.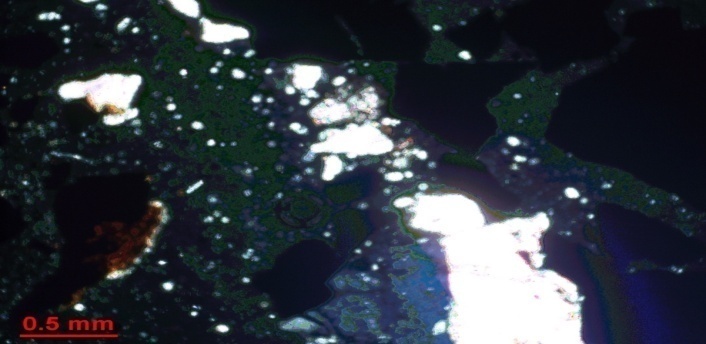 | Figure 17. Thin section of Sample Seven |
Thin section of sample seven consists of Magnetite, hematite and Quartz.From the microscopy images, it is revealed that out of the seven samples analyzed, Magnetite is the major iron ore dominant with minor amounts of hematite and Quartz as the gangue. Magnetite was found in all of the studied thin sections and displayed a large range of grain sizes. Usually magnetite dominates the opaque minerals in the thin sections and a few however showed the thin sections of hematite. The ore is characterized by simple lamellae and specula texture with mutual grain boundaries between individual minerals suggesting the minerals breakage along grain boundaries.
4. Conclusions
Based on the results obtained, it can be concluded that most of Katse iron ores are of a high-grade magnetite and low hematite ore that can be profitably exploited for the production of iron.Iron ore from four locations contains more than 82% Fe. This compares well with other iron ores from the main iron ore producing nations. The silica and alumina contents of these ores are also below 1.2% and 1.0%, respectively, with correspondingly low levels of S (<0.6%) and P (<0.7%). However, the iron ore from location 722 has lower iron content (about 46.2% Fe) and higher gangue content (49.6% SiO2 and 6% Al2O3) at low concentration of the deleterious elements (0% P and 0.5% S) which can be defined as a low-grade.The microscopic studies carried out on the prepared polished blocks and thin sections provided information on the mineralogical composition, grain size, locking type and textural relationship needed by the mineral processing engineer for the beneficiation and processing of the ore.From the results obtained and literature findings, the most appropriate processing technique for this grade of iron ore (magnetite) is the HIsmelt process which is a simple and robust engineering technique with a high level of reliability. However, further work is necessary to establish with certainty the amount of deposits available so as to know for sure how long they can last. This may require the use of advanced Geospatial techniques used for mineral mapping.
ACKNOWLEDGMENTS
This research work was made possible with funding from the National Council for Science and Technology (NCST). Thanks to the Ministry of Mining and Geothermal Development Company (GDC) for their assistance in experimental work. Gratitude to the entire Moi University fraternity.
References
| [1] | A. K. Biswas, Principles of Blast Furnace Iron Making, SBA Publications, Calcutta, India, 2005. |
| [2] | Bett, A.K and Maranga, S.M (2012). Consideration for beneficiation of low Grade Iron Ore for steel Making in Kenya. Proceeding of the mechanical Engineering Conference on sustainable and innovation, 4, pp 263 – 267. |
| [3] | Keru, G.K. (2011). Concentration of Iron in Murram (Laterite) from Ruiru Area, Thika District, Kenya to Asses Economic Viability. Department of Chemistry, Kenyatta University, Nairobi, Msc. Thesis. |
| [4] | Burke, K. Victor, E. and Peane, K (2008). A Practical Guide for Preparation of Specimens for X-ray Fluorescence. Wiley-VCH, New York, pp 78-81. |
| [5] | M. S. Dobbins and G. Burnet, “Production of an iron ore concentrate from the iron-rich fraction of power plant fly ash,” Resources and Conservation, vol. 9, pp. 231–242, 1982. View at Scopus. |
| [6] | J. W. Guider, “Iron ore beneficiation key to modern steelmaking,” Mining Engineering, vol. 33, no. 4, pp. 410–413, 1981. View at Scopus. |
| [7] | R. Semukaaya, Characterisation of Muko Iron Ore Deposits for Iron and Steel Production, Makerere University Library, Kampala, Uganda, 2007. |
| [8] | F. E. Katrak, “Iron and steel, future of,” in Encyclopaedia of Materials: Science and Technology, pp. 4292–4295, 2008. |
| [9] | B. D. Sparks and A. F. Sirianni, “Beneficiation of a phosphoriferous iron ore by agglomeration methods,” International Journal of Mineral Processing, vol. 1, no. 3, pp. 231–241, 1974. View at Scopus. |
| [10] | Svoboda, J. (1987) Magnetic methods for the treatment of minerals Amsterdam, Elsevier. Pp648 - 681. |
| [11] | M. P. Srivastava, S. K. Pan, N. Prasad, and B. K. Mishra, “Characterization and processing of iron ore fines of Kiruburu deposit of India,” International Journal of Mineral Processing, vol. 61, no. 2, pp. 93–107, 2001. View at Publisher · View at Google Scholar · View at Scopus. |
| [12] | Platts, “Methodolgy and Specification Guide: Iron Ore,” The McGraw Hill Companies, 2010, http://www.platts.com/IM.Platts.Content/MethodologyReferences/MethodologySpecs/ironore.pdf. |
| [13] | U. Scwertmann and R. M. Cornell, The Iron Oxides, Structure, Properties, Reactions, Occurrences and Uses, Wiley-VCH, Weinheim, Germany, 2006. |
| [14] | U. Scwertmann and R. M. Cornell, Iron Oxides in the Laboratory, Preparation and Characterisation, Wiley-VCH, Weinheim, Germany, 2000. |
| [15] | Klein and Hurlbut, Manual of Mineralogy, 22nd Edition (1989). |
| [16] | ASTM, C856-95 Standard Recommended Practice for the Petrographic Examination of Hardened Concrete. American Society for Testing & Material, Philadelphia, USA. |
| [17] | Craig, J.R. (1981): Ore microscopy, John Wiley and sons. Pp 139 - 140. |
 Abstract
 Reference
 Full-Text PDF
 Full-text HTML