-
Paper Information
- Previous Paper
- Paper Submission
-
Journal Information
- About This Journal
- Editorial Board
- Current Issue
- Archive
- Author Guidelines
- Contact Us
International Journal of Mining Engineering and Mineral Processing
p-ISSN: 2166-997X e-ISSN: 2166-9988
2014; 3(1): 10-19
doi:10.5923/j.mining.20140301.03
An Investigation of the Present and Future Testing Methods of Rock Abrasion Resistance
 Abstract
 Reference
 Full-Text PDF
 Full-text HTML
Scott D. Ureel, Moe Momayez
Dept. of Mining and Geological Engineering, University of Arizona, Tucson, AZ USA
Correspondence to: Scott D. Ureel, Dept. of Mining and Geological Engineering, University of Arizona, Tucson, AZ USA.
| Email: |  |
Copyright © 2014 Scientific & Academic Publishing. All Rights Reserved.
Rock abrasion plays a significant role in geotechnical design, tunneling operations and the safety of foundations from scour. It is imperative to understand how to test the abrasive properties to help determine the amount of scour at foundation locations in order to prevent structural collapse, wear on drilling tools and help predict unstable rock conditions. Current practice for estimating maximum rock abrasion is based on the Los Angeles abrasion test; however, more research is needed to provide a more accurate and compatible method for all subsurface materials used in mining and civil engineering projects. This study will review past, current and future methods for determining rock abrasion resistance as well as the advantages and disadvantages of various rock abrasion techniques. The paper also introduces recommendations for future rock abrasion techniques and discusses the use of possible rock abrasion correlations for uniaxial compression testing, shear strength and rock quality designation.
Keywords: Rock abrasion, Scour, Erosion, Gouging apparatus, Slurry test, RAT, Review
Cite this paper: Scott D. Ureel, Moe Momayez, An Investigation of the Present and Future Testing Methods of Rock Abrasion Resistance, International Journal of Mining Engineering and Mineral Processing , Vol. 3 No. 1, 2014, pp. 10-19. doi: 10.5923/j.mining.20140301.03.
Article Outline
1. Introduction
- Rock abrasion can be defined as the process of wearing away a surface by friction when particles of sand or small pieces of rock are carried across its surface by a glacier, stream, or the wind. Abrasion characteristics are constantly required to estimate scour potential in bridge foundations (rock and concrete), determine wear of underground construction materials and provide further information regarding material hardness and density.Abrasion is very useful in determining scour of concrete and rock foundations used for bridge stability above rivers and streams. Scour is “the result of the erosive action of flowing water, excavating and carrying away loose material from the bed and banks of streams” [1]. Scour (shown below in figure 1) is a very important part of design foundations (especially in bridges) because of its natural intent to wash river bottom sediments or rock particle from beneath footings which will most likely cause structural failure. From a census provided [4], one thousand bridges have collapsed over the last 30 years in the United States and 60% of those failures are due to scour. This research exhibits the topic of scour has numerous open ended questions to be answered. Currently, the most applicable technique for evaluating the potential for scour in rock is an empirically based method for predicting the limit at which scour will occur developed by Annandale [1]. Besides scour potential, rock abrasion may be used to create correlations to Uniaxial Compression Strength (UCS), Rock Quality Designation (RQD), Shear Strength & Joint Stiffness (very significant rock parameters). If these parameters can be correlated with rock abrasion, more knowledge will be obtained to fully understand hardness, rock quality, strength and wear of equipment. This study will investigate several journal papers and methods used for observing, testing and obtaining rock abrasion characteristics. The paper will also exhibit how future research on rock abrasion could potentially provide improved correlations to other rock properties.
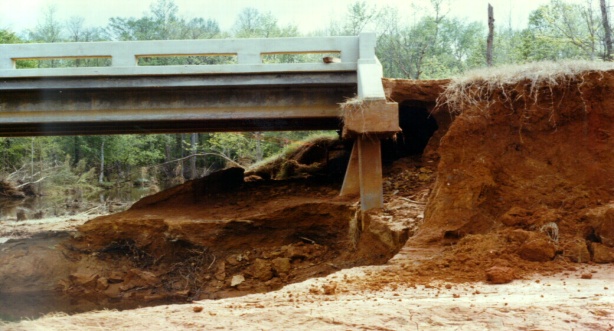 | Figure 1. Observed scour beneath a bridge footing due to flooding conditions |
2. Rock Abrasion Experimental Literature
- Before testing can be performed to determine if a specimen has high or low abrasion resistance, the process of abrasion needs to be fully understood. Abrasion follows a similar process as scour and erosion. The following section evaluates several different academic resources (journal papers, reports, case studies) evaluating the process of rock abrasion through alternative methods used for erosion and scour prediction.
2.1. Annandale Erosion Model
- Determination of rock scour is crucial for bridge foundation design in waterways. Since rock scour depends on rock abrasion resistance, rock abrasive characteristics are required and the process of rock abrasion needs to be fully understood. Annandale [1] develops a rational method for determining erodibility of earth materials ranging from cohesionless granular soil to weak bedrock. The method is based on correlations between the rate of energy dissipated of flow and the soil erodibility using field observations and stream performance. Annandale developed a conceptual model exhibiting the process of scour and how particles become dismembered from the soil profile of the river or stream bed. Figure 2 displays the process of particle disturbance (rock abrasion process) which is broken into three distinct stages: jacking, dislodgement, and displacement.
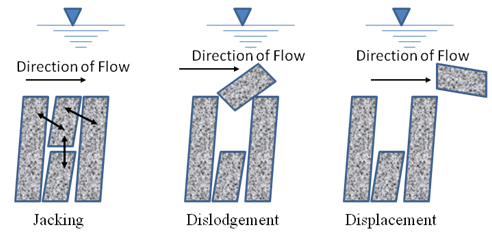 | Figure 2. Conceptual model showing the process of scour [1] |
 If P > f x Kh, the erodibility threshold is exceeded, and the material will most likely erode (scour) and vice versa. From the data collected at the 150 test sites, Annandale produces rate of power (which can be determined from rate of energy dissipation) values for each site with their respective erodibility values obtained from their abrasion numbers, roughness numbers and particle size. The resulting figure is created and produces the threshold point where potential scour will and will not scour; hence, high or low abrasion resistance. This is shown below in figure 3.
 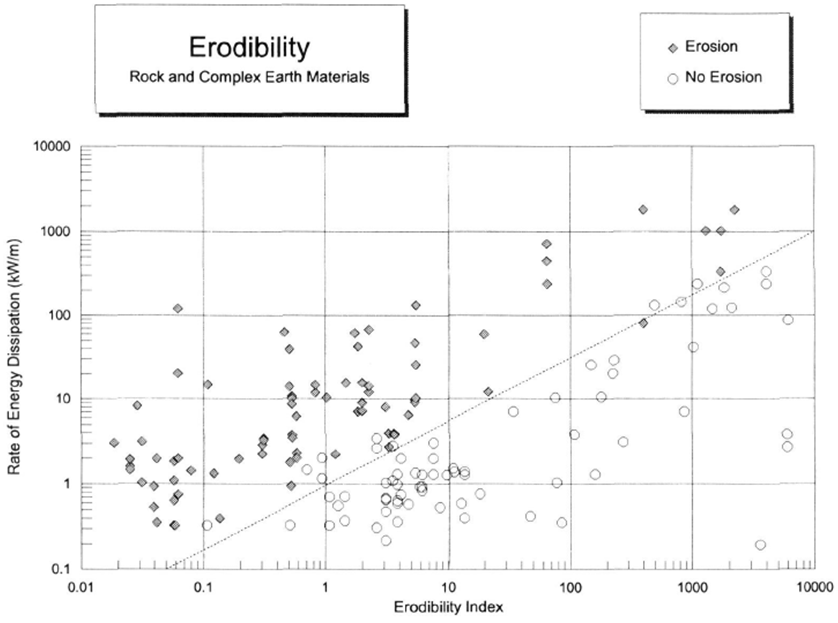 | Figure 3. Erodibility threshold for earth materials [1] |
2.2. Briaud and Associates Erosion Apparatus
- Briaud [3] involved using an erosion function apparatus (EFA) in order to predict scour rates. One should note, the EFA results produce erosion rate vs. shear stress where the shear stress and eroding process assumptions are based on the applied force diagram below (figure 4).
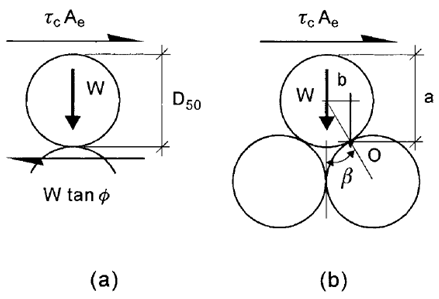 | Figure 4. Forces applied to soil grains during scour [3] |
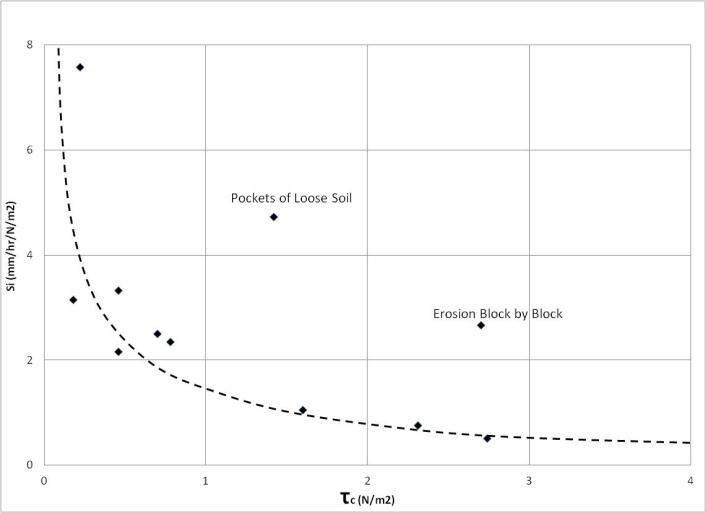 | Figure 5. Correlation between critical shear stress and initial erodibility [3] |
2.3. Scour Model
- The report by Dickenson & Baillie [9] on scour contained vital information and procedures leading to future research in the topic of scour prediction. Building the base of the report from Annandale [1] observations, the report was created to publish a report for the Oregon Department of Transportation in regards to an issue concerning predicting scour on weak bedrock in the Oregon Coast Range for eleven different sites containing outcrops of weak bedrock (many the Tyee formation) throughout the Willamette Valley. The research team gathered geotechnical site characterization parameters by standard geotechnical testing (core drilling, SPT, Shelby tubes) and laboratory testing which includes slake durability, density, unconfined compression test and abrasion tests. Next, hydraulical parameters were determined for each site of interest using USGS stream gages and performing stream data analyses using the HEC-RAS water surface profile program (presently used by ODOT for scour predictions). Once the hydraulic parameters are obtained, the integrated stream power can be calculated. Finally, surveys of stream beds were compared with data gathered in the 1980s with the data collected in 1998 to estimate erosion. With the computed data and resulting geotechnical parameters (abrasion number), a figure was created for the estimation of average erosion. This figure could be used according to rock abrasion by using velocity and mass of the abrading object rather than the power of the stream. This is shown below in figure 6.
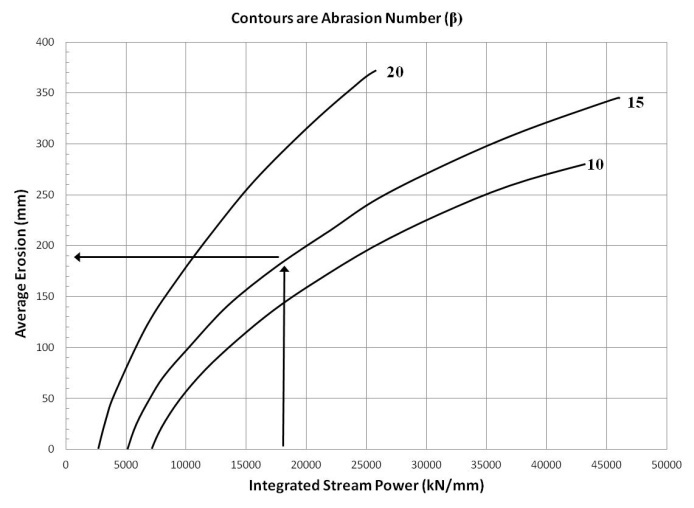 | Figure 6. Design example for estimating average erosion [9] |
3. Rock Abrasion Testing
- Numerous methods for rock abrasion testing have been introduced and utilized to obtain abrasive properties although some are more practical and acceptable. Journal papers, articles and laboratory reports were examined to ensure which method provides the most accurate measurements. The following section will highlight indirect rock contact methods, direct contact methods and a concrete abrasion testing method that could be used on rock.
3.1. Slake Durability and LA Abrasion Test
- Abrasion resistance can be estimated using two of the most common methods: the slake durability and LA abrasion testing methods. The slake durability testing method is a test for evaluating the wetting and drying effects on the slaking effects of clay bearing rock and siltstones and standardized by the ASTM D4644. The rock is placed in a cage that rotates at 20 rpm for 10 minutes. A weight loss vs. time plot can be constructed to display the amount of rock material lost due to the rock material being “broken apart” by the rotating cage. The weight loss determined from this method is primarily due to abrasion resistance of material and not its slaking characteristics [9]. Also, an abrasion resistance number can be determined using the equation:
 where B is the y intercept on the plot, T is the time elapsed and beta is the abrasion number. On the other hand, the LA abrasion test (ASTM C131) was developed to determine the durability of gravel or crushed rock for use in concrete and asphalt pavements.These methods do provide an estimation of rock loss and durability; however, they do not have “direct contact” with the rock specimen of interest which can lead to uncertainty. Figure 7 above exhibits the conceptual set up for the slake durability test and data obtained by the slake durability and LA abrasion test. Kahraman and Fener [12] performed numerous LA abrasion and Uniaxial compression tests to understand correlations between the two parameters. Similar testing was performed by Kahraman and Gunaydin [13]; however, point load testing and the Schmidt hammer were utilized instead of uniaxial compression testing. Figure 8 below displays the results for LA Abrasion loss vs. Uniaxial Compression testing and the set up for the LA Abrasion test.
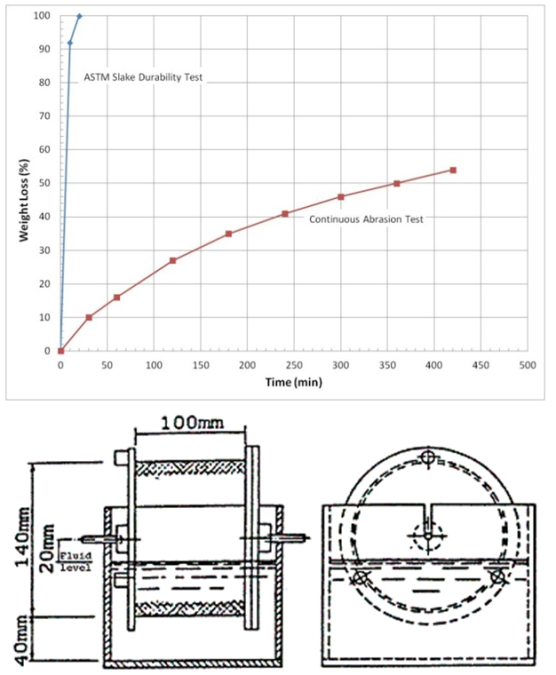 | Figure 7. Slake and abrasion test data and conceptual drawing of the experiment set up |
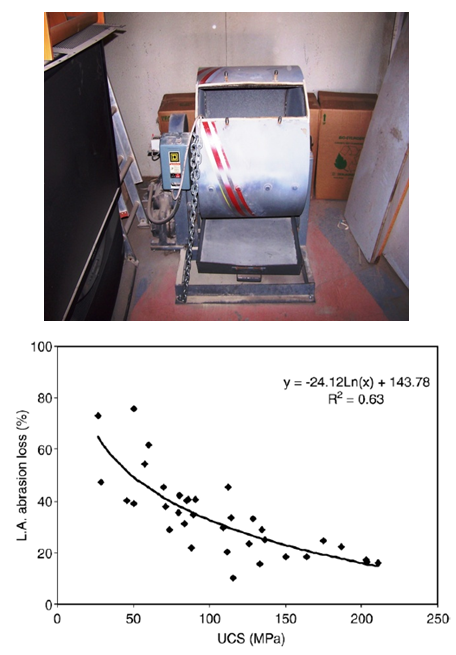 | Figure 8. Basic LA Abrasion test and data [12] |
3.2. Nordic Ball Mill Test and Micro-Deval Test
- These two tests are mostly used to determine the abrasion resistance from the wear caused by studded tires; however, the tests are being used more in the tunneling industry to understand the wear of boring cutters. The Nordic ball mill test and the Micro-Deval test have many similarities to the LA abrasion test because the tests are performed on crush aggregates rotating in a drum with steel balls and water. The difference between the LA abrasion and the Nordic ball mill and Micro-Deval tests is the latter tests have more revolutions, smaller ball bearings and faster rotation speeds. The Nordic ball mill test also contains steel ribs inside the machine used to lift and then drop the ball bearings and rock samples which separates it from both the LA Abrasion and Micro-Deval test. Table 1 below shows the differences and similarities between the Nordic ball mill test, the LA Abrasion test and the Micro-Deval test. Further research and comparisons of these tests can be found in [6], [7], [11], [15]
3.3. Gouging Abrasion Test
- The Gouging Abrasion test [10] simulates very high stress abrasion under high-energy impact conditions. During this test, a rectangular rock sample is placed into the rock container below a steel wear tool with a sharp point. The rock container can be adjusted horizontally and vertically in order for the steel wear tool to make contact with the surface of the rock specimen. The pendulum then swings across the rock surface to abrade the rock specimen. This procedure has direct contact with the rock sample; however, the test only covers a small surface area on the rock surface and is an expensive testing apparatus. The design of the test apparatus for Gouging Abrasion testing is shown schematically in Figure 9 below.
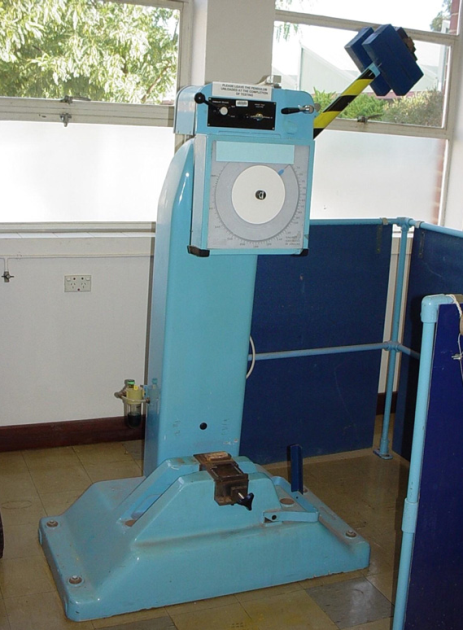 | Figure 9. Gouging Abrasion Test [10] |
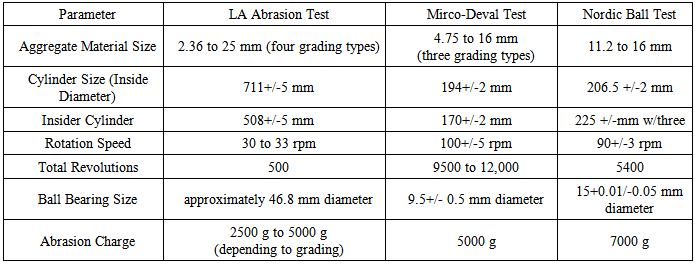 | Table 1. Comparison between LA Abrasion and Nordic Ball Test [11] |
3.4. Abrasion Resistance Hardness Tester (ARHT)
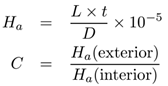
- A method of measuring the hardness of materials as manifested by the abrasion resistance was developed in order to compare the hardness of different materials as they evolve under changing conditions. A portable field instrument was designed and built to measure changes in the abrasion resistance hardness of geologic materials, especially those changes resulting from weathering. During the operation of ARHT, the operator has control of the load, L, and the depth of penetration, D. Convenient units obtained from the instrument, that discriminate hardness among different materials, are the abrasion resistance hardness value and the coefficient of relative hardening for an exterior surface. The surface hardness can be determined using the following equation:
 H, the abrasion resistance hardness value is in the range of 0 to 100. This is the same range and values for RQD. Hopefully with more research this relationship of RQD to H can be determined to be accurate. Figure 10 below displays the ARHT equipment.
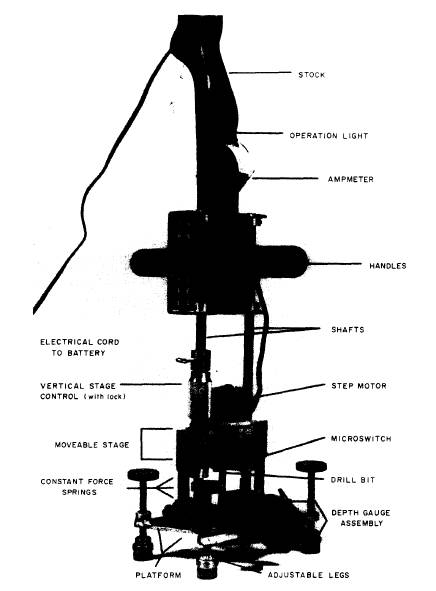 | Figure 10. ARHT apparatus [5] |
3.5. Concrete Abrasion Testing Apparatus
- Concrete abrasion has been studied in order to determine the concrete’s resistance to degradation scenarios such as road wear, concrete resistance using different types of rock (aggregate) and chemical surface protection. The concrete abrasion apparatus is a custom made machine [20] where square foot by 4 in thick concrete specimens can be abraded by having direct contact with the specimen of large surface area. The machine can be operated at different time intervals and the type of abrading material can be changed to replicate field conditions where abrasion is prevalent. The information obtained from the machine data can be used to determine a correlation between strength and amount of displacement caused by abrading the concrete. This method could potentially be very beneficial if used on rock specimens and not used solely on concrete. The machine also is in accordance with ASTM-C779: Standard Test Method for Abrasion Resistance of Horizontal Concrete Surfaces. Figure 11 displays the concrete abrasion testing apparatus and figure 12 exhibits data collected from the testing machine.
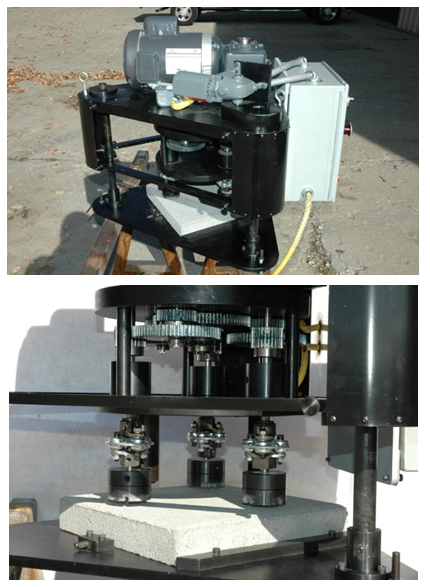 | Figure 11. Concrete abrasion testing apparatus [20] |
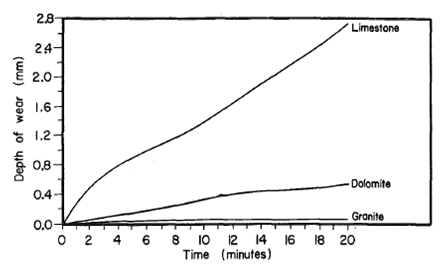 | Figure 12. Example of results produced by concrete abrasion apparatus [14] |
3.6. Miller Slurry Test
- The Miller slurry abrasion test is used to determine the abrasivities of constructed slurries. From this abrasion test, the Miller number and the slurry abrasion response number (SAR) can be determined. The Miller number is an index to measure the relative abrasivity of slurries. As the Miller number increases the wear of the specimen increases. The SAR number is ranks the relative abrasive response of the slurry. Common water slurries used in the miller slurry abrasion test is aluminum oxide particles. During the Miller slurry test, motor operated rods oscillate along four test samples that are locked in the water slurry filled holder. Though slurry tests use mostly low-stress abrasion conditions, high stress abrasive scenarios can be simulated. High stress testing will be appropriate to use if stresses are need to fracture the rock being tested. A rubber wheel produces low-stress abrasion while a steel wheel produces high-stress abrasion. This would be advantageous option to determine abrasion resistance for slurry pumps, tunnel boring machines, and drilling operations. Recently, Petrica and associates [17] used a similar technique as the Miller slurry abrasion test called the slurry steel wheel abrasion test (SSWAT). Figure 13 below exhibits a typical Miller slurry abrasion apparatus.
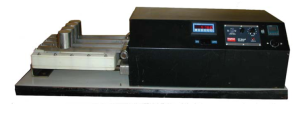 | Figure 13. Typical Miller slurry abrasion testing apparatus [19] |
3.7. Rock Abrasion Tool (RAT)
- The Rock Abrasion Tool (RAT) was developed by Honeybee Robotics, numerous scientists and engineers for Mars exploration and to expose the interior of rock samples to analyze and identify. It was designed to mimic the effect of a geologists hammer [16]. RAT grinds up to 5 mm deep hole with a diameter of 45 mm. The RAT is deployed on an instrument arm and loaded to 10 to 100 N. The grinding wheel rotates up to 3000 rpm on the rock sample surface while revolving around the center axis of the RAT until the desired abrasion depth is reached. This abrasion method directly abrades the rock and its primary actuator can calculate specific grind energy in term of Joules per cubic millimeters which is also considered an index of grindability [2]. Shear strength and hardness may possibly correlate well with specific energy (erodibility) due to the fact that the shear strength is based on how cohesive (interlocking grain strength) the material is and the amount friction (phi) between the rock grains. Though the RAT has many advantages, it is not readily available on the consumer, requires a flat rock surface to perform the test and expensive. A typical schematic of the RAT is shown in Figure 14.
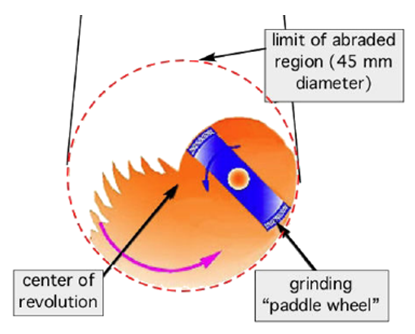 | Figure 14. The RAT schematic diagram [18] |
4. Discussion
- After investigating the available abrasion testing methods for rock, a summary table can be created to compare the advantages, limitations and parameters that can be correlated to the data obtained by each test. Table 2 below gives a summary of four test methods investigated.The table provides information indicating which testing methods would be most suitable for testing the abrasion resistance of rock and the rock properties that may be correlated. The LA abrasion and Nordic ball test have been used for numerous years and do provide the weight loss of rock by a rotating cage; however, the tests do have direct contact with the rock samples. An RQD value may possibly be obtained from these tests. The gouging and ARHT tests do provide direct abrading contact with the rock samples but the limitations outweigh the advantages when correlating correlations; however, direct wear can be measured. The more appropriate choice for performing abrasion tests would be the concrete abrasion machine. With this machine, the operator is able to provide a direct abrading contact with the rock sample of interest. The machine also covers or abrades a large surface area compared to other abrasion tests. The Miller slurry test could be used to determine shear strength and joint stiffness of rock; however, this test will not be suitable for direct abrasion testing. Lastly, the RAT should be used for general, direct rock abrasion in order to understand if certain abrasive correlations to rock properties (shear strength, RQD, UCS) do exist for different rock types. All abrasion testing and methods serve its own purpose; however those purposes need to be explored further with rock core specimens encountered in geotechnical engineering projects. By knowing the strength of the rock, the UCS and other easily obtained parameters, a correlation may be possible to RQD and joint stiffness. An example plot that can be created is shown in figure 15 below. The two parameters predicting the RQD can be substituted with other relevant rock parameters.
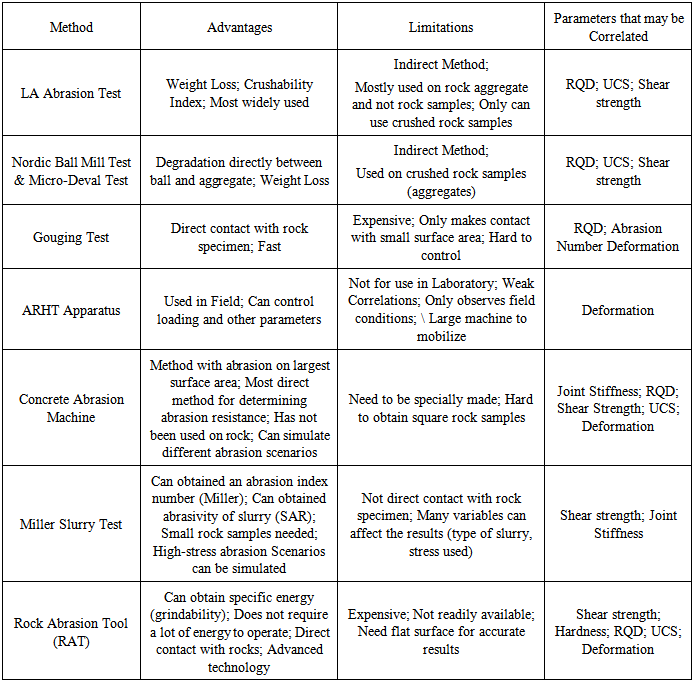 | Table 2. Summary of Abrasion testing methods |
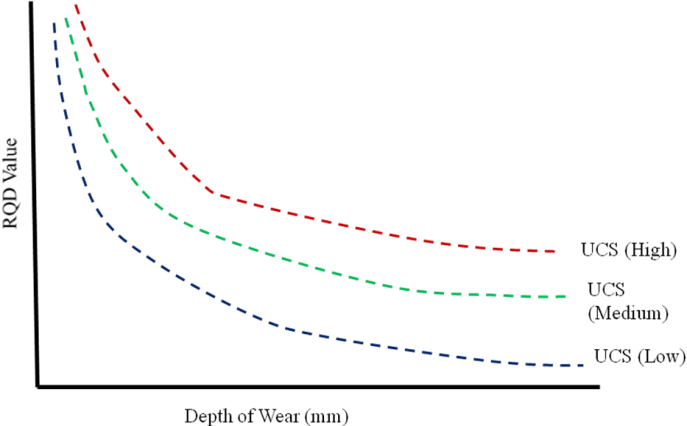 | Figure 15. Example for possible correlation of RQD to Depth of wear and UCS |
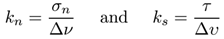 where kn is the joint normal stiffness, ks is the joint shear stiffness, v is the normal displacement, u is the shear displacement, τ is the shear strength and σn is the normal stress. Figure 16 shows a relationship between horizontal displacement and shear force.
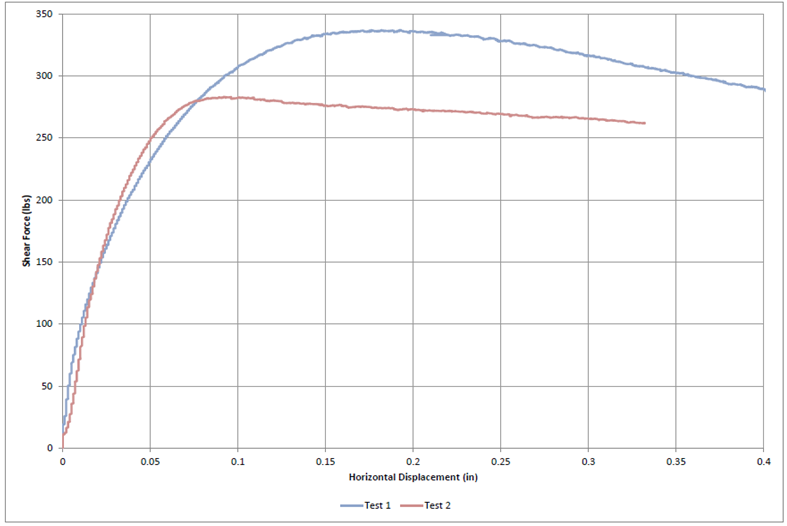 | Figure 16. Shear force vs. horizontal displacement |
5. Conclusions
- In conclusion, predicting abrasion resistance and correlating it to other rock parameters such as RQD or joint stiffness can be an intensively time consuming task. The purpose of this paper was to inform the engineering community of potential future research for rock abrasion and suggest possible methods to obtain reliable data. The following conclusions can made from the research and literature review performed in this paper: • New methods for rock properties (RQD, shear strength) and Abrasion estimates need to be investigated and established to ensure the most accurate values• Rock abrasion can be studied using apparatuses constructed for different materials than rock or uncommon methods• Ideas are out there to potentially cause more accurate values• Correlations are available; however, many provide inconsistencies or based on a small database• Previous scour and erosion investigations and techniques can be applied to rock abrasion• Apply testing from different fields to measure rock abrasion• Data from more rock types should be collected• Results should be determined from direct abrasion data with methods such as RAT or the concrete abrasion machine• Perform abrasion resistance testing to many more specimens rather than only rock aggregates• Need a method that causes little disturbance to estimate RQD• Perform periodic surveys and archive data in a easily retrievable manner• The abrasion process can strictly governed by jacking and dislodgement, dislodgement and abrasion or abrasion only• Should Investigate all variables effecting abrasion resistance As technology advances and new ideas are introduced to the engineering community, rock abrasion resistance will become easier and more accurately measured for rock properties. The abrasive properties of rock will hopefully provide valuable information that can be used with future correlations and previous erodibility and rock scour studies.