Mehdi Hosseini1, Mehdi Seifi Baghikhani2
1Assistant Professor, Imam Khomeini international University
2M.SC Student, Imam Khomeini international University
Correspondence to: Mehdi Hosseini, Assistant Professor, Imam Khomeini international University.
| Email: |  |
Copyright © 2012 Scientific & Academic Publishing. All Rights Reserved.
Abstract
One of the most fundamental stages in open pit mining is drilling and blasting. A good fragmentation and a minimum ground vibration are characteristics of a successful drilling and blasting operation. In this study, 78 blasting events of AlvandQoly limestone mine located in Kurdestan cement company in west of Iran were investigated. The vibrations induced blasting was recorded by seismograph and analyzed. Based on this analysis, peak particle velocity equation for mine was derived. Results show that according to the vibrations induced blasting, blast holes does not induce any risk for buildings of kurdestan Cement Company.
Keywords:
Blasting, Vibration, AlvandQoly, Limestone Mine, Analysing
Cite this paper: Mehdi Hosseini, Mehdi Seifi Baghikhani, Analysing the Ground Vibration Due to Blasting at AlvandQoly Limestone Mine, International Journal of Mining Engineering and Mineral Processing , Vol. 2 No. 2, 2013, pp. 17-23. doi: 10.5923/j.mining.20130202.01.
1. Introduction
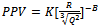
In most of surface mines, blasting operation is the first element of the ore extraction process. The primary purpose of blasting is rock fragmentation and displacement of the broken rock. Thus, blasting operation requires a large amount of explosives. In 2005, Singh and Singh indicated that fragmentation and displacement of broken rocks accounts for only 20–30% of the total amount of explosive energy used. Utilizing large amounts of explosives during charging can result in unwanted scenarios. Blasting operations may impose excessive noise and vibration on communities. Excessive levels of structural vibration caused by ground vibration from blasting can result in damage to, or failure of, structures. The intensity of ground vibration depends on various parameters which can be categorized into two classes: controllable and uncontrollable parameters. Controllable parameters are mainly related to explosive characteristics and blast hole design parameters, which can be changed by mine administrations. The other parameters, which is natural and uncontrollable, is related to geological conditions, rock characteristic and the structural setup of the ground[1]. Historically, the measurement of blast vibrations may be dated back to the early 19th century, with the practice continually expanding in subsequent years. Now, the recording of vibrations is a common procedure for many blasting operations. Ground vibrations are generally quantified by means of particle velocities at particular ground locations. Currently, the most widely accepted single measurement of ground vibration considered potentially damaging is Peak Particle Velocity (PPV)[1]. PPV is defined as the speed by which earth particles move or pass a particular site. Through measuring vibrations of earthquakes using seismograph, it has been found that this PPV can be related to the weight of the explosive charge and its distance to the recording site through the application of a simple power law formula (equation 1): | (1) |
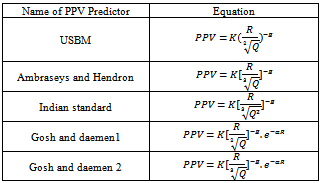
Where V is the PPV in mm/s, W the charge weight per delay in kg and R the radial distance from the point of detonation in m. The constant K,  used in this equation depended upon the type of blast and condition of rock mass[2]. Many scientists and engineers have investigated on PPV prediction so far and reported their findings. The first significant PPV predictor equation was proposed by the United States Bureau of Mines (USBM)[3]. There are also modified predictors from other researchers or institutions such as Ambraseys and Hendrn[4], Langefors and Kihlstrom[5], Gosh and Daemen[6], Roy[7], Sigh et al.[8] which are shown in Table 1. However, the PPV predictor established by USBM is still the most widely applicable equation in the literature. Therefore, In the present research, USBM equation has been utilized.This study aims to assess the level of noise generation and ground vibration induced during blasting operations in an open pit mine.
2. Site Description
An extensive study was carried out at a quarry named Alvand Qoly (Figure 1) which belongs to Kurdestan Cement Company. The site is located near Bijar city in western Iran. The limestone deposit is of pliocene age. The bedding planes are horizontal. Limestone rock is medium-hard and has compressive strength of 80 MPa and density is 2.45 tons/m3.As it can be seen in Figure 2, blast holes were vertical and 76 mm in diameter for all benches. The holes lengths were 13.5 m with 1 m of sub-drilling and 3.5 m of stemming. In blasting operations, ANFO (ANFO is an explosive mixture that is used in coal mining, quarrying, metal mining, and civil construction. It consists of 94% ammonium nitrate and 6% fuel.) and emulsion explosive (Commercialized by ParChine Co. under name of Emulite, Emulite was used in priming of ANFO for initiation of explosion) were used as explosive for all blasts. Non-electric system (detonating cord) was used to initiate the blasts.Table 1. List of some of PPV predictor equations
 |
| |
|
In Table 1,  are site constant to be determined by regression analysis, R is distance from blasting face to point of vibration monitoring (m) and Q is charge weight per delay (kg).
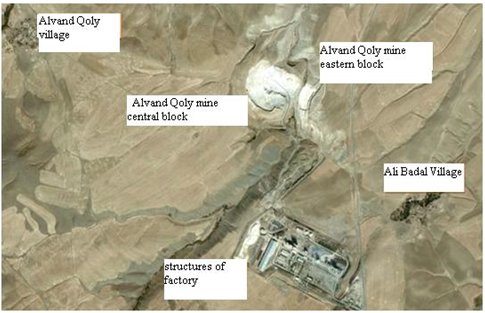 | Figure 1. The position of Alvand Qoly mine |
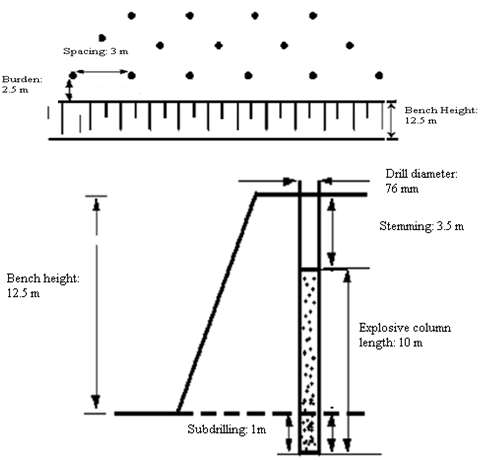 | Figure 2. General blasting pattern for Alvand Qoly limestone mine |
3. Determination of Site Constants
The ground vibration components were measured for 78 blast events in order to predict PPV for the site over a period of 12 months (Appendix ). A seismograph and analysis software (Siesmowin software) are used in this study. seismograph can analyse blast vibration with an integrated tri-axial geophone. Each transducer measured velocities on three mutually perpendicular axes (Vx,Vy, Vz). PPV is the resultant of Vx,Vy, Vz. USBM equation, Ambraseys and Hendron equation and indian standard have been used in this research (Equations 2, 3 and 4):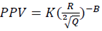 | (2) |
 | (3) |
 | (4) |
Where K and B are site constant to be determined by regression analysis, R is distance from blasting face to point of vibration monitoring (m), Q is charge weight per delay (kg) and R/Q1/2 is defined as a scale distance. In order to establish a useful relationship between PPV and scaled distance for the site, regression analysis is carried out by using Table curve2D software. All data pairs are utilized to conduct the study. The relations between the PPV and the scaled distances are presented in Figures 3, 4 and 5. The resulted equations for the under investigated site are (equations 5, 6 and 7): | (5) |
 | (6) |
 | (7) |
The R- square quantity shows the quality of the fit. Figures 3, 4, and 5 show R-suare quantity (r^2) is highest in USBM equation therfore this equation is selected for PPV prediction in this site. The empirical factors K and B USBM equation are determined as 129.6 and -1.7792, respectively. The R- square quantity shows the quality of the fit. In this case, the value of 0.7847 indicates that 78.47% of measured PPV can be predicted by equation 3. On the other hand, the obtained correlation coefficient (r) between the PPV and the scaled distance is 0.8858. The 95% prediction level in Figure 3 indicates the area within which 95% of maximum particle velocity data resulted from other blasts lies. The upper 95% prediction limit curve is generated from standard error and data distribution curve by using Table curve2d software (Figure 3).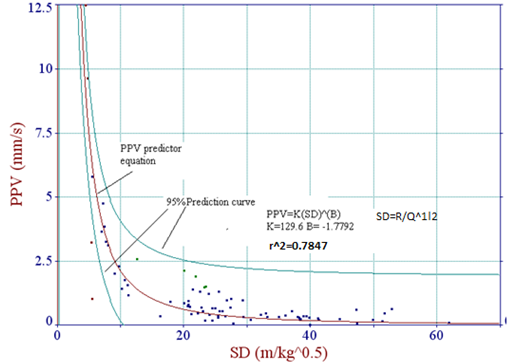 | Figure 3. PPV Prediction based on USBM equation |
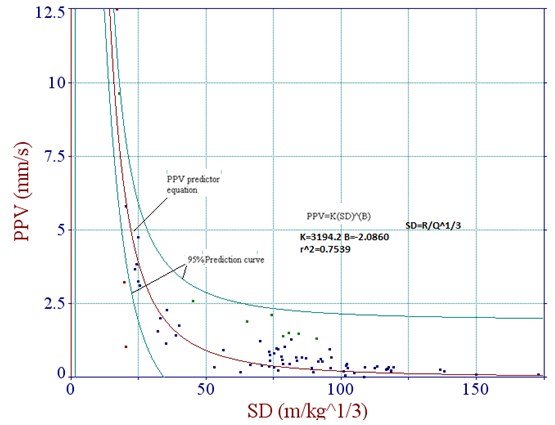 | Figure 4. PPV Prediction based on Ambraseys and Hendron equation |
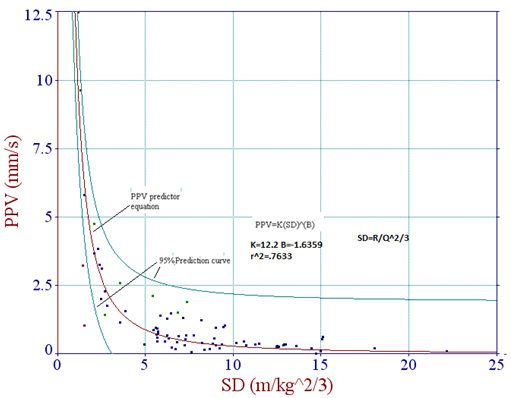 | Figure 5. PPV Prediction based on Indian standard equation |
4. Frequency Analysis and the Evaluation of Damage Risk in Blasting Operation
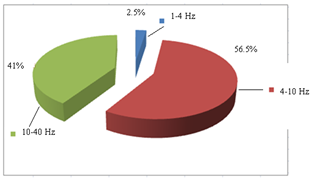 | Figure 6. Frequency distribution of blast-induced vibration |
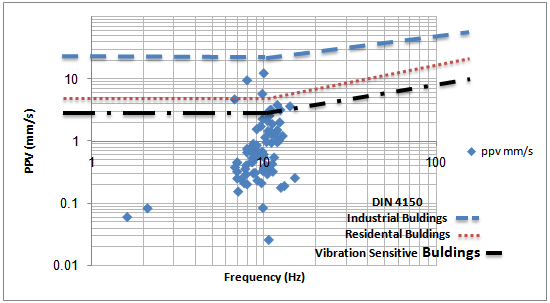
The distribution of recorded frequency values is shown in Figure 6. It can be seen that 56.5% of the frequency values are between 4 and 10 Hz, 41% of the frequency are between 10 and 40 Hz. Moreover, 97.5% of the frequency values are lower than 40 HzAs a result, the frequency interval of 1-4, which has a higher damage risk, constitutes only 2.5% of all shots. Therefore, the allowed PPV limit at frequencies higher than 4 Hz for different structures stated in accepted international standards, USBM and DIN 4150,should be obeyed at the future blasting operations at this site. The measured magnitudes of PPV and the frequency of shots were evaluated by taking into consideration several established damage criteria (USBM and DIN 4150) used in mining (Figures 7 and 8). When these structure types were considered, it was observed that the PPV values versus frequency for all shots were below permissible limits described in both of damage criteria.
5. Conclusions
Environmental constraints will be more and more restrictive on mining activities. So, measuring the ground vibration induced by blasting is a significant step in order to control environmental problems. Since PPV is still one of the most important ground vibration predictors for regulating the blast design, an empirical relationship based on USBM Equation with good correlation (R-square correlation coefficients for equations 5, 6 and 7 are 0.7847, 0.7539 and 0.7633 respectively) has been established between PPV and scaled distance for this site where host rock is limestone. This empirical equation obtained from 78 data pairs can be used to estimate PPV only in this mine. The United States Bureau mines (USBM) and German vibration standards (DIN 4150) are considered in this study. Based on these established damage criteria, the ground vibration measurements and frequency data pairs recorded at the buildings were below the threshold values for a safe condition.In the present study, the frequency values of ground vibrations were below 40 Hz, which according to the international standards are acceptable.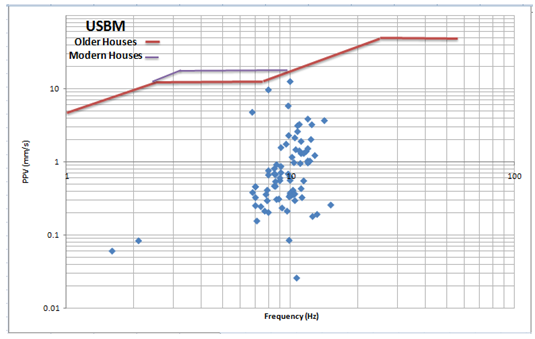 | Figure 7. Evaluation of damage risk of shots according to USBM standard |
 | Figure 8. Evaluation of damage risk of shots according to DIN 4150 standard |
Appendix
Measured PPV and frequencies by seismograph for 78 blast events 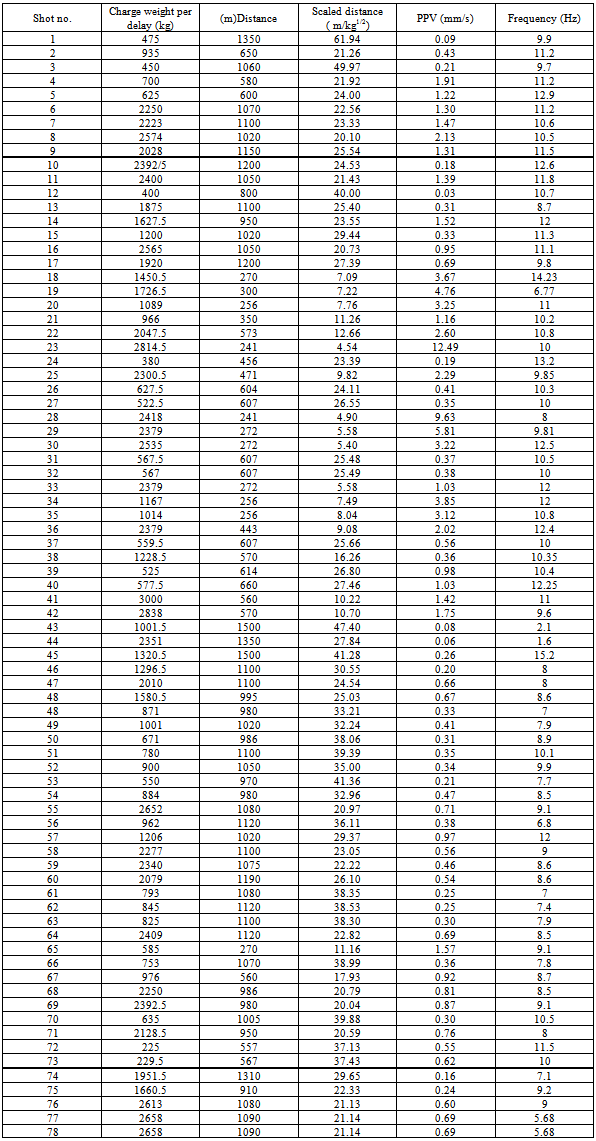
References
| [1] | Singh, T.N. and Singh, V. (2005). An intelligent approach to prediction and control ground vibration in mines. Geotech. And Geolog. Eng., 23: 249–62. |
| [2] | Roach, P.K., Verster, W.F. (2006). Discussing the detonation effects of large charges.SABO conference. |
| [3] | Duvall, W.I. ,Fogelson, D.E. (1962). Review of Criteria for Estimating Damage to Residences from Blasting Vibrations.USBM R.I.5968. |
| [4] | Ambraseys, N.R. and Hendron, A.J. (1968). Dynamic Behaviour of Rock Mass. In proceedings of Rock Mechanics In Engineering Practices, John Wiley And Sons, London, 203-207. |
| [5] | Langefors, U. and Kihlstrom, B. (1978). The Modern Techniques of Rock Blasting. John Wiley And Sons, Inc., New York. |
| [6] | Ghosh, A. and DaemenJaak, J.K. (1983). A Simple New Blast Vibration Predictor based on wave propagation laws. In proceedings of the 24thU.S.Symp. On Rock Mechanics, Texas, USA. |
| [7] | Roy, PP. (1991). Vibration control in an opencast mine based on improved blast vibration predictors. Min Sci. Tecnol., 12: 157-65. |
| [8] | Singh, T.N., Amit, P., Pandey, A., Saurabh, P., Puri, S., Singh, P.K. (2002). Prediction of explosive charge for efficient mining operation. In proceedings of rock eng. –problems and approaches in underground construction, Seoul. |
 Abstract
 Reference
 Full-Text PDF
 Full-text HTML