International Journal of Mining Engineering and Mineral Processing

2012;  1(2): 73-83

doi: 10.5923/j.mining.20120102.09

Some Surface Characteristics of Six Hematite Ores from the Middleback Range Area, South Australia

Keith Quast

Ian Wark Research Institute, University of South Australia, Mawson Lakes, 5095 South Australia

Correspondence to: Keith Quast , Ian Wark Research Institute, University of South Australia, Mawson Lakes, 5095 South Australia.

Email:

Copyright © 2012 Scientific & Academic Publishing. All Rights Reserved.

Abstract

Surface chemical techniques were used in an attempt to characterise eight samples of hematite. The hematites studied were six samples from the Middleback Ranges (Iron Knob (2 samples), Iron Monarch, Iron Prince, Iron Princess and Iron Baron) and two high purity, synthetic sa mples. The isoelectric points of the hematite samples showed a wide variation in value (from <2 to 8) whereas the zero points of charge were in the range 5.5 to 7.5. Using a simple mathematical calculation it was possible to estimate the surface charge characteristics of these hematite samples which gave a much better picture of the true surface properties of these samples in an aqueous environment. It was hoped that this study would contribute to a better understanding of the interaction between different hematite samples and water, a mechanism that is important in many industrial applications e.g. slurry pumping, agglomeration and granulation.

Keywords: Zeta Potential, Hematites, Isoelectric Points, Zero Points of Charge

1. Introduction

The aim of this report is to investigate several aspects of the surface chemistry of samples from five high-grade hematite deposits in the Middleback Range area of South Australia. It was hoped that these surface properties could be used to characterise ores from the different deposits and provide additional techniques to identify or “fingerprint” these materials. These deposits are all located in the northern area of the Middleback Ranges (see Figure 1). The surface characteristics of these hematite samples were investigated using conventional microelectrophoresis techniques as well as a modified form of potentiometric titration that allowed the estimation of surface charges using an innovative mathematical calculation.

2. Literature Survey

2.1. Middleback Range Hematite Ores

According to the Resources and Energy Group of the Department for Manufacturing, Innovation, Trade, Resources and Energy of the Government of South Australia, the mines currently operating in the Middleback Ranges of South Australia are (from North to South) Iron Knob, Iron Baron, Iron Queen, Iron Cavalier, Iron Chieftain, Iron Knight, Iron Duchess and Iron Duke (DMITRE,[1]). Iron Monarch, Iron Baron and Iron Duke have collectively yielded more than 200 million tones of iron ore in almost100 years of mining. High grade ore has been mined from three areas: Northern Iron Knob area that includes Iron Knob, Iron Monarch and Iron Princess deposits, Central Iron Baron area comprising the Iron Baron, Iron Prince, Iron Queen and Iron Cavalier deposits and the South Middleback Ranges which includes the Iron Duke, Iron Duchess, Iron Knight and Iron Chieftain deposits (see Figure 1). Iron Duke, Iron Magnet, Iron Knight (North and South) and Iron Chieftain quarries are all currently (2012) being mined. Iron Baron (East) mining commenced at the beginning of 2012. The Iron Baron ore beneficiation plant is currently being commissioned in order to beneficiate both old stockpiled and newly mined low grade ores.
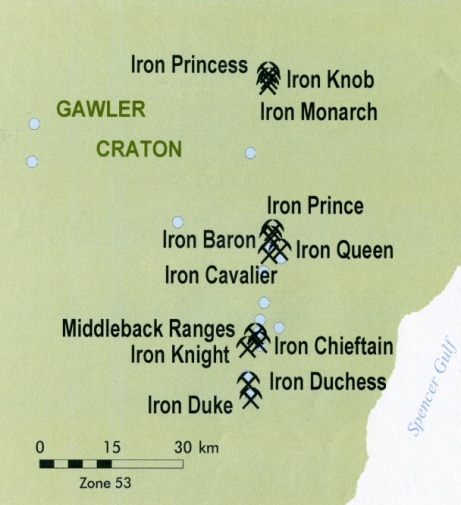
Figure 1. Location map for iron ore mines in the Middleback Range area of South Australia (after DMITRE,[1]
An examination of the effect of goethite on the surface properties of Iron Duke ore is the subject of a separate report by the author (Quast,[2]).
2.1.1. Historical
The Iron Baron mine was developed in 1930 and closed in 1989. During 1986 the Iron Baron mining area produced approximately 1.1 Mt of ore averaging 60.2 % Fe, 3.8 % SiO2 and 1.8 % Al2O3, while the Iron Knob mining area produced 0.85 Mt averaging 66.8 % Fe, 1.95 % SiO2 and 0.76 % Al2O3 (Yeates,[3]). Reid[4] reported on the then current mining operations in the Middleback Ranges. Iron Knob, Iron Baron and Iron Duke were producing 1.8 Mt/year iron ore for the Whyalla steelworks and 0.9 Mt/year for the Newcastle and Port Kembla steelworks. Lump ore from the Iron Knob area assayed 66.5 % Fe, 2.0 % SiO2, 0.8 % Al2O3 and 0.8 % P at the time of the article.
2.1.2. Geology and Mineralogy
The iron ores of the Middleback Range were formed by supergene enrichment. This process involved selective dissolution of gangue material and partial or total replacement by ore forming minerals. The iron formations were originally magnetite-rich (c.f. Lake Superior type banded iron formations (Liddy,[5]) with the magnetite being of diagenetic origin. The source of the iron was either primary sedimentary hematite or basin fluids. Carbonate minerals within the orebodies were almost completely replaced with iron but relic carbonate textures were retained. Silicates, however, were much less soluble and therefore mineralisation in the silicate facies iron formation is more patchy (Yeates,[3]). The diagenetic magnetite was recrystallised and remobilised during metamorphism and deformation. Uplift followed by several periods of intense erosion and weathering led to the oxidation of magnetite to hematite and martite by supergene processes.
In a detailed mineralogical study of these iron ores, Edwards[6] reported the average compositions given in Table 1.
Table 1. Compositions (in %) of Iron Ores in the Middleback Range (after Edwards[6])
SpeciesIron KnobIronMonarchIron BaronIron Prince
Fe68.364.765.864.4
Mn0.070.410.180.16
P0.030.040.030.02
S0.050.050.070.05
Table 2. Compositions (in %) of iron ores from the Middleback Ranges (after Liddy,[5])
SpeciesIron KnobIronMonarchIron BaronIron Prince
Fe68.062.062.066.4
Mn0.072.740.220.03
P0.03--0.0380.08
More recent data have been reported by Liddy[5] and given in Table 2.
The most recent compositional data located by the author are those of England and Turner[7] reported in Table 3.
Table 3. Compositions (in %) of iron ores from the Middleback Ranges (after England and Turner,[7])
SpeciesIron KnobIronMonarchIron BaronIron Prince
Fe70.468.8-70.869.2-70.869.6-71.0
Al--0.40.2-0.50.3-0.5
Si--0.3-0.40.2-0.40.2-0.3
Edwards[6] made the point that the hematite ores of these orebodies all exhibit similar textures, structures and mineralogical compositions. Although he distinguished three generations of hematite, it was the hematite derived from primary magnetite which constituted the bulk of the iron ore. Specular hematite was observed as a dyke in the Iron Monarch orebody and close to the western wall of the Iron Knob quarry.
In a later publication, Edwards[8] reported that the ores consist essentially of irregular-shaped, interlocking crystals of hematite, 500 μm across or smaller. Some of the hematite crystals contained minute residuals of magnetite, often only 10 μm across, and in some cases much of the hematite was pseudomorphous after interlocking octahedra of magnetite. The widespread presence of minute magnetite residuals in the hematite indicates that much of the hematite was derived from original magnetite.
England and Turner[7] found that in all the ore types examined, hematite either as martite or secondary hematite was the most abundant ore mineral. Some remnant magnetite was observed in the cores in hematite/martite aggregates. The main gangue minerals were clays, predominantly kaolinite. Some quartz, halloysite, halite and gypsum were noted, the latter two minerals presumably the result of recent groundwater redistribution of wind-blown material.
Brief mineralogical descriptions for each deposit are given below. The Iron Knob orebody consists almost entirely of hematite in fine-grained, dense and generally massive form (Miles,[9]). A later generation of hematite in the form of bands or veins of coarsely crystalline, specular hematite is present near the western wall of the quarry. These veinlets up to 50 mm in width occur in fractures and joint planes in massive, fine-grained hematite (Edwards,[6]). The Iron Knob ore appears to have been of a uniformly high grade, higher than Iron Monarch ore due to the absence of manganese minerals and less gangue minerals. Typical values are 95-97 % Fe2O3 (Miles,[9]), with assays of 68.8 % Fe (98.3 % Fe2O3) being common (Owen and Whitehead,[10]). According to Newton, Davies and Morris[11], supplies of recoverable ore from the Iron Knob mining operation were expected to end at the end of 1997 (actually closed in 1998). The Iron Princess deposit was being developed in the early 1990s according to Reid[4]. The Iron Duchess mine opened in 1998.
The Iron Monarch orebody occupies what was originally one of the highest hills in the area (Rudd and Miles,[12]). Iron Monarch ore is predominantly “hard” ore consisting essentially of hematite in a dense, fine-grained massive form (Miles, 1954[9]). Edwards[6] has demonstrated that much of the hematite in these massive orebodies is derived from and retains cores of magnetite. Manganese minerals including psilomelane and pyrolusite associated with this iron ore are well developed and have also been described by Edwards[6]. Gangue minerals consist primarily of quartz in minute grains enclosed by hematite and averaging about 2 % of the ore, with minor gypsum and calcite. In later papers, Owen ([13],[14]) reported that the ore is essentially hematite to its full depth; magnetite which is ubiquitous at depth elsewhere in the Middleback Ranges, occurs very sparsely at Iron Monarch. This is contradictory to the observations of Jack[15] who reported sufficient magnetite in this orebody to cause deflection of a compass.
According to Thomson[16], the Iron Monarch orebody consists of four separate orebodies; the main orebody, the eastern high manganese orebody and the eastern and western scree orebodies.
Typical Iron Monarch composition at the time that Owen ([13,[14]) wrote his papers was: 62 % Fe, 3 % Mn, 2 % SiO2, 2 % Al2O3, 0.02 % P and 0.03 % S.
Iron Prince ore comprises high-grade soft hematite in the northern area, showing the original banded structure of the parent jaspilite, and harder, more massive ore in the southern area (Thomson,[16]). The hematite varies from massive to loosely coherent according to Owen and Whitehead[10] and Ashworth and Furber[17]. The high-grade ore in this quarry is particularly rich in Fe, averaging 65 % Fe for the whole orebody.
According to Miles[9], the ore consists almost entirely of hematite or martite with very minor remnants of magnetite cores. The main impurity is silica with a weighted average of all assayed samples of high-grade ore from the tunnels in the main orebody being 65.56 % Fe, 0.31 % Mn and 0.024 % P.
As with the Iron Prince ore, individual orebodies in the Iron Baron deposit consist predominantly of medium – fine granular hematite or martite, either massive and banded or schistose and powdery (Miles,[9]). Like the Iron Prince ore, the Iron Baron ore is characteristically high grade, being low in manganese, silica, alumina and phosphorus. Miles[9] reported a weighted average of surface samples cut from the various lenses at Iron Baron as 64.03 % Fe and 0.19 % Mn.
More recently, Thomson[16] reported that the high-grade ore had an average grade of 63 % Fe. Both hard and soft ore types are present, with the main impurities being alumina and sulphur.

3. Hematite Surface Chemistry

When a relatively insoluble oxide e.g. hematite is placed in an aqueous electrolyte solution, rearrangement of ionic species at the solid-liquid interface occurs and an electrical double layer forms. This double layer consists of one layer of surface charge and another layer of counter ions. The net surface charge may be positive, negative or zero, and since the system as a whole must remain electrically neutral, the medium surrounding the oxide must contain an equivalent number of counter ions with opposite charges. These will be attracted to the charged surface sites and adsorbed at the oxide/solution interface. However, because of thermal agitation, this adsorbed layer extends as a diffuse layer over a finite distance from the particle surface.
The electrical double layer that develops at the hematite/solution interface is the result of hydrolysis of the surface species, followed by pH-dependent dissociation of surface hydroxyls. A general equation for this process is:
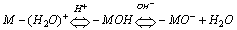
(1)
For oxides, protons (H+) and hydroxyl ions (OH-) are considered to be surface potential determining ions (PDI).
The double layer potential is zero when the surface charge is zero. This condition is known as the zero point of charge (zpc). The surface potential, ψ0 of these systems is given by:
(2)
where T = temperature (K), R = gas constant
and F = Faraday constant.
Z+ and Z- are valencies of PDI in solution inclusive of sign.
a+ is the activity of positive PDI
a- is the activity of negative PDI
a0+ is the activity of positive PDI with zero surface charge
a0- is the activity of negative PDI with zero surface charge.
For oxides, a+ and a0+ will be the activities of H+ ions in the solution considered and at the point of zero charge respectively, and a- and a0- will be the activities of hydroxyl ions under corresponding conditions. Thus, oxides will carry a positive charge in solutions that are more acidic than the zpc and a negative charge in solutions that are more alkaline.
The surface charge, σs, on a solid in an electrolyte solution is determined by the adsorption density of the PDI on the solid surface. In the case of a univalent salt, σs is given by equation (3).
(3)
where Γa+ is the adsorption density (in moles/cm2) of the potential determining cation (proton) and Γa- is the adsorption density of the potential determining anion (hydroxyl ion).
Surface characteristics can also be investigated using electrokinetic phenomena, which involve the interrelation between electrical and mechanical effects at a moving interface. The electrokinetic results obtained in this study are expressed in terms of the electrophoretic mobility (μ) which is the ratio of the velocity of a particle in an aqueous environment to the applied potential gradient. In this study, for the timing of particles (t seconds) over one graticle square (50 μm) under a known voltage (V volts) being applied over the effective length of the cell, ( 10 cm.) μ is given by equation (4):
(4)
Hence,
(5)
The electrophoretic mobility can be converted to a zeta potential using a correlation dependent on the value of κa where κ is the reciprocal “thickness” of the diffuse double layer and a is the radius of the particle. The changes in zeta potential reflect changes in solution characteristics and adsorption of various species at the double layer.
The isoelectric point (iep) refers to the conditions under which the zeta potential, as determined by electrophoretic measurements, is zero. The surface potential, Ψ0, need not be zero when the zeta potential is zero, particularly in the case of specific adsorption, hence the values of iep and zpc need not be the same.
Using these two techniques i.e. the determination of surface charge (in C/g) and the zeta potential (in mV) as functions of pH, it was hoped to characterise the samples of hematite. These hematites can be compared directly by comparing the values of zpc and iep determined using these two techniques.

4. Materials Examined

Four samples of high grade iron ores from the Middleback Range area were investigated in this study. These samples were received as lump ore from BHP OneSteel, Whyalla, South Australia. The synthetic hematite sample of Analytical Reagent (A.R.) grade was supplied by J.T. Baker Pty. Ltd and the Precipitated Hematite sample was from BDH.

5. Procedure

5.1. Characterisation of Minerals

Hematite samples from Iron Knob, Iron Princess, Iron Monarch, Iron Baron and Iron Prince were examined in this study. The samples were crushed and pulverised in a ring mill prior to analysis.
Iron assays were determined using the method of Kolthoff et al[18] which involved digestion using stannous chloride and hydrochloric acid followed by titration with potassium permanganate solution. The amount of acid insolubles (primarily silica) was determined gravimetrically on the residue remaining by filtration after acid digestion.
Specific Gravity (S.G.) was measured by displacement of nitrogen in a Quantachrome Stereopycnometer and the surface areas of the pulverised samples were measured using a Fisher Sub-sieve Sizer model 95 as per ASTM B330-88 (1988)[19].

5.2. Measurement of Zeta Potential

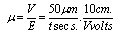
Suspensions of 1 g of hematite in 50 ml of distilled water, with the pH adjusted using dilute solutions of either hydrochloric acid or sodium hydroxide were centrifuged for 30 seconds at 2000 rpm. Substituting the centrifugal force acting in Stoke’s Law equation for free settling reveals that the largest hematite particle remaining in suspension after centrifuging was 1.5 μm, and the largest quartz particle was 2.3 μm. The supernatant liquid containing sub-micron particles was transferred to the flat cell of a Rank Bros. Microelectrophoresis Apparatus Mark II.
Particles were timed in moving a distance of 50 μm under a known potential gradient which was chosen to give timings between 5 and 10 seconds. At least 10 separate particles were timed, followed by another 10 after the electrode polarity had been reversed. The average of the 20 timings was used in the calculation of mobility as given in equation (5). Zeta potentials were calculated from mobility data using the rationalised Smoluchowski equation which is applicable for this system. Under normal operating conditions, zeta potential (ζ) in mV is given by equation (6).
(6)
where μ is the mobility in μm.cm.(sec.) -1.(volt) -1 as calculated in equation (5).
The results for samples tested using this technique are given in Figures 2A and 2B. The results were separated for clarity of comparison.

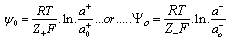
5.3. Measurement of Zero Point of Charge (zpc)

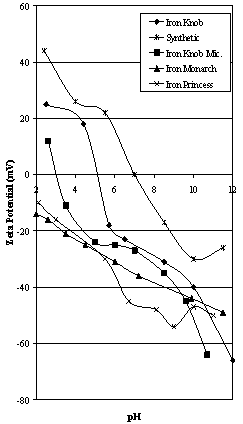
Figure 2A. Zeta Potential Characteristics of Iron Knob area ores compared to synthetic hematite
The method of Mular and Roberts[20] was used to determine the values of zpc for the various hematite samples. Suspensions of 2 g of hematite in 50 ml of 10-2 M potassium nitrate (KNO3) (in distilled water) were prepared and the pH adjusted using either potassium hydroxide or nitric acid as required. Only one pH regulator was used, as ionic strength is an important consideration in this method. Increasing the concentration of the electrolyte will increase the magnitude of the surface charge through the corresponding compression of the double layer. Increasing the magnitude of the surface charge will cause a rearrangement of the surface ions except at the zpc. Effectively, the added cations and anions from the salt compete for sites in the electrical double layer occupied by H+ or OH-. Protons and hydroxyl ions can be adsorbed or released resulting in a change in pH, which is measured. At the zpc, increasing the electrolyte concentration will have no effect on either the surface charge or the pH, hence the zpc can be identified by the pH where the change in surface charge is zero (Woods,[21]).
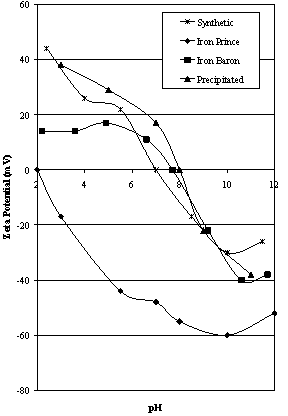
Figure 2B. Zeta Potential Characteristics of Iron Prince area ores compared to synthetic hematites
When the pH was stable at the initial value, pH (i), sufficient solid KNO3 was added to increase the KNO3 concentration to 10-1 M. When the pH again stabilised (which usually took from 2 to 5 minutes), this value was designated the final pH, pH (f). The change in pH, ΔpH, was determined by the difference (inclusive of sign) between the final pH and the initial pH i.e. ΔpH = pH (f) – pH (i). The results for these tests are shown in Figures 3A and 3B.
In an attempt to estimate the charge on the hematite surface, the following hypothesis is presented:
Equation (3)
(3)
can be rewritten for oxides as:
(7)
where σ0 has the units of coulombs/gram.
Hence:
(8)
Since pH is the negative logarithm of the molar concentration of protons in solution and pOH is the corresponding value for hydroxyl ions.
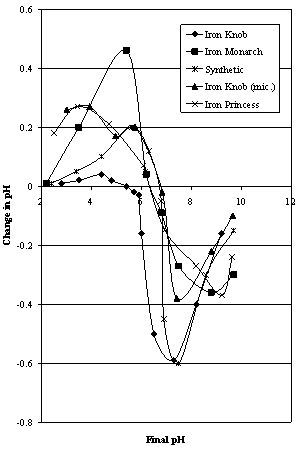
Figure 3A. Mular and Roberts plots for Iron Prince area ores compared to synthetic hematites
From the Mular and Roberts[20] procedure, pH(i) and pH (f) (and hence pOH(i) and pOH(f) )are known, and these values can be substituted into equation (8). The results of these calculations are given in Figure 4 as surface charge (C/g) as a function of final pH. To examine the area of Figure 4 where the graphs cut the abscissa (x-axis), the region of surface charge between –0.1 and 0.1 C/g was plotted as Figure 4A.
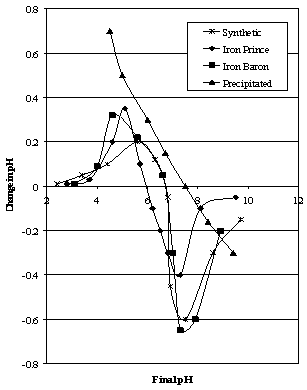
Figure 3B. Mular and Roberts plots for Iron Prince area ores compared to Synthetic Hematites
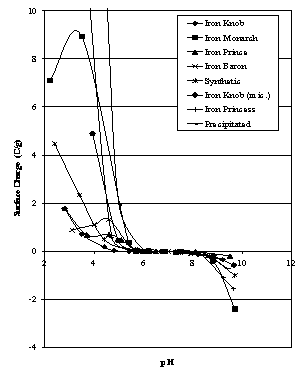
Figure 4. Surface Charge estimates for hematites
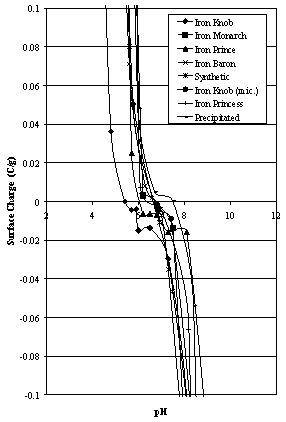
Figure 4A. Surface Charge estimates for hematites (low surface charge area)

6. Results and Discussion

A summary of the physical and chemical characteristics of the pulverised hematite samples is given in Table 4.
Table 4. Physical and chemical characteristics of pulverised hematite samples
SampleColour%FeS.G.Surface Area(m2/g)
Iron KnobBlack69.55.360.136
Iron MonarchBlack68.55.060.364
Iron PrinceRed-brown68.05.020.135
Iron BaronBrown64.04.700.167
Mic. Iron KnobBlack69.45.300.110
Iron PrincessRed-brown69.75.120.135
PrecipitatedOrange69.54.80>2
A.R. SyntheticOrange69.95.22>2
The selection of a number of samples of relatively pure, naturally-occurring hematites from the same general area should give an indication of the sensitivities of the various techniques used to study their surface properties (see Table 4). The inclusion of two synthetic samples in the suite should also highlight any differences between the two types of hematite.
The zeta potential characteristics of the hematites investigated show a wide range of behaviour (see Figures2A and 2B). One method of comparison is to compare the values of the iep of the various samples (from Figures 2A and 2B) to each other and to the values of zpc (from Figures 3A and 3B). These are given in Table 5.
Table 5. Summary of surface characteristics of hematites
HematiteIsoelectric PointZero point of Charge
Iron Knob5.35.5
Iron Monarch<26.5
Iron Prince2.06.0
Iron Baron7.76.8
Mic. Iron Knob3.06.5
Iron Princess<26.4
Precipitated8.07.5
A.R. Synthetic7.06.7
From Table 5 there is a good correlation between iep and zpc values for Iron Knob (not the micaceous sample) and the synthetic samples, whereas the values for iep and zpc for the other hematites are very different. The values of iep vary from <2 to almost 8, but the values of zpc lie in a much narrower range (5.5-7.5). As mentioned in the Literature Survey, these values may not necessarily be coincident as they are measuring different characteristics.
Kulkarni and Somasundaran[22] determined the iep of a natural hematite sample to be 3.0, whereas the zpc of the same hematite, using titration techniques, was determined as 7.1. The explanation for these results was mineral heterogeneity i.e. the presence of fine silica in the hematite exerted its influence on the surface properties measured by electrophoresis. Lyklema[23] suggested that the low iep values recorded for some hematites were due to thin layers of silicates covering their surfaces. In contrast to this, Joy, Watson and Cropton[24] measured the iep of a Brazilian hematite as 5.4 and the zpc at 5.7. Smith and Salman[25] reported a zpc of 8.68 and an iep of 8.5 for a sample of natural hematite. More recently, Mwaba[26] measured the iep and zpc of a Swedish hematite at 4.2. Das and Naik[27] measured the iep of an Indian hematite at the same value after conditioning in 10-3M KNO3 for 24 hours prior to the determination.
Pugh and Lundstrom[28] used surface chemical techniques to characterise hematite fines. They identified two distinct types of hematite particles, a black, “coarser crystallite” fraction coarser than 5 μm and a red “colloidal” fraction of approximately 1 μm in size. Using ESCA it was postulated that the red hematite particles were more hydroxylated than the black hematite, possibly due to the smaller particles having freshly formed stressed surfaces with higher surface energy which is more easily hydrated on dispersing in water. The iep of the colloidal red hematite measured using microelectrophoresis was 3, but the zpc using potentiometric titration was 6.3. The potentiometric titration curves reported by Pugh and Lundstrom[28] are almost identical in shape to those shown in Figure 4, with a region of very low surface charge stretching from pH 6-9.
Kulkarni and Somasundaran[22] also showed that the measured iep of a heterogeneous mineral surface is between the iep values of the two mineral components. Values of the iep for naturally occurring hematites are usually in the acid to neutral pH region (e.g. 3.5-6.7 (Joy and Watson,[29]); 2.2-6.9 (Parks,[30]); 5.4-6.7 (Fuerstenau,[31]); 6.2 (Winer and Wright,[32]) and 8.68 (Smith and Salman,[33])). For synthetic hematites, these values are usually in the alkaline region (e.g. 8.7-9.04 (Parks,[30]); 9.04 (Korpi, (cited by[24], Mular and Roberts,[20]). Values for the iep of silica are usually in the strongly acidic region (e.g. 2.5 (Smith and Trivedi,[34]); 1.3-3.7 (Fuerstenau,[31]) and 1.5-2.8 (Parks,[30]).
Montes et al[35] examined the differences in surface chemical behaviour between two size ranges of hematite, particles less than 10 μm and those coarser than 10 μm. The Fe2O3 contents were 86.6% and 91.1% respectively. The zeta potentials for the fine particles were determined using electrophoresis and the coarser particles were examined using streaming potential. The isoelectric point for the fine particles was determined as 3.3 and for the coarse particles it was 6.0. The lower value was explained by the presence of quartz. Desliming the particles with acid and washing with water returned a value of 8.8 using potentiometric titration. This technique also revealed a very low value of zeta potential of less than 1 mV over the pH range 5 to 9. This would have consequences when this mineral is subjected to flotation.
Kosmulski[36] and Kosmulski et al[37] tabulated many values of the iep and zpc of natural and synthetic samples of hematite. The zpc values reported for synthetic hematites range from 3.2 to 9.5 with an average of 7.8. For natural hematites the range was 5.3 to 7.8 with an average of 6.0.
Knowing that fine silica is present in the ore samples (see Literature Review) and that the coarse particles were centrifuged out prior to testing in the microelectrophoresis apparatus (see Procedure) suggests that a significant portion of the material in the flat cell is actually silica. (The coarse particles were centrifuged out because the settling of these particles under gravity would disrupt the horizontal velocity of the particles under the influence of the applied electric field). This was verified by chemical analysis that showed that even though e.g. Iron Prince hematite ore only contained 2 % silica, the –7 μm slime fraction contained more than 20 % silica. This could well explain the low iep values measured for Iron Monarch (finely ground-see Table 4) and Iron Prince, and the much higher values measured for the purer Iron Knob and A.R. synthetic hematite samples but not the impure Iron Baron sample (see Figure 2B).
Chuanyao and Yongxin[38] have published one of the few articles that compare the zeta potential of hematite, magnetite and martite (see Figure 5). These minerals were all mentioned in the Literature Survey on the mineralogy of the Middleback Range hematites. Comparing the data of Chuanyao and Yongxin[38] to that reported in Figure 2 shows that the curve for the Iron Prince follows their hematite curve closely, whereas there are no other matches, suggesting little contribution from any magnetite or martite that may be present in these samples of Middleback Range iron ores. Joy and Watson[29] also found that the iep of natural hematites varied with colour, pretreatment, size and degree of hydration.
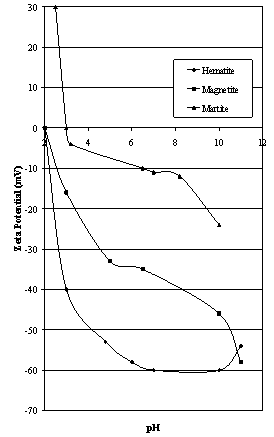
Figure 5. Zeta Potential of iron oxide minerals as reported by Chuanyao and Yongxin[38]
Smith and Trivedi[34] reported that the iep of hematite progressed from an initial value of 2.5 to a final value of 7.0 after 60 days ageing in water in plastic phials. (The change in iep was substantially complete within 20 days). The reason given for this change related to the dissolution of disturbed, possibly amorphous layers on the surface of the mineral ultimately exposing inner, undisturbed layers, accompanied by readsorption of complex hydroxy species back onto the surface of the mineral.
Although the method of Mular and Roberts[20] is very simple, it does have some limitations. One of these is the very small changes in pH (of the order of 0.01 units) which must be accurately measured both to determine the exact value of the zpc and to accurately plot the curves at high and low values of pH. Other conditions for the use of this technique are:
1. That the supporting electrolyte does not specifically interact with the oxide surface. (Gibb and Koopal[39] have reported some adsorption of KNO3 on high surface area synthetic hematite).
2. That the addition of the electrolyte in the absence of the oxide sample under test does not change the pH, although this situation can be overcome using “blank” runs.
When comparative tests were done on the five hematite samples (see Figure 3), the curves cut the ΔpH = 0 axis between 5.5 and 7.0, and approach the axis at regions of high and low pH. The shape of these curves is very similar to that reported by Mular and Roberts[20]. It was obvious while conducting the tests that at very low ΔpH values in the pH region 6 – 7, the oxide settled rapidly out of the suspension leaving a clear supernatant liquid. This is supporting evidence for the zpc of the hematite samples being in this range, as the zpc coincides with the maximum settling rate (Fuerstanau,[31], Sadowski and Laskowski,[40]).
On the basis of these tests it is argued that the values of zpc reported in Table 5 represent those of the hematite surface, since the whole surface is in contact with the electrolyte, not just the fine component which is predominantly silica gangue.
The approach to the ΔpH = 0 axis at high and low values of pH has been discussed by Korpi (cited in Joy and Watson,[29]). Korpi pointed out that an oxide surface has a finite number of adsorption sites capable of reacting with hydrogen and/or hydroxyl ions. When this point is reached any further addition of acid or base will alter the pH of the suspension strictly according to the amount added, and no further adsorption will occur. An alternative hypothesis has been reported by Kanungo and Mahapatra[41] who suggest that the approach to the axis at pH 2 is due to the formation of neutral polycations of Fe (OH)3 on the surface of the goethite sample that they were testing.
Examination of Figure 4 shows a truer picture of the surface charge characteristics. Instead of the curves approaching the axis at the extreme ends of the pH spectrum as shown in Figure 3, the curves actually show greatly increasing surface charges away from the zpc as would be expected. The difficulty comes in the measurement of the very small changes in pH (of the order of 0.01 pH units) which is beyond the scope of most commercially available pH meters. There is also the question of the stability of the pH readings that are usually ± 0.01 pH units. The high values of surface charge calculated for the Iron Monarch sample shown in Figure 4 are due to the much higher surface area of this pulverised sample as indicated by the results obtained on the Fisher Sub-sieve sizer (see Table 4). The reduction in estimated surface charges of the Iron Monarch and Iron Baron samples at low pH would almost certainly be due to the lack of sensitivity of the pH meter, since from equation (8), low values of pH(i) and pH(f) cause these terms to dominate the calculated value of surface charge, and any inaccuracies in these values will cause large variations in the calculated values of surface charge.
When the low surface charge area of Figure 4 is expanded (see Figure 4A) some “wobbles” in the curves are evident, again due to inaccuracies in the pH readings, as values of surface charge are very dependent on the meter accuracies at these low values of ΔpH. In the author’s opinion, Figures 4 and 4A give a truer picture of surface behaviour of these hematite samples than the plots usually presented (as shown in Figure 3). It is easier to calculate the values of zpc using Figure 3, however, a clearer indication of the actual surface charge characteristics is given in Figures 4 and 4A.
Kosmulski[36] has reported numerous titration curves for (synthetic?) hematite and goethite in solutions containing 10-2M and 10-1M inert electrolytes. At pH 3-4, the surface charge densities are typically in the range 0.1-0.3 c/m3. He results of the present study were obtained on samples weighing 2g. At pH 3-4 the synthetic hematite had a charge density of 12 C/g, requiring a surface area of approximately 100 m2/g to give compatible charge density values to those reported by Kosmulski[36]. For the natural hematites, a surface area of 10 m2/g is required. This is still a factor of 100 greater than that measured by the Fisher Sub-Sieve Sizer, and this is why the surface charge data shown in Figures 4 and 4A are given in the units of C/g.
From the data reported here it should be possible to characterise these samples of hematite. From Table 4 there is a gradation in colour from black (Iron Knob and Iron Monarch) to red-brown (Iron Prince) to brown (Iron Baron) to orange (A.R. sample). Joy and Watson[29] were able to distinguish various surface characteristics relating to the colour of the hematite samples. The colour of various iron oxides has been studied by Diffuse Reflectance Spectroscopy by Torrent and Barron[42]. These authors suggested that each individual iron oxide exhibits a colour that is mainly a function of the electron transitions allowed by its structure. Other factors significantly affecting colour include particle size and shape, crystal defects, adsorbed impurities and the degree of particle packing. The effect of particle size can be dramatic, with micaceous hematite turning from black to bright red when ground to micron size.
An important consideration is hematite purity where the % Fe gives a good indication of how much hematite is present in the sample. Pure hematite contains 70 % Fe and pure magnetite 72.4 % Fe. Hematite samples containing >69 % Fe should be fairly pure, although any fine silica can dramatically affect the zeta potential characteristics (refer to discussion on Iron Prince ore). This need not always be the case because the iep of the lowest iron containing hematite (Iron Baron) was 7.7, higher than that measured for the A.R. sample that contained virtually pure Fe2O3. (This was confirmed using X-ray diffraction techniques).
The specific gravity tends to follow the purity of the hematite samples as would be expected, as impurities (e.g. silicates) have lower values of S.G. than pure hematite. This is observed in Table 4.
The surface area gives an indication of the degree of fineness to which these samples were ground. The only equipment available to the author at the time this project was done was a Fisher Sub-sieve Sizer Model 95. Winer and Wright[32] cite a practical upper limit for accurate operation of the Fisher instrument of 1.2 m2/g. Up to surface areas of 1 m2/g (see Table 4), the Fisher could be expected to yield surface area data of reasonable accuracy for regular-shaped powders. It does mean, however, that the surface area of the A.R. sample could not be determined using this technique. The finer grinding given to the Iron Monarch sample (see Table 4) would obviously release more fine impurities to be tested in the microelectrophoresis apparatus, and the resulting zeta potential curve for this sample is typical of that reported for quartz (see Figure 2).
As discussed above, zeta potential is not a reliable method of characterisation due to the presence of fine silica which can dominate the species under test in the microelectrophoresis apparatus. It does give reasonable iep values for the Iron Knob and high purity synthetic samples (see Table 5).
The Mular and Roberts[20] plots give a good estimate of the zpc of the hematites, since now the total surface is taking part in what is essentially a potentiometric titration. From Figure 3, the curves are essentially symmetrical about the ΔpH = 0 axis with the exception of the curve for Iron Knob. This curve shows low ΔpH values for pH <zpc and much higher ΔpH values for pH >zpc. Looking at the surface charge values shown in Figure 4 reveals that this is an experimental artifact, since the curve for Iron Knob shown in Figure 4 is quite symmetrical about the zero surface charge axis. The advantage of the Mular and Roberts plots is that they allow a good method for the determination of the zero point of charge. Recently, Alvarez-Silva et al[43] stated that the Mular and Roberts technique was reliable and repeatable, and that the zero point of charge was equal to the isoelectric point for alumina and silica. It is not applicable where ions other than H+ and OH- ions are potential determining ions.
The surface charge plots shown in Figures 4 and 4A give the best indication of the surface properties of the hematite samples. The Iron Knob curve is displaced approximately 1 pH unit to the acid side of the other curves, showing that this sample is different. Examination of the colour and habit of this sample shows a strong tendency to micaceous behaviour, hence one could speculate that the zpc values of micaceous hematites can be lower than those measured for “massive” hematites. This is an area worthy of further study. The zpc for the Iron Prince sample is 6.0. From Figure 4, the curve for the Iron Prince is very similar to the Iron Knob curve for pH<3.5, then moves closer to the curves of the other hematite samples at higher values of pH. The curves for the remainder of the samples (Iron Monarch, Iron Baron and synthetic) are quite similar (see Figure 4A) suggesting that these surfaces have similar properties. This is surprising, since the A.R. sample is a high surface area synthetic sample, but still behaves similarly to the coarser, natural hematites showing that the surface properties are governed by chemical rather than physical parameters. The value of the zpc of hematite also depends on temperature (Schoonen,[43]).

7. Conclusions

Different samples of hematite exhibit different surface characteristics depending on such factors as colour, purity (and S.G.) and surface area. The natural hematite samples have very similar mineralogical characteristics, being formed under similar processes. All the hematites examined have high iron contents. Of the natural hematites examined, the Iron Knob sample had the highest purity.
Hematite surface chemistry was investigated using two techniques: microelectrophoresis and a modified form of potentiometric titration. These techniques allowed the determination of the isoelectric point and zero point of charge respectively. Isoelectric points for the samples examined showed a wide range of values due to the presence of fine silica in the ore strongly influencing the values of iep for some samples.
Using a simple potentiometric titration technique allowed the determination of the zero point of charge for these samples, but a simple mathematical calculation allowed an estimation of the surface charge characteristics. It is recommended that this technique be conducted on many different and well-characterised hematite samples to determine its suitability as a rapid method of characterisation, especially as it could point to the development of micaceous habit.

ACKNOWLEDGEMENTS

The author is grateful to BHP Long Products Division, Whyalla for providing the original hematite samples investigated in this study and for Onesteel for the Iron Princess sample. Informative discussions with Professor Tom Healy, former Director, Advanced Mineral Products Research Centre, University of Melbourne are gratefully acknowledged.

References

[1]  DMITRE, 2012, South Australian Earth Resources Information Sheet M20, Iron Ore Deposits in South Australia, published February, 2012, 5p.
[2]  Quast, K.B., 2012, Effect of 25% Goethite on the Surface Chemistry of Hematite, Manuscript submitted to International Journal of Mining Engineering and Mineral Processing..
[3]  Yeates, G., 1990, Middleback Range Iron Ore Deposits, in “Geology of the Mineral Deposits of Australia and Papua New Guinea” ed. F.E. Hughes, The Australasian Institute of Mining and Metallurgy, p. 1045-1048.
[4]  Reid, R.B., 1993, Iron Ore Mining by BHP Steel-Long Products Division at Iron Knob and Iron Duke, S.A. in “Australasian Mining and Metallurgy (Sir Maurice Mawby Memorial Volume) 2nd. Ed. Vol. 1, ed. J.T. Woodcock and J.H. Hamilton, Monograph 19, Australasian Institute of Mining and Metallurgy, p. 245-246.
[5]  Liddy, J.C., 1968, The Jaspilite Iron Ores of Western and South Australia, Australian Mining, 60(10), 21-29.
[6]  Edwards,A.B., 1936, The Iron Ores of the Middleback Ranges, South Australia, Proceedings, Australasian Institute of Mining and Metallurgy, No. 102, 155-207.
[7]  England, B.M. and Turner, K.E., 1983, A Morphological and Mineralogical Study of Selected Ores from the Middleback Range, South Australia. Part 1- Iron Knob, Iron Monarch, Iron Prince, Iron Baron, Iron Queen, Cavalier and Racecourse Orebodies, BHP Central Research Laboratories Report No. CRL/R/27/83. 96p.
[8]  Edwards, A.B., 1953, Mineralogy of the Middleback Range Iron Ores, in, “Geology of Australian Ore Deposits”, Vol. 1, Proceedings of the Fifth Empire Mining and Metallurgical Congress, ed. A.B. Edwards, Australasian Institute of Mining and Metallurgy, p. 464-472
[9]  Miles, K.R. 1954, The Geology and Iron Ore Resources of the Middleback Range Area, Geological Survey of South Australia Bulletin No. 33, 245 p.
[10]  Owen H.B. and Whitehead, S., 1965, Iron Ore Deposits of Iron Knob and the Middleback Ranges in “Geology of Australian Ore Deposits” 2nd. Ed., Eighth Commonwealth Mining and Metallurgical Congress, Vol. 1, ed. J.McAndrew, Australasian Institute of Mining and Metallurgy, p. 301-308.
[11]  Newton, W. Davies, M. and Morris, B., 1997, Emerging New Resources for World Class Iron and Steel Production in South Australia, MESA Journal, 7, p. 6-11.
[12]  Rudd, E.A. and Miles, K.R. 1953, Iron Ores of the Middleback Ranges, South Australia, Proceedings, Fifth Empire Mining and Metallurgical Congress, Vol. 1, “Geology of Australian Ore Deposits” ed. A.B. Edwards, Australasian Institute of Mining and Metallurgy, p. 449-463.
[13]  Owen, H.B., 1963, The Geology of the Iron Monarch Orebody, paper No. 6, Annual Conference of the AusIMM, Whyalla, S.A. p. 1-8.
[14]  Owen, H.B., 1964, The Geology of the Iron Monarch Orebody, Proceedings of the Australasian Institute of Mining and Metallurgy, 209, 43-67.
[15]  Jack ,R.L., 1922, The Iron Ore Resources of South Australia, Geological Survey of South Australia Bulletin No. 9, p. 38.
[16]  Thomson, I.A., 1974, BHP Raw Materials Operations in South Australia, Mineral Resources Review (Dept. of Mines, South Australia) 140, p. 7-20.
[17]  Ashworth, K.L. and Furber, D.V., 1976, Middleback Iron Ore, Mining Magazine 134, 170-179.
[18]  Kolthoff, I.M., Sandell, E.B., Meehan, E.J. and Bruckenstein, S.,1969, Quantitative Chemical Analysis, 4th. Ed., Macmillan, New York, p. 832-834.
[19]  ASTM B330-88, 1988, Standard Test Method for Average Particle Size of Powders of Refractory Metals and their Compounds by the Fisher Sub-Sieve Sizer, 3p.
[20]  Mular, A.L. and Roberts, R.B., 1966, A Simplified Method to Determine Isoelectric Points of Oxides, Canadian Mining and Metallurgical Bulletin 59(655), 1329-1330.
[21]  Woods, R., 1990, The Electrical Double Layer Properties of Oxides, M. App. Sc. Thesis, S.A. Institute of Technology, 199 p.
[22]  Kulkarni,R.D. and Somasundaran, P.,1976, Mineralogical Heterogeneity of Ore Particles and its Effects on their Interfacial Characteristics, Powder Technology,14, 279-285.
[23]  Lyklema, J., 1975, cited in Yariv, S. and Cross, H.,1979, Geochemistry of Colloid Systems for Earth Scientists, Springer-Verlag, p.218.
[24]  Joy, A.S., Watson, D. and Cropton, R.W.G., 1964, Collector Adsorption and Surface Charge Density, Trans. AIME, 229, 5-7.
[25]  Smith G.W. and Salman, T., 1971, The Adsorption of Dehydroabietylamine Acetate on Mineral Oxides, Canadian Mining and Metallurgical Bulletin, 64(709), 70-75.
[26]  Mwaba, C.C., 1991,Surfactant-Enhanced Dewatering of Graphite and Hematite Suspensions, Minerals Engineering, 4(1), 49-62.
[27]  Das, B. and Naik, P.K., 2003, Electrokinetic and Flotation Studies of Hematite using di(2-ethyl hexyl) Phosphoric Acid, J. South African Institute of Mining and Metallurgy, 103, July/August, 397-401.
[28]  Pugh, R.J. and Lundstrom,H.,1987, The Surface Characterization and Flocculation of Hematite Fines, in “Flocculation in Biotechnology and Separation Systems” ed. Y.A.Attia, Elsevier, p. 673-694.
[29]  Joy, A.S. and Watson, D., 1963, Occurrence and Properties of Hematite Slimes, in “Mineral Processing” (Proceedings of the Sixth Mineral Processing Conference, Cannes, France) ed. A. Roberts, paper 24F, Pergamon Press, p 355-368.
[30]  Parks, G.A., 1965, The Isoelectric Points of Solid Oxides, Solid Hydroxides and Aqueous Hydroxo Complex Systems, Chemical Reviews, 65, 177-198.
[31]  Fuerstenau, D.W., 1970, Interfacial Processes in Mineral/Water Systems, Pure and Applied Chemistry, 24(1), 135-164.
[32]  Winer, A.A. and Wright, I.F., 1966, Practical Problems in Particle Size and Surface Area Measurements, J. Canadian Ceramic Society, 35 68-75.
[33]  Smith, G.W. and Salman, T., 1966, Zero Point of Charge of Hematite and Zirconia, Canadian Metallurgical Quarterly, 5(2), 93-97.
[34]  Smith, R.W. and Trivedi, N., 1974, Variation of Point of Zero Charge of Oxide Minerals as a Function of Ageing Time in Water, Trans. AIME, 255, 69-74.
[35]  Montes, S., Atenas, G.M. and Valero, E., 2007, How fine Particles on Haematite Mineral Ultimately Define the Mineral Surface Charge and Overall Floatability Behaviour, Journal of the Southern African Institute of Mining and Metallurgy, 107, 689-695.
[36]  Kosmulski, M., 2001, Chemical Properties of Mineral Surfaces, Marcel Dekker, New York
[37]  Kosmulski, M., Maczka, E., Jartych, E. and Rosenholm, J.B., 2003, Synthesis and Characterisation of Goethite and Goethite-Hematite Composite: Experimental Study and Literature Survey, Advances in Colloid and Interface Science, 103, 279-285.
[38]  Chuanyao, S. and Yongxin, L., 1992, Effect of Trace Elements Occurring on Mineral Surface on Floatability. Part 11: Effect of Surface Characteristics of Aegirine and Hematite on their Floatability, in “Proceedings of the First International Conference on Modern Process Mineralogy and Mineral Dressing”, International Academic Publishers, p. 213-218.
[39]  Gibb, A.W.M. and Koopal, L.K. 1990, Electrochemistry of a Model for Patchwise Heterogeneous Surfaces, J. Colloid and Interface Science, 134(1), 122-138.
[40]  Sadowski, Z. and Laskowski, J., 1980, Hindered Settling-a New Method of the iep Determination of Minerals, Colloids and Surfaces, 1, 151-159.
[41]  Kanungo, S.B. and Mahapatra, D.M., 1989, Interfacial Properties of Two Hydrous Iron Oxides in KNO3 Solution, Colloids and Surfaces, 42, 173-189.
[42]  Torrent, J. and Barron, V., 2002, Diffuse Reflectance Spectroscopy of Iron Oxides, in "Encyclopedia of Surface and Colloid Science", Marcel Dekker, p. 1438-1446.
[43]  Alvarez-Silva, M., Uribe-Salas, A., Mirnezami, M. And Finch, J.A., 2010, The Point of Zero Charge of Phyllosilicate Minerals using the Mular-Roberts Titration Technique, Minerals Engineering, 23, 383-389.