-
Paper Information
- Next Paper
- Previous Paper
- Paper Submission
-
Journal Information
- About This Journal
- Editorial Board
- Current Issue
- Archive
- Author Guidelines
- Contact Us
International Journal of Mining Engineering and Mineral Processing
2012; 1(2): 62-68
doi: 10.5923/j.mining.20120102.07
Influence of 25% Goethite on the Surface Chemistry of Hematite
 Abstract
 Reference
 Full-Text PDF
 Full-Text HTML
Keith Quast
Ian Wark Research Institute, University of South Australia, Mawson Lakes 5095 South Australia
Correspondence to: Keith Quast , Ian Wark Research Institute, University of South Australia, Mawson Lakes 5095 South Australia.
| Email: |  |
Copyright © 2012 Scientific & Academic Publishing. All Rights Reserved.
Surface chemical techniques were used in an attempt to characterise two samples of hematite from the Iron Duke deposit in the Middleback Ranges of South Australia. The surface chemistry of the two naturally occurring samples was compared to a high purity, synthetic sample. The presence of 25% goethite affected the isoelectric point of the hematite, but the zero points of charge for all the samples examined in this study were identical. The differences between the values of isoelectric points and zero points of charge for these samples were deemed due to the presence of fine silica in the ore samples and the presence of unidentified amorphous material in the synthetic sample.
Keywords: Goethite, Hematite, Surface Chemistry, Zeta Potential
Article Outline
1. Introduction
- The aim of this paper is to investigate some of the effects of the presence of goethite on the surface chemistry of Iron Duke hematite, a high grade deposit in the southern of . A high grade synthetic hematite sample was used as a reference for surface characteristics. The surface chemistry of these hematite samples was investigated using conventional microelectrophoresis techniques as well as a modified form of potentiometric titration that provided a measurement of the zero point of charge (zpc) for the three samples investigated.
2. Literature Survey
2.1. Surface Chemistry of Oxides
- When a relatively insoluble oxide e.g. hematite is placed in an aqueous electrolyte solution, rearrangement of ionic species at the solid-liquid interface occurs and an electrical double layer forms. This double layer consists of one layer of surface charge and another layer of counter ions. The net surface charge may be positive, negative or zero, and since the system as a whole must remain electrically neutral, the medium surrounding the oxide must contain an equivalent number of counter ions with opposite charges. These will be attracted to the charged surface sites and adsorbed at the agitation, this adsorbed layer extends as a diffuse layer over a finite distance from the particle surface.The electrical double layer that develops at the hematite/solution interface is the result of hydrolysis of the surface species, followed by pH-dependent dissociation of surface hydroxyls. A general equation for this process is:
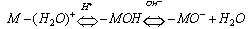 | (1) |
 | (2) |
 | (3) |
 | (4) |
 | (5) |
2.1. Surface Chemistry of Hematite and Goethite
- Since we are dealing with two samples of natural iron ore minerals, it is necessary to be aware of impurites associated with them. The usual impurity associated with naturally occurring iron oxides is silica, and a brief review of the effect of silica on the surface characteristics of hematite are given below.Kulkarni and Somasundaran[1] determined the iep of a natural hematite sample to be 3.0, whereas the zpc of the same hematite, using titration techniques, was determined as 7.1. The explanation for these results was mineral heterogeneity i.e. the presence of fine silica in the hematite exerted its influence on the surface properties measured by electrophoresis. Lyklema[2] suggested that the low iep values recorded for some hematites were due to thin layers of silicates covering their surfaces. In contrast to this, Joy, Watson and Cropton[3] measured the iep of a Brazilian hematite as 5.4 and the zpc at 5.7. Smith and Salman[4] reported a zpc of 8.68 and an iep of 8.5 for a sample of natural hematite. More recently, Mwaba[5] measured the iep and zpc of a Swedish hematite at 4.2.Pugh and Lundstrom[6] used surface chemical techniques to characterise hematite fines. They identified two distinct types of hematite particles, a black, “coarser crystallite” fraction coarser than 5 μm and a red “colloidal” fraction of approximately 1 μm in size. Using ESCA it was postulated that the red hematite particles were more hydroxylated than the black hematite, possibly due to the smaller particles having freshly formed stressed surfaces with higher surface energy which is more easily hydrated on dispersing in water.Kulkarni and Somasundaran[1] also showed that the measured iep of a heterogeneous mineral surface is between the iep values of the two mineral components. Values of the iep for naturally occurring hematites are usually in the acid to neutral pH region (e.g. 3.5-6.7 (Joy and Watson,[7]; 2.2-6.9 (Parks,[8]; 5.4-6.7 (Fuerstenau,[9]; 6.2 (Winer and Wright,[10] and 8.68 (Smith and Salman,[11]). For synthetic hematites, these values are usually in the alkaline region (e.g. 8.7-9.04 (Parks,[8]; 9.04 and 6.95 (Mular and Roberts,[12]).Montes et al[13] examined the differences in surface chemical behaviour between two size ranges of hematite, particles less than 10 μm and those coarser than 10 μm. The Fe2O3 contents were 86.6% and 91.1% respectively. The zeta potentials for the fine particles were determined using electrophoresis and the coarser particles were examined using streaming potential. The isoelectric point for the fine particles was determined as 3.3 and for the coarse particles it was 6.0. The lower value was explained by the presence of quartz. Desliming the particles with acid and washing with water returned a value of 8.8 using potentiometric titration. This technique also revealed a very low value of zeta potential of less than 1 mV over the pH range 5 to 9. This would have consequences when this mineral is subjected to flotation.Kosmulski[14] and Kosmulski et al[15] has tabulated many values of the iep and zpc of natural and synthetic samples of hematite and goethite. The zpc values reported for synthetic hematites range from 3.2 to 9.5 with an average of 7.8. For natural hematites the range was 5.3 to 7.8 with an average of 6.0. The zpc values of synthetic goethite range from 5.6 to 10 with an average of 8.4. Recently Madigan et al[16] reported an isoelectric point of synthetic goethite at 6.2. For all other goethites the reported range was 5.8 to 9.2 with an average of 7.5. Ramos and McBride[17] measured the zero point of charge of a synthetic goethite sample as between pH 7.0 and 7.7 using light transmittance. They made the comment that it was lower than that reported by potentiometric titration because it was shifted lower by the presence of adsorbed bicarbonate ion. Carlson and Kawatra[18] showed that sparging a hematite slurry with carbon dioxide caused a reduction in pH and a surface modification of the hematite surface. Sparging with carbon dioxide did not change the value of the isoelectric point much from its initial value of approximately 2, however subsequent purging the slurry with distilled water for 24 hours returned a value of the isoelectric point of approximately 4. The hematite sample only contained 81% hematite.For mineral goethite Parks[8] reported values of the isoelectric point between 3.2 and 6.7. Values for the iep of silica are usually in the strongly acidic region (e.g. 2.5[19]; 1.3-3.7[9] and 1.5-2.8[8]).Smith and Trivedi[19] reported that the iep of hematite progressed from an initial value of 2.5 to a final value of 7.0 after 60 days ageing in water in plastic phials. (The change in iep was substantially complete within 20 days). The reason given for this change related to the dissolution of disturbed, possibly amorphous layers on the surface of the mineral ultimately exposing inner, undisturbed layers, accompanied by readsorption of complex hydroxy species back onto the surface of the mineral. Chuanyao and Yongxin[20] reported a value for the iep of hematite at 2.0.From this brief literature review it can be seen that the surface chemistry of naturally occurring iron oxide samples can be strongly influenced by the presence of impurities, primarily silica, and other physical pretreatments conducted on the samples.
3. Materials Examined
- Two samples of high grade iron ores from Iron Duke in the Middleback Range area were investigated in this study. These samples were received as lump ore from BHP Long Products Division, Whyalla, South Australia. According to Kirk[21], these represent end-members of material at the Iron Duke deposit. Sample # 1 was described as well bedded blue hematite, typically specular with well-defined bedding planes. The crystals are elongated parallel to the bedding planes and mechanical breakage was listed as ‘easy”. Sample # 2 is massive brown goethitic hematite, very hard and showing a good preservation of lump. Mechanical breakage was listed as “difficult”. X-ray Diffraction suggests that sample # 2 contained approximately 25 % goethite and 75 % hematite. Chemical analysis gave acid insolubles of 0.1 % for sample # 1 and 1.9 % for sample # 2 (for method of analysis see Section 4.1 below).The synthetic hematite sample of greater than 99 % purity was obtained from Merck Pty. Ltd. Chemical analysis gave less than 0.1 % acid insolubles.
4. Procedure
4.1. Characterisation of Minerals
- The Iron Duke samples were received as large, hand-picked lumps. They were crushed and pulverised in a ring mill until they were all finer than 150 µm prior to analysis and testing.Iron assays were determined using the method of Kolthoff et al[22] which involved digestion using stannous chloride and hydrochloric acid followed by titration with potassium permanganate solution. The amount of acid insolubles (primarily silica) was determined gravimetrically on the residue remaining by filtration and drying followed by combustion of the ashless filter paper after acid digestion.Specific Gravity (S.G.) was measured by displacement of nitrogen in a Quantachrome Stereopycnometer and the surface areas of the pulverised samples were measured using a Fisher Sub-sieve Sizer model 95 as per ASTM B330-88[23].
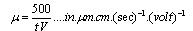
4.2. Measurement of Zeta Potential
- Suspensions of 1 g of hematite in 50 ml of distilled water, with the pH adjusted using dilute solutions of either hydrochloric acid or sodium hydroxide were centrifuged for 30 seconds at 2000 rpm. Substituting the centrifugal force acting in Stoke’s Law equation for free settling reveals that the largest hematite particle remaining in suspension after centrifuging was 1.5 μm, and the largest quartz particle was 2.3 μm. The supernatant liquid containing sub-micron particles was transferred to the flat cell of a Rank Bros. Microelectrophoresis Apparatus Mark II. Particles were timed in moving a distance of 50 μm under a known potential gradient that was chosen to give timings between 5 and 10 seconds. At least 10 separate particles were timed, followed by another 10 after the electrode polarity had been reversed. The average of the 20 timings was used in the calculation of mobility as given in equation (5). Zeta potentials were calculated from mobility data using the rationalised Smoluchowski equation which is applicable for this system. Under normal operating conditions, zeta potential (ζ) in mV is given by equation (6).
 | (6) |
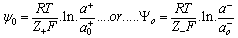
4.3. Measurement of Zero Point of Charge (zpc)
- The method of Mular and Roberts[12] was used to determine the values of zpc for the various hematite samples. Suspensions of 2 g of hematite in 50 ml of 10-2 M potassium nitrate (KNO3) (in distilled water) were prepared and the pH adjusted using either potassium hydroxide or nitric acid as required. Only one pH regulator was used, as ionic strength is an important consideration in this method. Increasing the concentration of the electrolyte will increase the magnitude of the surface charge through the corresponding compression of the double layer. Increasing the magnitude of the surface charge will cause a rearrangement of the surface ions except at the zpc. Effectively, the added cations and anions from the salt compete for sites in the electrical double layer occupied by H+ or . Protons and hydroxyl ions can be adsorbed or released resulting in a change in pH, which is measured. At the zpc, increasing the electrolyte concentration will have no effect on either the surface charge or the pH, hence the zpc can be identified by the pH where the change in surface charge is zero[24].
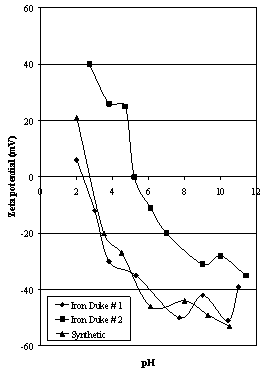 | Figure 1. Zeta potential characteristics of Iron Duke ores compared to synthetic hematite |
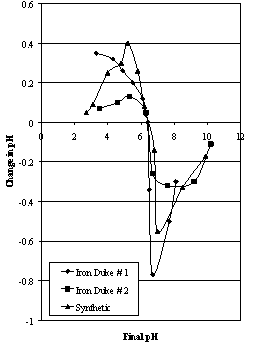 | Figure 2. Mular and Roberts plots for Iron Duke ores compared to synthetic hematite |
5. Results
- Some physical characteristics of pulverised hematite samples are given in Table 1.
6. Discussion
- The selection of two samples of relatively pure, naturally-occurring hematites from the same general area but containing different amounts of goethite should give an indication of the sensitivities of the various techniques used to study their surface properties in respect to changes in mineralogy. The inclusion of a synthetic A.R. grade sample in the suite should also highlight any differences between the two types of hematite.The zeta potential characteristics of the hematites investigated show a range of behaviour (see Figure 1). One method of comparison is to compare the values of the iep of the various samples (from Figure 1) to each other and to the values of zpc (from Figure 2). These are given in Table 2.
|
7. Conclusions
- Different samples of iron oxides exhibit different surface characteristics depending on such factors as mineralogy, colour, purity (and S.G.) and surface area. The natural hematite samples have similar mineralogical characteristics, being formed under similar processes. The hematite samples had high iron contents, but the iron content of sample # 2 was much lower suggesting different mineralogy.Surface chemistry was investigated using two techniques: microelectrophoresis and a modified form of potentiometric titration. These techniques allowed the determination of the isoelectric point and zero point of charge respectively. Isoelectric points for the samples examined showed a range of values due to the presence of fine silica and possible amorphous material, and, in the case of Iron Duke # 2, goethite in the ore strongly influencing the values of iep for the samples. Zero points of charge were identical for all the samples tested in this study.
ACKNOWLEDGEMENTS
- The author is grateful to BHP Long Products Division (now Onesteel), Whyalla for providing the Iron Duke samples investigated in this study.
References
| [1] | Kulkarni,R.D. and Somasundaran, P.,1976, Mineralogical Heterogeneity of Particles and its Effects on their Interfacial Characteristics, Powder Technology,14, 279-285. |
| [2] | Lyklema, J., 1975, cited in Yariv, S. and Cross, H., 1979, Geochemistry of Colloid Systems for Earth Scientists, Springer-Verlag, p.218. |
| [3] | Joy, A.S., Watson, D. and Cropton, R.W.G., 1964, Collector Adsorption and Surface Charge Density, Trans. AIME, 229, 5-7. |
| [4] | Smith G.W. and Salman, T., 1971, The Adsorption of Dehydroabietylamine Acetate on Mineral Oxides, Canadian Mining and Metallurgical Bulletin, 64(709), 70-75. |
| [5] | Mwaba, C.C., 1991, Surfactant-Enhanced Dewatering of Graphite and Hematite Suspensions, Minerals Engineering, 4(1), 49-62. |
| [6] | Pugh, R.J. and Lundstrom, H.,1987, The Surface Characterization and Flocculation of Hematite Fines, in “Flocculation in Biotechnology and Separation Systems” ed. Y. A. Attia, Elsevier, p. 673-694. |
| [7] | Joy, A.S. and Watson, D., 1963, Occurrence and Properties of Hematite Slimes, in “Mineral Processing” (Proceedings of the Sixth Mineral Processing Conference, Cannes, France) ed. A. Roberts, paper 24F, Pergamon Press, p 355-368. |
| [8] | Parks, G.A., 1965, The Isoelectric Points of Solid Oxides, Solid Hydroxides and Aqueous Hydroxo Complex Systems, Chemical Reviews, 65, 177-198. |
| [9] | Fuerstenau, D.W., 1970, Interfacial Processes in Mineral/Water Systems, Pure and Applied Chemistry, 24(1), 135-164. |
| [10] | Winer, A.A. and Wright, I.F., 1966, Practical Problems in Particle Size and Surface Area Measurements, J. Canadian Ceramic Society, 35, 68-75. |
| [11] | Smith, G.W. and Salman, T., 1966, Zero Point of Charge of Hematite and Zirconia, Canadian Metallurgical Quarterly, 5(2), 93-97. |
| [12] | Mular, A.L. and Roberts, R.B., 1966, A Simplified Method to Determine Isoelectric Points of Oxides, Canadian Mining and Metallurgical Bulletin 59(655), 1329-1330. |
| [13] | Montes, S., Atenas, G.M. and Valero, E., 2007, How fine Particles on Haematite Mineral Ultimately Define the Mineral Surface Charge and Overall Floatability Behaviour, Journal of the Southern African Institute of Mining and Metallurgy, 107, 689-695. |
| [14] | Kosmulski, M., 2001, Chemical Properties of Material Surfaces, Marcell Dekker, New York. |
| [15] | Kosmulski, M., Maczka, E., Jartych, E. and Rosenholm, J.B., 2003, Synthesis and Characterisation of Goethite and Goethite-Hematite Composite: Experimental Study and Literature Survey, Advances in Colloid and Interface Science, 103 57-76. |
| [16] | Madigan, C., Leong, Y.K. and Ong, B.C., 2009, Surface and Rheological Properties of as-received Colloidal Goethite (α-FeOOH) suspensions: pH and Polyethylenimine Effects, International Journal of Mineral Processing, 93, 41-47. |
| [17] | Ramos, A.C.H. and McBride, M.B., 1996, Goethite Dispersibility in Solutions of Variable Ionic Strength and Soluble Organic Matter Content, Clays and Clay Minerals, 44 (2), 286-296. |
| [18] | Carlson, J.J. and Kawatra, S.K., 2011, Effects of CO2 on the Zeta Potential of Hematite, International Journal of Mineral Processing, 98, 8-14. |
| [19] | Smith, R.W. and Trivedi, N., 1974, Variation of Point of Zero Charge of Oxide Minerals as a Function of Ageing Time in Water, Trans. AIME, 255, 69-74. |
| [20] | Chuanyao, S. and Yongxin, L., 1992, Effect of Trace Elements Occurring on Mineral Surface on Floatability. Part 11: Effect of Surface Characteristics of Aegirine and Hematite on their Floatability, in “Proceedings of the First International Conference on Modern Process Mineralogy and Mineral Dressing”, International Academic Publishers, 213-218. |
| [21] | Kirk, G. (1999), Mining Geologist, Iron Duke mine, personal communication to the author. |
| [22] | Kolthoff, I.M., Sandell, E.B., Meehan, E.J. and Bruckenstein, S., 1969, Quantitative Chemical Analysis, 4th. Ed., Macmillan, New York, p. 832-834. |
| [23] | ASTM B330-88, 1988, Standard Test Method for Average Particle Size of Powders of Refractory Metals and their Compounds by the Fisher Sub-Sieve Sizer, 3p. |
| [24] | Woods, R., 1990, The Electrical Double Layer Properties of Oxides, M. App. Sc. Thesis, S.A. Institute of Technology, 199 p. |
| [25] | Termes, S.C. and Wilfong, R.L., 1985, Flocculation of Metal Oxide and Hydroxide Minerals with Cross-linked Starches Containing Chelating Groups, U.S. Bureau of Mines Report of Investigations No. 8944, 17p. |
| [26] | Nebo, C.O., Nwajiobi, H., Aneke, N.A.G. and Fuerstenau, M.C.,1996, A Study of the Flocculation of Pure Goethite, Quartz and Kaolinite and the Selective Flocculation of Agbaja Iron Ore. Part 1.Adsorption of Cassava Starch on Pure Goethite, Quartz and Kaolinite, Journal of Dispersion Science and Technology, 17 (1), 1-12. |
| [27] | Schuylenborgh, J v. and Sanger, A.M.H., 1949, The Electrokinetic Behaviour of Iron- and Aluminium-Hydroxides and Oxides ,Recueil des Travaux Chimiques, 68, 999-1010. |
| [28] | Quast, K., 2006, Flotation of Hematite using C6-C18 Saturated Fatty Acids, Minerals Engineering, 19, 582-597. |
| [29] | Gibb, A.W.M. and Koopal, L.K. 1990, Electrochemistry of a Model for Patchwise Heterogeneous Surfaces, J. Colloid and Interface Science, 134(1), 122-138. |
| [30] | Sadowski, Z. and Laskowski, J., 1980, Hindered Settling-a New Method of the iep Determination of Minerals, Colloids and Surfaces, 1, 151-159. |
| [31] | Kanungo, S.B. and Mahapatra, D.M., 1989, Interfacial Properties of Two Hydrous Iron Oxides in KNO3 Solution, Colloids and Surfaces, 42, p. 173-189. |
| [32] | Appel, C., Ma, L.Q., Rhue, R.D. and Kennelley, E., 2003, Point of Zero Charge Determination in soils and Minerals via Traditional Methods and Detection of Electroaccoustic Mobility, Geoderma, 113, 77-93. |
| [33] | Hurlbut, C.S., Jr., 1959, Dana’s Manual of Mineralogy, 17 th edition, Wiley, New York, p. 602. |