-
Paper Information
- Next Paper
- Previous Paper
- Paper Submission
-
Journal Information
- About This Journal
- Editorial Board
- Current Issue
- Archive
- Author Guidelines
- Contact Us
International Journal of Mining Engineering and Mineral Processing
2012; 1(2): 47-55
doi: 10.5923/j.mining.20120102.05
Effects of Pretreatments on the Zeta Potential Characteristics of a Hematite Ore
 Abstract
 Reference
 Full-Text PDF
 Full-Text HTML
Keith Quast
Ian Wark Research Institute, University of South Australia, Mawson Lakes, 5095 Australia
Correspondence to: Keith Quast , Ian Wark Research Institute, University of South Australia, Mawson Lakes, 5095 Australia.
| Email: |  |
Copyright © 2012 Scientific & Academic Publishing. All Rights Reserved.
The effects of pretreatments on the zeta potential characteristics of hematite were investigated on a number of hematite samples. The bulk of the test work was conducted on a sample of naturally occurring hematite from the Iron Prince deposit in the Middleback Range area of South Australia. The iep of the ROM ore was measured as 2.6, which was only slightly raised by ultrasonic cleaning. When the ore was contacted with dilute acid over a prolonged period the iep was raised to 6.7, the value commonly quoted for natural hematites. Contact of the hematite ore with HCl solutions for only 1 hour did not increase the iep to this value. Removing the slimes from the ore gave an iep value of 3.5, which was only slightly raised with contact with HCl. The value of 3.5 may be close to the true value of the iep for this ore. Slimes removed from the ore plus assay residue where the iron has been removed gave iep values typical for silica. The iep for a high grade hematite sample from Iron Knob was 5.3 and this was not changed by contact with HCl. Washing the Iron Prince ore with NaOH and HCl followed by NaOH had little influence on the iep of the ore, and still reflected the presence of silica. The iep of freshly precipitated ferrihydrate was 7.5, typical of values obtained for synthetic hematites. The zeta potential characteristics of silica activated by ferric ions gave similar characteristics to that of the acid washed hematite ore. This suggests that the major species under test in the microelectrophoresis cell after prolonged acid washing of the hematite ore is in fact ferric-activated silica from the fine particles removed by centrifugation prior to testing since it is known that the silica is concentrated in the fine fractions of the hematite ore. This finding is further complicated by the fact that both ferrihydrate and AR ferric oxide have iep values in a similar range. These three species could co-exist under the conditions of the microelectrophoresis testing.
Keywords: Pretreatments, Zeta Potential, Hematite
Article Outline
1. Introduction
- Some effects of pretreatments on the zeta potential of a naturally occurring hematite ore from the Iron Prince deposit in the Middleback Ranges area of South Australia have been investigated. This can be viewed as an extension of the effects of pretreatments on the surface characteristics of a natural magnetite sample from Savage River in Tasmania reported by Kolarik et al[1] who investigated the effects of water, acid and alkali washing. The effects of the pretreatments were determined using microelectrophoresis and showed that the effects of colloidal and adsorbed silicate species can be reversed by various acid/alkali washing procedures. Added aqueous silicate species lowered the isoelectric point to values consistent with hydrous silicate coatings.Before discussing this paper and technique in detail, a brief introduction to the measurement of zeta potential is given below.Surface characteristics can be investigated using electrokinetic phenomena, which involve the interrelation between electrical and mechanical effects at a moving interface. The electrokinetic results obtained are usually expressed in terms of the electrophoretic mobility (μ) which is the ratio of the velocity of a particle in an aqueous environment to the applied potential gradient. In the electrophoretic mobility (μ) data generated by the current author, the timing of particles (t seconds) over one graticle square (50 μm) under a known voltage (V volts) being applied over the effective length of the cell, (10 cm.) is given by equation (1):
 | (1) |
 | (2) |
2. Materials and Reagents
- The majority of the test work was conducted on a sample of naturally occurring massive hematite from Iron Prince, near Whyalla in South Australia. The main impurities in this material are silica and alumina. The iron content of this sample was 69.0% corresponding to 98.5% Fe2O3 using the titration method reported by Kolthoff et al[6]. Basically this method involves digestion using HCl and stannous chloride to convert all the iron to the ferrous form. The ferrous solution was diluted and cooled, then filtered on ashless filter paper to remove all insoluble impurities. The filtrate was titrated against standard potassium permanganate to determine the amount of iron. The ashless filter paper is dried and ignited to generate an insoluble assay residue which was also used to study its zeta potential characteristics. Prior to testing, assay residues were rewashed with stannous chloride, fumed with concentrated sulphuric acid, filtered and dried. Using microprobe analysis, there were no traces of iron detected in this sample, so it represents the clean gangue present in the ore.The sample was received as coarse lumps (all passing 16 mm), which were crushed, then pulverised in a Tema Labor-Scheibenschingmuhle driven at 1000 rpm. A sample of pulverised material passing 150 μm was screened from the bulk sample for testing by microelectrophoresis. This sample had a surface area of 0.15 m2/g as determined using a Fisher Subsieve Sizer Model 95. The density was 5160 kg/m3 as measured using a pycnometer. Scanning Electron Microscopic analysis using Energy Dispersive X-Ray analysis (EDX) showed a crystalline structure with a minor amount of quartz and traces of complex silicates. A sample of pulverised hematite was elutriated using a Warman Cyclosizer to generate a -7 μm fraction which contained 14% silica. Coarser fractions generally contained 1.5 – 2.0 % silica, showing that the silica was concentrated in the very fine fraction. A sample of pulverised hematite was also deslimed by repeated washing and decantation of slimes to produce a sample of deslimed hematite only containing 0.2% silica. No silica could be detected by EDX.Other samples tested included a sample of Iron Prince ore repeatedly washed with water to remove all the ultrafine material. This sample contained only 0.2% silica with a surface area of 0.058 m2/g. A purer hematite sample was obtained from Iron Knob, also in the Middleback Range area of South Australia. This was also received as large lumps that were crushed and pulverised to a surface area of 0.136 m2/g. This sample assayed 69.5% Fe and 0.3% SiO2. The pulverised Iron Knob hematite showed a specular lustre and was deep purple to black in colour compared to the red-brown colour of the pulverised Iron Prince sample. A sample of AR Grade ferric oxide was also used for comparison. It was made by J.T. Baker and contained <0.1% acid insoluble material. The density of this sample was 5220 kg/m3. A sample of silica flint obtained from Rodda Minerals was used as a sample of silica. This was guaranteed to contain a minimum of 98% SiO2, had a surface area of 0.247 m2/g and contained less that 0.02% Fe. The particles were all finer than 50 μm. The water used had been demineralised using a mixed bed unit followed by distillation using a glass still. Conductivity values were less than 0.2 mS/m. Ferric hydroxide was prepared by neutralising a solution of 10 -2 molar FeCl3 with NaOH to pH 7. The ferrihydrate precipitate was allowed to settle and the clear supernatant solution was decanted. The precipitated was then washed with distilled water and stored as a suspension for use in subsequent test work. Fresh precipitates were made on each day of use.
3. Experimental Procedure
3.1. Measurement of Zeta Potential
- The suspensions of 1 g of hematite in 50 ml of distilled water, with the pH adjusted using dilute solutions of either hydrochloric acid or sodium hydroxide were centrifuged for 30 seconds at 2000 rpm. Substituting the centrifugal force acting in Stoke’s Law equation for free settling reveals that the largest hematite particle remaining in suspension after centrifuging was 1.5 μm, and the largest quartz particle was 2.3 μm. The supernatant liquid containing sub-micron particles was transferred to the flat cell of a Rank Bros. Microelectrophoresis Apparatus Mark II. Particles were timed in moving a distance of 50 μm under a known potential gradient which was chosen to give timings between 5 and 10 seconds. At least 10 separate particles were timed, followed by another 10 after the electrode polarity had been reversed. The average of the 20 timings was used in the calculation of mobility as given in equation (2). Zeta potentials were calculated from mobility data using the rationalised Smoluchowski equation which is applicable for this system. Under normal operating conditions, zeta potential (ζ) in mV is given by equation (3).
 | (3) |
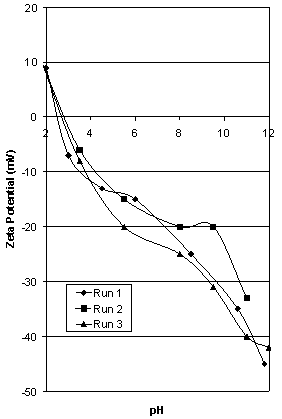 | Figure 1. Zeta potential characteristics of 3 samples of Iron Prince hematite |
3.2. Ultrasonic Treatment
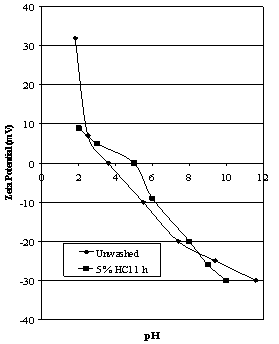
- A sample of the -150 μm fraction from the Iron Prince ore was ultrasonically dispersed at 22 kHz in distilled water for one hour. Another sample which had been soaked in distilled water for the same time was used as a comparison. Results are given in Figure 2.
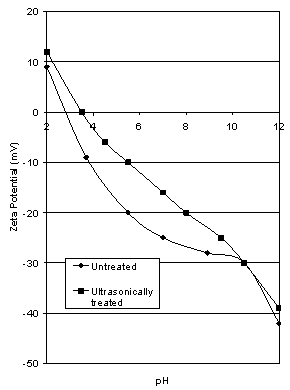 | Figure 2. Effect of Ultrasonic treatment on the zeta potential characteristics of Iron Prince ore |
3.3. Treatment with HCl
- A sample of the -150 μm Iron Prince ore was soaked in dilute HCl for one day prior to electrophoresis testing. The sample was then washed with water and the results of the subsequent zeta potential determinations as a function of pH are shown in Figure 3. This effect was further examined by soaking hematite samples in 5% and 10% HCl for 1 hour with intermittent agitation, washed thoroughly with distilled water, then tested by electrophoresis. As a control, a sample of hematite ore in distilled water underwent identical treatment except it was not contacted with HCl. These results are also shown in Figure 3. The amount of iron in solution at the end of the 1 hour treatments was determined using atomic absorption spectrophotometry. These results are shown in Table 1.
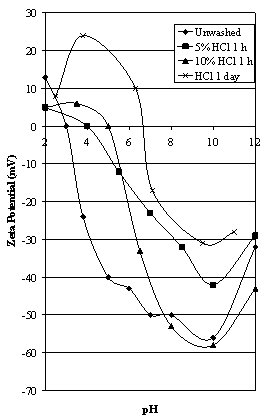 | Figure 3. Effect of acid washing on the zeta potential of Iron Prince ore |
 | Figure 4. Effect of acid washing on the zeta potential of deslimed Iron Prince ore |
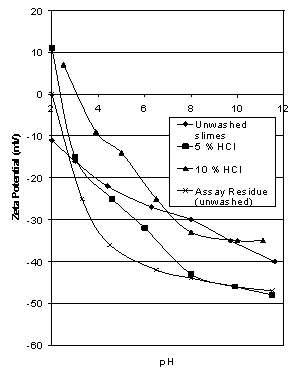 | Figure 5. Effect of acid washing on the zeta potential of Iron Prince slimes compared to unwashed assay residue |
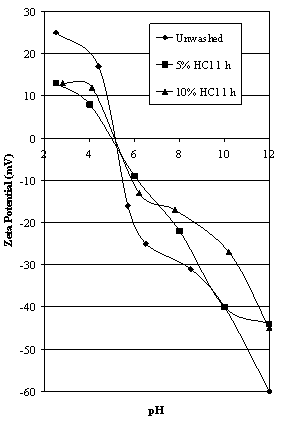 | Figure 6. Effect of acid washing on the zeta potential of Iron Knob hematite |
3.4. Treatment with NaOH
- Samples of hematite ore were soaked in 0.1M and 1M solutions of NaOH for 1 hour, thoroughly washed, then tested. Results are shown in Figure 7.
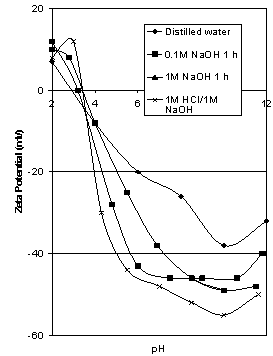 | Figure 7. Effect of NaOH and HCl/NaOH on zeta potential of Iron Prince hematite |
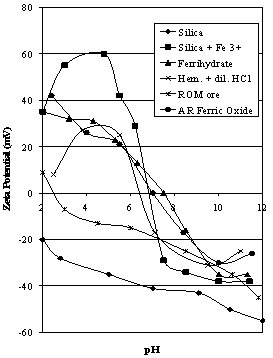 | Figure 8. Comparison of zeta potential characteristics for silica flint, Ferrihydrate,, AR ferric oxide and acid washed Iron Prince ore compared to ROM ore |
3.5 Comparison Plots
- To determine the interactions between ferric ions and silica, the zeta potential characteristics of 1g of silica flint in 50 ml of 10 -3 M ferric chloride were measured.Zeta potential data for hematite ore, silica flint, silica flint contacted with FeCl3, hematite ore soaked in dilute HCl for 1 day and freshly precipitated FeCl3 compared to ROM Iron Prince ore are shown in Figure 8. All measured values of isoelectric points (iep) are shown in Table 2 for comparison.
4. Results and discussion
- A summary of isoelectric points for the various samples measured in this study are given in Table 2.
4.1. Untreated Iron Prince ore
|
4.2. Ultrasonic Treatment
- When the sample was ultrasonically cleaned (see Figure 2), the iep only rose from 2.8 to 3.5 showing that surface coating plays only a minor role in the modification of the observed zeta potential characteristics of the ore. Visual examination of the supernatant liquid for each case showed a much higher concentration of dispersed orange slimes in the ultrasonically treated sample. The impurities causing the observed iep of the sample to be low are strongly adherent or inherent in the sample, not merely a surface or slime coating which can easily be removed.
4.3. Treatment with HCl
- The effects of contacting the hematite ore with HCl are shown in Figure 3. Soaking the ore in dilute HCl for 1 day prior to washing thoroughly with distilled water and testing returned an iep value of 6.7, the value most often quoted for the “pure” hematite surface. Contacting the ore with 5% and 10% HCl for 1 hour prior to washing with distilled water and testing returned iep values of 4.0 and 5.0 respectively. Concentrations of soluble iron in solution are given in Table 1 showing the increase in iron with increased acid strength. This indicates that hematite dissolves in strongly acid solutions. As a comparison, a hematite solubility of 82 mg/L after 30 minutes at pH 2 – 3.5 has been reported by Polkin[11].A number of other workers washed hematite samples with dilute HCl prior to electrophoresis testing (e.g. Johansen and Buchanan ([12 and[13], Smith et al[14] and Shergold and Kitchener[15]. This is usually reported as a method of “cleaning” the hematite surface. Kolarik et al[1] noted that acid washing of their sample of magnetite with HCl for 30 minutes for 1 hour resulted in a small upward shift in iep (from 4.4 to 5.8). This was thought due to partial dissolution of surface contaminants and perhaps redox-hydrolysis of the magnetite itself.The effects of HCl pretreatment on the zeta potential characteristics of the hematite ore can be interpreted in several ways. A simplistic explanation is that the HCl cleans up the mineral surfaces in some way to eliminate impurities. Ferric ions would be released into solution when hematite is contacted with an acid (see Table 1). Fuerstenau and Palmer[16] have reported a species concentration vs. pH diagram for 1 x 10 -4 molar ferric chloride and shows that solid ferric hydroxide (commonly known as ferrihydrate) is the stable phase at pH greater than 3. Hence after raising the pH of the hematite ore after contact with HCl, any ferric ions will precipitate as ferrihydrate. The zeta potential characteristics of ferrihydrate will be discussed later (see Figure 8) but gave a value of iep of 7.5.
4.4. Effect of Desliming and Acid Washing
- When the orange slimes are removed from the hematite ore by repeated washing and decantation, the concentration of silica had been reduced to 0.2%. This caused the iep to increase to 3.5 with a high positive zeta potential at pH 1.8 (see Figure 4). Washing this sample with 5% HCl for 1 hour only increased the iep to 5.0, suggesting that the “true” iep value for the hematite is around this value since no silica could be detected using microprobe analysis attached to a Scanning Electron Microscope. Repeated washing during the desliming procedure should have removed any fine silica and slime loosely bound to the surface of the ore, thus any ferric ions released during contact with HCl should precipitate on the hematite surface. The low silica concentration of 0.2% is probably due to that inherent in the mineral matrix. The difference in initial surface areas between the hematite ore (0.15 m2/g) and deslimed hematite (0.058 m2/g) may have had some influence on the resulting curves but, as reported in the Experimental Procedure, all the coarse material is removed prior to testing. Values of iep for naturally occurring hematites are often in the range 3.5 to 5.0 (e.g. Joy and Watson[17], Johansen and Buchanan[12], Shergold and Mellgren[18], Subramanian and Natarajan[19], Mwaba[20], Das and Naik[21] and dos Santos and Oliveira[22]).Pugh and Lundstrom[23] used surface chemical techniques to characterise hematite fines. They identified two distinct types of hematite particles, a black, “coarser crystallite” fraction coarser than 5 μm and a red “colloidal” fraction of approximately 1 μm in size. Using ESCA it was postulated that the red hematite particles were more hydroxylated than the black hematite, possibly due to the smaller particles having freshly formed stressed surfaces with higher surface energy which is more easily hydrated on dispersing in water. The iep of the colloidal red hematite measured using microelectrophoresis was 3, but the zpc using potentiometric titration was 6.3. This effect is examined in another paper by the author[24].Montes et al[25] examined the differences in surface chemical behaviour between two size ranges of hematite, particles less than 10 μm and those coarser than 10 μm. The Fe2O3 contents were 86.6% and 91.1% respectively. The zeta potentials for the fine particles were determined using electrophoresis and the coarser particles were examined using streaming potential. The isoelectric point for the fine particles was determined as 3.3 and for the coarse particles it was 6.0. The lower value was explained by the presence of quartz. This is consistent with the data reported in this paper.
4.5. Results for Hematite Slimes and Assay Residue
- The – 7 μm slime fraction which was the fines discharge from the Cyclosizer was thoroughly washed with distilled water to remove any contamination from using Adelaide tap water prior to testing. From Figure 5, no value of the iep could be determined since it would be less than 2.0. Washing these slimes with 5% and 10% HCl for 1 hour caused the iep to shift to 2.4 and 3.1 respectively (see Figure 5). Although there is a gradual increase in iep with increasing HCl concentration, the values are still within the range of values reported for natural silica. The zeta potential characteristics for the assay residue are easily recognised as very typical for silica and probably represent the true zeta potential of the silica associated with the Iron Prince ore.
4.6. Iron Knob Hematite
- The zeta potential characteristics of a sample of high purity Iron Knob hematite are shown in Figure 6. Washing with 5% and 10% HCl had no effect on the iep probably due to the absence of significant silica. The measured value of 5.3 is very close to the acid washed and deslimed sample of Iron Prince hematite (see Table 2). Since the amount of silica present in the Iron Knob sample is very low (0.3%) it would not react with any ferric ions released during the HCl pretreatment, hence there was no change in the value of iep. The decrease in positive zeta potential on the acid side of the iep as a result of washing the ore with HCl could well be an indication of specific chloride ion adsorption as suggested by Somasundaran[26].
4.7. Treatment with NaOH
- From well known solution equilibria for both the hematite and quartz aqueous systems, the solubility of both minerals increases with high pH. Hence the surfaces of hematite and any surface silica may be modified by dissolution of either mineral at high pH. As shown in Figure 7, there was only a slight shift in iep of 0.6 units as a result of washing the ore with NaOH. When magnetite was washed with 1 M NaOH, Kolarik et al[1] found that the iep increased from 4.4 to 6.8. For 10% HCl followed by 0.1 M NaOH, the iep of the magnetite was 5.1. The effect of the alkali washing was to remove residual siliceous material from the magnetite surface. The aqueous solubility of silica is known to increase above pH 10, and it is less likely that the dissolved silicates would redeposit on a negative magnetite surface present during alkali washing than on positive surfaces during acid washing. The combination of acid plus alkali washing yielded a value of iep very similar to those obtained on “clean” magnetite surfaces, suggesting that this treatment removed the surface contaminants.Returning to Figure 7, even a combination of acid washing plus alkali washing, the procedure reported by Kolarik et al[1] to produce the cleanest surface that allowed the true surface properties to be revealed, still did not produce a significantly higher value of iep for the Iron Prince hematite, even though these results were confirmed by duplicate testing. The effect of the HCl pretreatment appears to be nullified by the subsequent contact with NaOH and the resulting data closely resembles that obtained by NaOH only. On the basis of these data, it appears that after NaOH and HCl/NaOH treatments the species under test is still silica, even though the slight increase in iep could indicate a slight modification. Alternatively, if any silica is dissolved by the NaOH pretreatment it is reprecipitated on the ore during washing, when the pH is lowered. All the iep values shown in Figure 7 are within the range observed for natural silica (Parks[7].
4.8. Ferrihydrate and Ferric-Activated Silica
- From the discussion reported above, ferrihydrate is the stable species once the pH of a solution of soluble ferric ions has been raised above 3. The zeta potential of ferrihydrate is shown in Figure 8, returning a value of 7.5 for the iep, very similar to the value of 7.8 reported by Pyman et al[27] using a salt addition method. The value shown in Figure 8 is slightly higher than that commonly reported for natural hematites, closer to that for synthetic hematites (Parks,[7]. The zeta potential characteristics for quartz in the presence of ferric ion has been studied by Mackenzie[28] and Critchley and Jewitt[29]. Mackenzie[28] found that for concentrations of ferric chloride above 5.7 x 10 -5 molar, the iep of quartz was approximately 7.5. (The concentration of soluble iron after acid washing is many times this value (see Table 1)). This is the iep determined for freshly precipitated ferrihydrate in the absence of quartz as shown in Figure 8. It is also close to the value of iep measured on a sample of AR Ferric oxide at 7.0. Mackenzie also concluded that at low pH values, ferric ions are adsorbed on quartz; at pH values between 4 and 6 ions such as Fe(OH)2+ are adsorbed, and above pH 6, ferric hydroxide is adsorbed. To determine whether the interaction between ferric ions or ferrihydrate and quartz could produce a zeta potential curve similar to the one measured on the hematite contacted with dilute HCl for 1 day; these data were plotted on Figure 8. The similarity between the two curves is obvious. This means that there is a strong possibility that after prolonged HCl pretreatment on the hematite ore, the species under test in the microelectrophoresis cell is in fact ferric activated silica. The curve for the untreated silica is also shown in Figure 8, showing the major change in zeta potential characteristics of quartz in the presence of ferric ions. There is also the complication in that the iep of a sample of AR ferric oxide is 7.0. This means that it might be difficult to distinguish the zeta potential characteristics of ferric-activated quartz from those of a pure hematite that should not contain any quartz.
5. Conclusions
- The bulk of the test work was conducted on a sample of naturally occurring hematite from the Iron Prince deposit in the Middleback Range area of South Australia. The iep of the ROM ore was measured as 2.6, which was only slightly raised by ultrasonic cleaning. When the ore was contacted with dilute acid over a prolonged period the iep was raised to 6.7, the value commonly quoted for natural hematites. Contact of the hematite ore with HCl solutions for only 1 hour did not increase the iep to this value. Removing the slimes from the ore gave an iep value of 3.5, which was only slightly raised with contact with HCl. The value of 3.5 may be close to the true value of the iep for this ore. Slimes removed from the ore plus assay residue where the iron has been removed gave iep values typical for silica. The iep for a high grade hematite sample from Iron Knob was 5.3 and this was not changed by contact with HCl. Washing the Iron Prince ore with NaOH and HCl followed by NaOH had little influence on the iep of the ore, and still reflected the presence of silica. The iep of freshly precipitated ferrihydrate was 7.5, typical of values obtained for synthetic hematites. The zeta potential characteristics of silica activated by ferric ions gave similar characteristics to that of the acid washed hematite ore. This suggests that the major species under test in the microelectrophoresis cell after prolonged acid washing of the hematite ore is in fact ferric-activated silica from the fine particles removed by centrifugation prior to testing since it is known that the silica is concentrated in the fine fractions of the hematite ore. This finding is further complicated by the fact that both ferrihydrate and AR ferric oxide have iep values in a similar range. These three species could co-exist under the conditions of the microelectrophoresis testing.
ACKNOWLEDGEMENTS
- The writer is grateful to BHP Long Products Division (now OneSteel) for providing the samples of Iron Prince and Iron Knob hematite used in this study.
References
| [1] | Kolarik,L.O., Dixon, D.R., Freeman, P.A., Furlong, D.N. and Healy, T.W., 1980, Effects of Pretreatments on the Surface Characteristics of a Natural Magnetite, Chapter 34 in “Fine Particles Processing”, (Proceedings of the International Symposium on Fine Particles Processing), ed. P. Somasundaran, Society of Mining Engineers of AIME, pp. 652-665. |
| [2] | Iwasaki, I, Cooke, S.R.B. and Kim, Y.S., 1962, Some Surface Properties and Flotation Characteristics of Magnetite, Transactions of AIME, 223, pp. 113-120. |
| [3] | Ahmed, S.M. and Maksimov, D., 1968, Studies of the Oxide Surface sat the Liquid-Solid Interface Part II Fe Oxides, Canadian Journal of Chemistry, 46, pp.3841-3846. |
| [4] | Tewari, P.H. and McLean, A.W., 1972, Temperature Dependence of Point of Zero Charge of Alumina and Magnetite, Journal of Colloid and Interface Science, 40, pp. 267-272. |
| [5] | Rao, K.H., Samskog, P.O and Forssberg, K.S.E., 1990, PulpChemistry of Flotation of Phosphate Gangue from Magnetite Fines, Transactions of the Institute of Mining and Metallurgy, 99, pp. C147-C156. |
| [6] | Kolthoff, I.M., Sandell, E.B., Meehan, E.J. and Bruckenstein, S., 1969, Quantitative Chemical Analysis, 4th edition, Macmillan, pp. 832-834. |
| [7] | Parks G.A., 1965, The Isoelectric Points of Solid Oxides, Solid Hydroxides and Aqueous Hydroxo Systems, Chemical Reviews, 65, pp. 177-198. |
| [8] | Yin, W, Yang, X., Zhou, D.and Li, Z., 2011, Shear Hydrophobic Flocculation and Flotation of Ultrafine Anshan Hematite using Sodium Oleate, Transactions of the Nonferrous Metallurgical Society of China, 21, pp. 652-664. |
| [9] | Kulkarni,R.D. and Somasundaran, P.,1976, Mineralogical Heterogeneity of Ore Particles and its Effects on their Interfacial Characteristics, Powder Technology,14, p. 279-285. |
| [10] | Lyklema, J., 1975, cited in Yariv, S. and Cross, H., 1979, Geochemistry of Colloid Systems for Earth Scientists, Springer-Verlag, p.218. |
| [11] | Polkin, S.I., 1960, Proceedings of the 1960 International Mineral Processing Congress, London, p. 503. |
| [12] | Johansen, P.G. and Buchanan, A.S., 1957, An Electrokinetic Study by the Streaming Potential Method of Ion Exchange at Oxide Mineral Surfaces, Australian Journal of Chemistry, 10 (4), pp. 392-397. |
| [13] | Johansen, P.G. and Buchanan, A.S., 1957, An Application of the Microelectrophoresis Method of the Study of the Surface Properties of Insoluble Oxides, Australian Journal of Chemistry, 10 (4), pp. 398-403. |
| [14] | Smith, R.W., Haddenham, R., and Schroeder, C., 1973, Amphoteric Surfactants as Flotation Collectors, Transactions of Society of Mining Engineers of AIME, 254, pp. 231-235. |
| [15] | Shergold, H.L. and Kitchener, J.A., 1975, A Surface-Chemical Study of Adsorption of Flotation Collectors on a Swedish Hematite, International Journal of Mineral Processing, 2, pp. 249-265. |
| [16] | Fuerstenau, M.C. and Palmer, B.R., Anionic Flotation of Oxides and Silicates, in “Flotation”, (A.M. Gaudin Memorial Flotation Symposium), American Institute of Mining Engineers, pp. 148-196. |
| [17] | Joy, A.S. and Watson, D., 1963, Occurrence and Properties of Haematite Slimes, in “Mineral Processing”, (Proceedings of the Sixth International Mineral Processing Congress), ed. A Roberts, paper 24F, Pergamon Press, pp. 355-368. |
| [18] | Shergold, H.L. and Mellgren, O, 1969, Concentration of Minerals at the Oil-Water Interface: Hematite-Iso Octane-Water System in the Presence of Sodium Dodecyl Sulphate, Transactions of the Institution of Mining and Metallurgy, 78, pp. C121-C132. |
| [19] | Subramanian, S. and Natarajan, K.A., 1989, Adsorption Behaviour of an Oxidised Starch onto Haematite in the Presence of Calcium, Minerals Engineering, 2 (1), pp. 55-64. |
| [20] | Mwaba, C.C., 1991, Surfactant-Enhanced Dewatering of Graphite and Hematite Suspensions, Minerals Engineering, 4 (1), pp. 49-62. |
| [21] | Das, B. and Naik, P.K., 2003, Electrokinetic and Flotation Studies of Hematite using di(2-ethyl hexyl) Phosphoric Acid, J. South African Institute of Mining and Metallurgy, 103, July/August, p. 397-401. |
| [22] | Dos Santos, I.D. and Oliveira, J.F., 2007, Utilization of Humic Acid as a Depressant for Hematite in the Reverse Flotation of Iron Ore, Minerals Engineering, 20, pp. 1003-1007. |
| [23] | Dos Santos, I.D. and Oliveira, J.F., 2007, Utilization of Humic Acid as a Depressant for Hematite in the Reverse Flotation of Iron Ore, Minerals Engineering, 20, pp. 1003-1007. |
| [24] | Quast, K.B., 2012, Some Surface Characteristics of Six Hematite ores from the Middleback Range Area, South Australia, paper submitted to International Journal of Mining Engineering and Mineral Processing. |
| [25] | Montes, S., Atenas, G.M. and Valero, E., 2007, How fine Particles on Haematite Mineral Ultimately Define the Mineral Surface Charge and Overall Floatability Behaviour, Journal of the Southern African Institute of Mining and Metallurgy, 107, p. 689-695. |
| [26] | Somasundaran, P., 1970, Pretreatment of Mineral Surfaces and its Effect on their Properties, in “Clean Surfaces: their Preparation and Characterisation for Interfacial Studies, ed. G. Goldfinger, Marcel Dekker, pp. 285-306. |
| [27] | Pyman,M.A.F, Bowden, J.W. and Posner, A.M., 1979, The point of zero charge of amorphous coprecipitates of silica with hydrous aluminium or ferric hydroxide, Clay Minerals, 14, pp. 87-92. |
| [28] | Mackenzie, J.M.W., 1966, Zeta Potential of Quartz in the Presence of Ferric Ion, Transactions of the Society of Mining Engineers of AIME, 235, pp. 82-88. |
| [29] | Critchley, J.K. and Jewitt, S.R., 1979, Effect of Cu (II) ions on Zeta Potential of Quartz, Transactions of the Institution of Mining and Metallurgy, 88, pp. C57-C59. |