Neymayer P. Lima 1, Antonio E. C. Peres 2, Michelle L. S. Marques 1
1Iron Ore Planning Department, VALE, Belo Horizonte, 31420-000, Brazil
2Department of Metallurgical and Materials Engineering, Universidade Federal de Minas Gerais, Belo Horizonte, 31270-901, Brazil
Correspondence to: Antonio E. C. Peres , Department of Metallurgical and Materials Engineering, Universidade Federal de Minas Gerais, Belo Horizonte, 31270-901, Brazil.
| Email: |  |
Copyright © 2012 Scientific & Academic Publishing. All Rights Reserved.
Abstract
The presence of slimes is, in general, harmful to the flotation of iron ores, affecting the selectivity and the quality of the concentrates, besides causing an increase in reagents consumption. This work describes the behavior of different iron ore types from the Iron Quadrangle, Brazil, with respect to desliming in hydrocyclones and flotation, including a study on the dispersion degree as a function of pH. Flotation experiments were performed at different slimes contents (designated as by-pass) aiming at assessing the influence of this variable on the selectivity. The different ore types present differences in chemical and mineralogical composition and also in size distribution. The content of slimes not removed in the desliming stage (by-pass) affects differently the selectivity of each ore type. Some ores keep the selectivity constant for all levels of by-pass, but present a reduction in phosphorus grade in the concentrate for reduced by-pass levels. Other types respond to the reduction of by-pass with increased selectivity. As a general rule, by-pass levels lower than 4% lead to a stable behavior concerning selectivity, yielding low phosphorus content in the concentrate. The behavior of each ore type is related to the chemical and mineralogical composition and size distribution of the slimes and also to the dispersion degree of the ore. Preliminary tests indicated that the specific surface area of samples with different by pass levels can explain the flotation behavior.
Keywords:
Flotation, Iron Ores, Slimes, Specific Surface Area
1. Introduction
This paper describes the way diverse iron ore types behave during desliming and flotation stages. According to Clemer[1], desliming prior to the reverse cationic flotation of iron ores started with the USBM process. Araujo et al.[2] stated that efficient desliming requires an adequate dispersion degree of the particles in the pulp. The dispersion degree is strongly affected by the slurry pH.The presence of slimes in a flotation feed may be quantified by the pass (the by-pass represents the fine particles that follow the water flow in a classification process, in a way that they may be considered as incorporated to the fluid)Queiroz at al.[3] observed that for certain itabirite ores attrition increases the mass recovery to the slimes and flotation concentrate fractions enhancing the selectivity.The main goal of the investigation was evaluating how different slimes contents (by-pass) affect the flotation behavior of different iron ore types.
2. Methodology
Channel sampling on the bench face was utilized. The samples preparation flow sheet is illustrated in figure 1.The –150µm fraction of each ore type was employed in the experiments.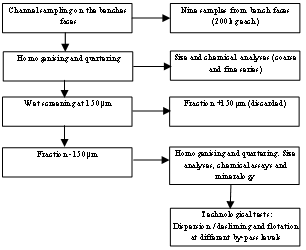 | Figure 1. Samples preparation and processing flow sheet |
The thermodynamic stability level of the suspensions was assessed via the determination of the slimes dispersion degree in a sedimentation tube (2.5% solids in 500mL volume), described by Peres and Silva[4] and Martins et al.[5]. The pH of the slurry was varied, with caustic soda acting as dispersing agent, in the range from 5.5 to 10.5, at 0.5 intervals. After adjusting the pH, the slurry was stirred under constant speed inside a cylindrical device with orifices placed in order to remove settled and non-settled solids. Stirring was achieved by a magnetic bar for 5 minutes. Settling took place during one minute after which an overflow and an underflow were separated and weighed. The dispersion degree (DD%) was calculated by equation (1): | (1) |
where: Wof and Wuf refer, respectively, to the weights of the overflow and the underflow.The test for the by-pass determination was performed in a 4000mL volume PVC vessel. The slurry at 50% solids weight/weight was stirred, homogenized, and then left under rest for 5 minutes prior to several desliming stages until the desired by-pass level was achieved. The by-pass (BP) is quantified by equation 2: | (2) |
where: Vore = volume of ore in the slurry; 4000mL = volume occupied by the slurry in the PVC vessel; 1600mL = limit established in the vessel for collecting the supernatant (overflow or slimes); n = number of desliming stages.Flotation tests, under standard procedure, were performed as close as possible to five by-pass levels: 33%, 10%, 4%, 1% and 0.33%.Additional flotation tests were performed with the -45µm deslimed fraction of iron ores presenting different mineralogical compositions (specular hematite and goethite / porous hematite).
3. Results and Discussion
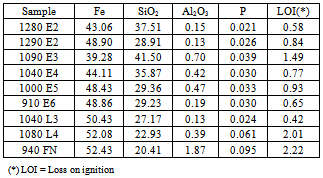
The following results are presented and discussed:Size analyses, chemical and mineralogical characterizations, dispersion degree as a function of pH and flotation results for different levels of by-pass.Tables 1, 2 and 3 show, respectively, the chemical composition, particle size distribution and mineralogical characterization of the samples under investigation.The dispersion degree as a function of pH is illustrated in figure 2.Sample 940 FN presents the highest values of dispersion degree. The dispersion degree increases only slightly with the pH. The dispersion degree of sample 1080 L4 is not affected by the pH. Most of the samples show an increase in the dispersion degree in the pH range between 7 and 8 followed by a region in which the pH does not affect the dispersion degree. Sample 910 E6 presents the lowest levels of dispersion degree, in the full pH range, among the samples under investigation.Table 1. Chemical composition of the samples
 |
| |
|
| Table 2. Size distribution of the samples (cumulative % passing) |
| | Sample | 0,150mm | 0,105mm | 0,075mm | 0,053mm | 0,044mm | | 1280 E2 | 100,0 | 86,1 | 72,5 | 53,5 | 38,9 | | 1290 E2 | 100,0 | 83,6 | 70,5 | 53,0 | 39,6 | | 1090 E3 | 100,0 | 91,2 | 75,0 | 53,9 | 42,7 | | 1040 E4 | 100,0 | 81,8 | 70,2 | 40,9 | 31,4 | | 1000 E5 | 100,0 | 80,3 | 69,7 | 44,7 | 34,5 | | 910 E6 | 100,0 | 77,9 | 64,7 | 34,2 | 24,6 | | 1040 L3 | 100,0 | 90,2 | 84,2 | 66,5 | 57,6 | | 1080 L4 | 100,0 | 84,6 | 68,8 | 49,0 | 37,7 | | 940 FN | 100,0 | 86,6 | 78,7 | 61,0 | 54,1 |
|
|
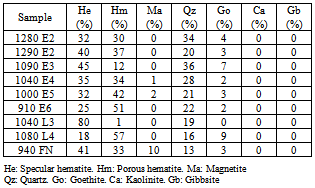
Table 3. Mineralogycal characterisation of the samples
 |
| |
|
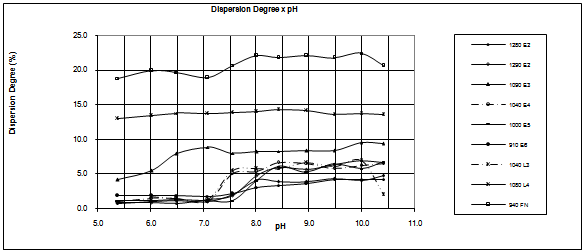 | Figure 2. Dispersion degree as a function of pH |
Tables 4 to 12 illustrate the flotation behavior of the samples under different by-pass levels. SI stands for Gaudin’s selectivity index.| Table 4. Flotation results (sample 1280 E2) |
| | By-pass (%) | Concentrate grades (%) | Fe distribution % in concentrate | SI | | Fe | SiO2 | P | | 33.00 | 68.02 | 0.95 | 0.024 | 80 | 15 | | 10.00 | 68.00 | 0.96 | 0.024 | 81 | 15 | | 4.00 | 67.79 | 0.97 | 0.023 | 79 | 14 | | 1.00 | 67.67 | 0.75 | 0.026 | 80 | 15 | | 0.33 | 68.10 | 0.73 | 0.25 | 81 | 16 |
|
|
| Table 5. Flotation results (sample 1290 E2) |
| | By-pass (%) | Concentrate grades (%) | Fe distribution % in concentrate | SI | | Fe | SiO2 | P | | 33.00 | 68.47 | 0.72 | 0.028 | 71 | 12 | | 10.00 | 68.32 | 0.98 | 0.028 | 73 | 11 | | 4.00 | 68.40 | 0.93 | 0.029 | 74 | 11 | | 1.00 | 68.84 | 0.67 | 0.030 | 73 | 13 | | 0.33 | 68.94 | 0.67 | 0.029 | 84 | 17 |
|
|
| Table 6. Flotation results (sample 1090 E3) |
| | By-pass (%) | Concentrate grades (%) | Fe distribution % in concentrate | SI | | Fe | SiO2 | P | | 33.00 | 62.74 | 7.87 | 0.060 | 49 | 4 | | 10.00 | 66.42 | 2.80 | 0.058 | 56 | 8 | | 4.00 | 66.03 | 2.67 | 0.056 | 71 | 10 | | 1.00 | 66.31 | 2.54 | 0.050 | 71 | 10 | | 0.33 | 67.25 | 1.16 | 0.054 | 73 | 15 |
|
|
| Table 7. Flotation results (sample 1040 E4) |
| | By-pass (%) | Concentrate grades (%) | Fe distribution % in concentrate | SI | | Fe | SiO2 | P | | 33.00 | 63.69 | 7.51 | 0.044 | 50 | 3 | | 10.00 | 64.55 | 6.40 | 0.041 | 52 | 4 | | 4.00 | 64.93 | 5.93 | 0.042 | 55 | 4 | | 1.00 | 66.78 | 3.27 | 0.039 | 61 | 7 | | 0.33 | 67.47 | 1.82 | 0.041 | 63 | 8 |
|
|
| Table 8. Flotation results (sample 1000 E5) |
| | By-pass (%) | Concentrate grades (%) | Fe distribution % in concentrate | SI | | Fe | SiO2 | P | | 33.00 | 68.65 | 1.34 | 0.037 | 70 | 9 | | 10.00 | 69.18 | 0.56 | 0.039 | 72 | 14 | | 4.00 | 69.25 | 0.64 | 0.038 | 71 | 13 | | 1.00 | 69.27 | 0.51 | 0.038 | 75 | 16 | | 0.33 | 69.17 | 0.48 | 0.040 | 76 | 16 |
|
|
| Table 9. Flotation results (sample 910 E6) |
| | By-pass (%) | Concentrate grades (%) | Fe distribution % in concentrate | SI | | Fe | SiO2 | P | | 33.00 | 65.60 | 4.70 | 0.032 | 76 | 5 | | 10.00 | 65.95 | 4.57 | 0.036 | 76 | 5 | | 4.00 | 67.16 | 2.44 | 0.033 | 81 | 8 | | 1.00 | 69.02 | 0.51 | 0.034 | 91 | 27 | | 0.33 | 68.87 | 0.65 | 0.033 | 91 | 23 |
|
|
| Table 10. Flotation results (sample 1040 L3) |
| | By-pass (%) | Concentrate grades (%) | Fe distribution % in concentrate | SI | | Fe | SiO2 | P | | 33.00 | 67.00 | 1.56 | 0.018 | 73 | 7 | | 10.00 | 68.84 | 1.04 | 0.017 | 87 | 15 | | 4.00 | 69.28 | 0.65 | 0.019 | 72 | 14 | | 1.00 | 69.14 | 0.61 | 0.017 | 80 | 17 | | 0.33 | 69.04 | 0.67 | 0.017 | 82 | 17 |
|
|
| Table 11. Flotation results (sample 1080 L4) |
| | By-pass (%) | Concentrate grades (%) | Fe distribution % in concentrate | SI | | Fe | SiO2 | P | | 33.00 | 67.98 | 0.75 | 0.054 | 74 | 12 | | 10.00 | 67.66 | 0.71 | 0.051 | 73 | 12 | | 4.00 | 68.01 | 0.70 | 0.050 | 73 | 12 | | 1,00 | 68.27 | 0.68 | 0.048 | 72 | 12 | | 0.33 | 68.29 | 0.70 | 0.046 | 73 | 13 |
|
|
| Table 12. Flotation results (sample 940 FN) |
| | By-pass (%) | Concentrate grades (%) | Fe distribution % in concentrate | SI | | Fe | SiO2 | P | | 33.00 | 68.47 | 0.80 | 0.054 | 75 | 10 | | 10.00 | 68.96 | 0.47 | 0.049 | 78 | 16 | | 4.00 | 68.97 | 0.47 | 0.046 | 79 | 17 | | 1.00 | 68.70 | 0.48 | 0.041 | 76 | 14 | | 0.33 | 68.91 | 0.58 | 0.037 | 81 | 15 |
|
|
The results on tables 4 to 12 show that, in general, the by-pass affects the flotation behavior. The flotation selectivities of samples 1280 E2 and 1080 L4 are not affected by the by-pass. The high dispersion degree of sample 1080 L4 might be an explanation for this behaviour. The by-pass level interferes with the flotation selectivity of the other samples. For instance, in the case of sample 910 E6 the selectivity index seemed not to be affected by the presence of slimes in the first desliming stages, but the last stage caused a sudden increase in the selectivity index from 8 to 27 when the by-pass was reduced from 4% to 1% (4th desliming stage). For this sample, low by-pass levels yield extremely low silica grades in the concentrate. Sample 1040 E3 did not present an adequate flotation performance even after 5 desliming stages (by-pass 0.33%). A general trend that is also observed is a significant reduction in phosphorus content in the concentrate for tests at low by-pass levels.The different behaviors observed for samples with different by-pass levels did not show any correlation with size distribution, chemical analyses nor mineralogical composition. The samples used in the investigation up to this point were not available any more when evidences from further studies with different iron ore types suggested that differences in specific surface area might be the explanation for the differences observed in the flotation performances. The results of additional flotation tests, performed with the -45µm deslimed fraction of iron ores presenting different mineralogical compositions (specular hematite and goethite / porous hematite), are shown on table 13.| Table 13. Effect of the specific surface on the flotation behavior of iron ores presenting different mineralogical compositions |
| | Mineralogical composition | By-pass (%) | Specific surface are (cm2/g) | Fe distribution in the concentrate | SiO2 in the concentrate | | Specular | 4 | 1000 | 69,7 | 1,2 | | hematite | 6 | 3000 | 67,0 | 2,7 | | Goethite | 2 | 1295 | 92,9 | 1,0 | | / porous | 4 | 1556 | 92,5 | 1,1 | | hematite | 8 | 1887 | 90,7 | 1,1 |
|
|
Table 13 indicates that by pass-levels from 2% to 8% did not affect the flotation performance of iron ore samples with predominance of goethite and porous hematite, possibly because the specific surface area did not present a significant increase for higher by pass levels. On the other side, the specular hematite sample showed a very high increase in the specific surface area of the fraction -45µm of the flotation feed with the increase of the by-pass from 4 to 6. In this case, the SiO2 content in the concentrate increased from 1.2% to 2.7% when the specific surface of the -45µm fraction increased from 1,000cm2/g to 3,000cm2/g, corresponding to a small increase of the by-pass level (4% to 6%).
4. Conclusions
The flotation behavior of different iron ore types depends on the size distribution, chemical and mineralogical characteristics. The dispersion degrees of the samples correlate with the by-pass levels. The methodology developed represents a simple and reliable tool for plant practice control. The industrial selectivity of an ore type may be predicted from dispersion degree determinations and a few desliming and flotation laboratory scale experiments.Most samples showed a maximum dispersion degree and the effect of increasing the pH level above 8.0 is not significant. Concerning plant practice, this fact provides a guideline for the desliming operation, for an effective removal of slimes may be carried out without the need of adding high caustic soda dosages. In addition to the reduction in caustic soda consumption, a better control of the subsequent slimes thickening operations is achieved, for the dispersion state may be easily reversed in this stage with lower dosages of coagulants.The design of industrial desliming circuits must take into account the water partition to the underflow. An industrial hydrocyclones circuit, capable of effectively discarding the slimes, must be designed to provide a maximum of 4% by-pass in order that the SiO2 content in the concentrates from most samples reaches the usual specifications.The specific surface area can be used in future investigations to explain the flotation behavior of different iron ore types under distinct by-pass levels.
References
| [1] | Araujo, A.C., Viana, P.R.M., and Peres, A.E.C., 2005, Reagents in iron ores flotation. Minerals Engineering, 18, 219-224. |
| [2] | Clemer, J.B., 1947, Flotation of iron ore. 8th Annual Mining Symposium, Center for Continuation Study, University of Minnesota, Twin Cities Minneapolis and St. Paul. |
| [3] | Queiroz, L.A., Padovezi, A.D., Ferreira, A.D., and Peres, A.E.C., 2005, The effect of mineralogy on desliming and flotation of itabirite iron ores. In: Proceedings Iron Ores 2005. |
| [4] | Peres, A.E.C., and Silva, G.M.A., 1994, Dispersion degree of iron ore suspensions. In: III Congreso Italo Brasiliano di Ingegneria Mineraria, Universitá di Cagliari, 169-172. |
| [5] | Martins, L., Pereira, C.A., Galery, R., and Peres, A.E.C., 2010, Dispersion role on an oxidized zinc ore flotation. Minerals and Metallurgical Processing, 27(1), 34–41. |
| [6] | The Australasian Institute of Mining and metallurgy, 385-388. |
 Abstract
 Reference
 Full-Text PDF
 Full-Text HTML