-
Paper Information
- Paper Submission
-
Journal Information
- About This Journal
- Editorial Board
- Current Issue
- Archive
- Author Guidelines
- Contact Us
Modern International Journal of Pure and Applied Mathematics
2017; 1(2): 30-37
doi:10.5923/j.mijpam.20170102.03

Graph Theory for Cybercrime: A Note
M. R. Pinheiro
IICSE University DE
Correspondence to: M. R. Pinheiro, IICSE University DE.
| Email: |  |
Copyright © 2017 Scientific & Academic Publishing. All Rights Reserved.
This work is licensed under the Creative Commons Attribution International License (CC BY).
http://creativecommons.org/licenses/by/4.0/

In this note, we introduce some concepts from Graph Theory in the description of the geometry of cybercriminal groups, and we use the work of Broadhurst et al, a piece from 2014, as a foundation of reasoning. We are also worried about suggesting or even creating, if necessary, mathematical jargon, so that also mathematicians, and those who have similar thinking processes, can connect to Broadhurst et al’s work, and create even more ways to deal with cybercrime data. This is a light note, with the sole intent of suggesting ways to go to Broadhurst et al, so that there is even more intersection between their work and ours. What happens with the creation of bridges between Cyber Crime and Mathematics is that we can speak more objectively about things, and, through Mathematics, perhaps optimize the efforts of the computer scientists, or even of the systems analysts, who try to create perfect tools for those who work in such a niche.
Keywords: Graph theory, Geometry, Cybercrime, Organized group, Broadhurst, Swarm, Hub
Cite this paper: M. R. Pinheiro, Graph Theory for Cybercrime: A Note, Modern International Journal of Pure and Applied Mathematics, Vol. 1 No. 2, 2017, pp. 30-37. doi: 10.5923/j.mijpam.20170102.03.
1. Introduction
- It seems that not much has been written about the geometry of cybercrime. Kammerdiner (2014) made use of some concepts from Graph Theory to talk about cyberspace security. So did several other authors in Belavkin et al’s book (2014). Sarvari et al (2014) did use some concepts from Graph Theory in their work, and they also printed some images:
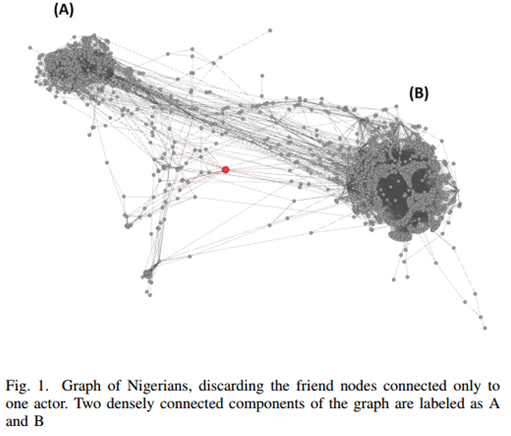 I2 could have produced a very similar graph to the one above: IBM i2 Analyst's Notebook is a visual analysis tool that helps you turn data into intelligence. The solution provides innovative features such as connected network visualizations, social network analysis, and geospatial or temporal views to help you uncover hidden connections and patterns in data. This insight can help you better identify and disrupt criminal, cyber and fraudulent threats (IBM, 2017). This is the explanation for the graph we have just observed (Sarvari et al, 2014):
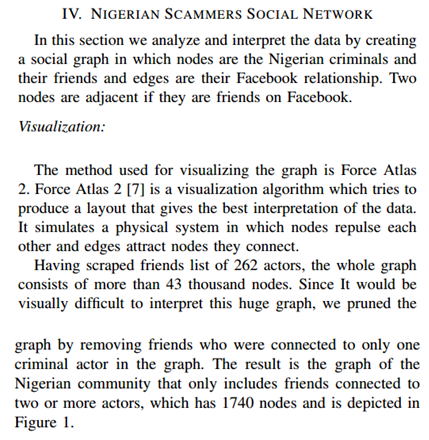 Force Atlas 2 comes connected to the Gephi Software (Gephi, 2017), and it is a continuous graph layout algorithm for network visualisation (Jacomy et al, 2014). Gelphi (2017) let us know that the software is produced independently, and therefore, in principle, there is no connection between it and IBM or its i2.Sarvari et al (2014) also present our next graph.
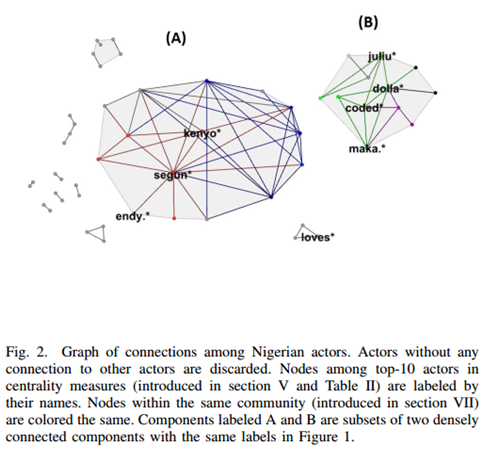
 All the concepts mentioned above (centrality measures, degree, betweenness, and closeness) are seen in i2 and degree is part of the basics for Graph Theory (Moura, 2017). I2 has that all in its Social Analysis Tools (IBM, 2017a).Broadhurst et al (2014) brings pictorial descriptions of the configuration or geometry of the gangs but does not seem to relate those to Graph Theory. See:
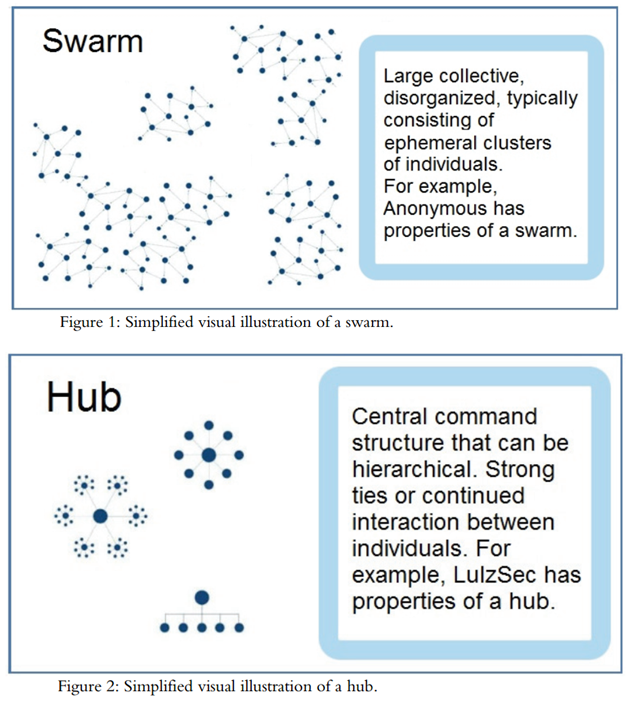 And here the description of the objects provided by Broadhurst et al (2014):
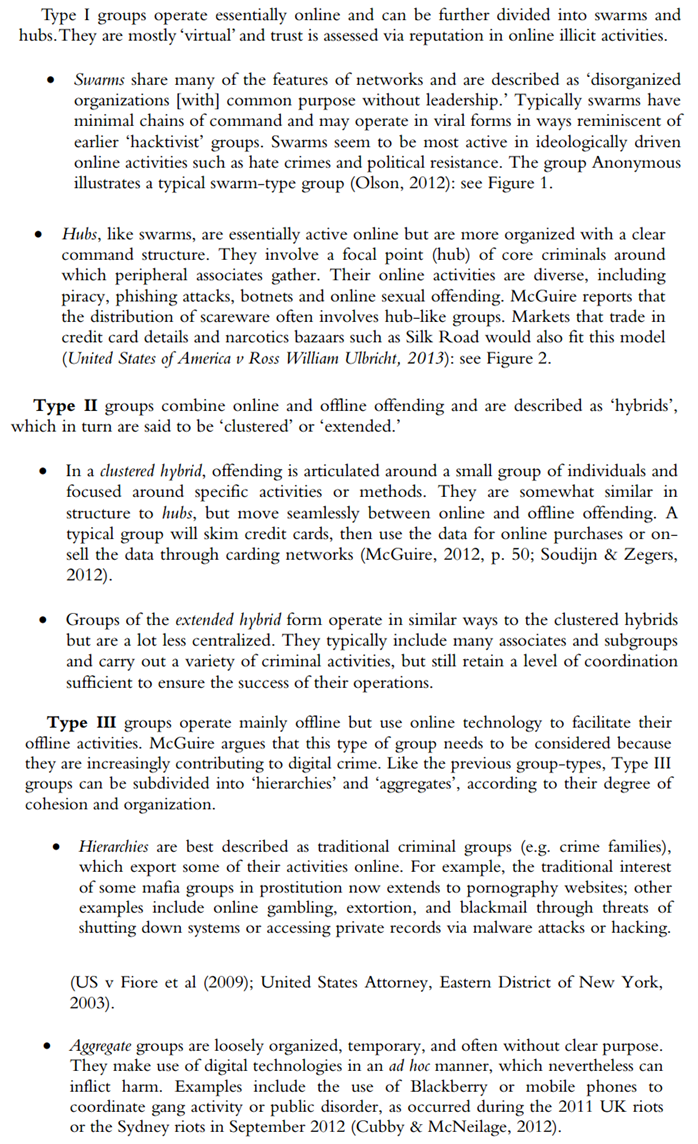 So, those are the images and descriptions provided by Broadhurst et al (2014), but we do not see, amongst those, much Mathematics. That is why, in this paper, we try to do for Broadhurst et al’s work (2014) the same we see done in Sarvari et al’s paper (2014): We put as much Graph Theory as possible in place of what seems to be Information Technology lingo so far.
2. Development
- A Swarm is a collection of Connected Graphs (Weisstein, 1999): From every node there is a path leading to any other node in each one of the graphs we see inside of the set with title Swarm. Each graph forming a Swarm is a simple graph (Weisstein, 1999a): no loops, no multiple edges, no weights, and no direction. They are all planar graphs (Weisstein, 1999b): no edges crossing over others. If the clustering of the graphs forming the swarm were high, the edges would cross. Each one of them has low clustering instead. Perhaps we need some reassurance in the direction of the graphical illustration representing one swarm and not several, so that we will quote another source before giving our suggestion.Wall (2017) talks about a swarming model, which would be formations that exist for a limited amount of time to commit a certain type of crime. We then understand that members of a certain gang could specialize in a certain type of crime and come together only when they deem necessary for the commission of a certain offence. Concomitantly, we could have another share of this gang getting together to commit their particular crime, and end up with both results being put together to buy more shares of the company that they are all trying to control. We could also perhaps imagine other gangs doing the same, and, only because of that, the geometric aspect becoming something like what we see in Broadhurst et al’s picture (2014). That would be an instantaneous graphical description of what is happening with our gangs of interest.Kinetically, we could perhaps illustrate those moves through the image of whips hitting somewhere, since we usually see those retracting after the target has been hit: It is a splash, and then end.Therefore:A collection of graphs that are planar, connected, and simple is called a Swarm.Hubs are sets of Starant Graphs (Pinheiro, 2012) because the criminals gather around a command point, a core. The lowest graph presented by Broadhurst et al (2014) makes us have doubts, and it is like that particular graph is not a Starant Graph: The top node will be represented as a core and all the other nodes, those around it, at the exception of the first, third, and last, will be connected to both neighboring nodes (left and right), and will therefore have degree two. The node that is located immediately under the top node has degree three, and is the most connected in Broadhurst’s illustration (2014).In this case, hubs are not yet sets of starant graphs: The nodes that are not the central node have a degree that varies from one to three and the central node does not yet have degree n (Pinheiro, 2012). If the idea of hierarchy, rather than source or core, is essential to explain the system, we can always put the middle node a bit higher in height, so that a bit of geometric manipulation of the graphical display attained in this way should give us optimal results.We need to understand what Broadhurst et al (2014) meant by the sigmatoid (Pinheiro, 2015) hub in the hierarchical situation: From the drawing, we may think that everyone who is on the same line has got the same powers and access to the top node. In this case, the graph is badly built, since we should see a starant, but we are seeing something else. We may also think that to get to any node the top node needs to go through a protocol, which is basically communicating with the node right below it. That node then has to select right or left, and the right path to get to the node the top node intends to communicate with. If the right interpretation is the latter, the top node is less powerful than the node it connects to, so that the node right below it should be the center of all, since the top one is clearly not that who has the greatest connection power (the name is hub). In any hypothesis, there is a mistake with this representation. If only orders circulated in this network, and the top node passed them to the node right below it, we could believe in hierarchy. That would be perhaps a monarchic network, rather than just hierarchic. We then notice that there would be a few spheres of power, since power would be measured according to the distance from the top node. In this case, the node immediately to the left or right of the node that is right below the top node would be a second-in-command node. Basically, the lowest in this network, who would perhaps compare to the diggers from the army (Commonwealth, 2017), would be the nodes that are on the extremes of the segment containing the second-in-command. In this case, there is also a mistake in the graph, since we should have put those in a lower position than the rest: The perfect alignment would have to imply equal powers in geometric display that is intended to be informative, and therefore mathematical. According to Karawan (2008), hubs command connectivity, and are responsible for connecting nodes with fewer connections. We could however interpret hubs in a different way when we say a network is called hub, like if a node is called hub, that is the definition, but if the own formation, the own geometry of the network, is called hub, then we have another definition. If the definition were connector, then we could not imagine that it connects only to one node right below it in a direct way, since just that one would connect to at least three in a direct way, being therefore more powerful, and, according to the definition just given, a better candidate for the label hub. That would again bring inconsistencies if we talk about Mathematics, so that we must think a bit more about this. Eliott (2014) solves the puzzle: The most common organizational forms are chain networks and hub-and-spoke ((Kaushik, 2012): Hub and spoke are names taken from a bicycle wheel where the hub is its center and spokes originate from this center and terminate at the circumference) networks (sometimes also called star or wheel networks). Weisstein (1999c) lets it clear that the wheels lack the ability to allow for direct (one-step/edge) connections between one node and a node that is two nodes away from it (in a wheel graph, the hub has degree n-1, and other nodes have degree 3. Wheel graphs are 3-connected) on the wheel. Because it is possible that one node connects to the node that is two nodes away from it on the wheel, the best representation for the members of the formation Broadhurst et al (2014) have called hub is the Starant Graph, not the wheel. We confirm this when reading Broadhurst et al’s words (2014): Strong ties or continued interaction between individuals.Having discussed the sigmatoids Swarm and Hub in this paper, we think that Broadhurst et al (2014) should have written Swarms and Hubs in place of Swarm and Hub when they pictorially described the formations they were singling out. As a consequence, we have that Hubs (in Cyber Crime) is the network configuration that is associated with Starant Graphs in Graph Theory. Swarms is a collection of graphs that are planar, connected, and simple.Having dealt with Broadhurst et al’s Type I groups (2014), we now address those that are classified as Type II (Broadhurst et al, 2014):A Clustered Hybrid seems to be a small group that is well connected, so say again a Starant Graph, but what makes it worthy of the note is the fact that it operates in hybrid mode, so off- and on- line. In this case, we could be calling it Starant Graph of Mixed or Hybrid Operation Mode. Extended Hybrid groups seem to be Clustered Hybrid groups with a pulverized managerial core, so that we could probably describe them as a set of Starant Graphs where all the central nodes are also end-points. That is the rewording of Type II. Now let’s investigate Type III:Hierarchies sound a lot like mafia. Daily (2011) brings the following image as a graphical representation of the relationships or communication channels inside of mafia:
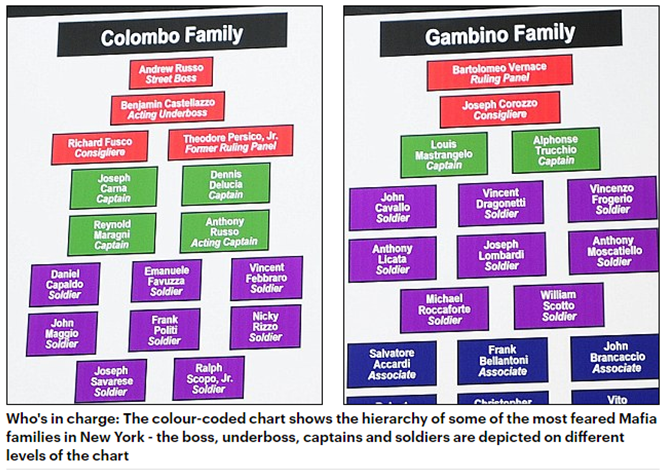 Here we see the idea of levels of power connected to distance from the top. The more levels to the bottom we go, the more people we see, so that the last level would always be the most populated and therefore the previous level would contain the best candidates to hub in that particular network. Aggregate groups are perhaps groups without a leader; temporary groups created to commit some offence. In this case, a Circulant Graph could be the ideal representation of an aggregate group. A Circulant not a wheel because we do not want to lose the flexibility involved: Allowing for as many connections as needed between nodes.
3. Conclusions
- We here were worried about suggesting or even creating, if necessary, mathematical jargon, so that also mathematicians, and those who have similar thinking processes, can connect to Broadhurst et al’s work (2014), and create even more ways to deal with cybercrime data. Different from a few other authors from Cyber Crime whose work we had access to, Broadhurst et al (2014) bring pictorial descriptions of the configuration or geometry of the gangs, but they do not seem to relate those to Graph Theory.After discussing the sigmatoids in depth, we decided for the following definition of Swarms and Hubs: A collection of graphs that are planar, connected, and simple is called a Swarms; the network configuration that is associated with Starant Graphs in Cyber Crime is Hubs: Hubs is a collection of Starant Graphs. The same happens to Clustered Hybrids: They would be associated with Starant Graphs in Graph theory. Circulant Graphs are probably the best way to represent aggregate groups.At least one pictorial description of real-life criminal network of Broadhurst et al (2014) seems not to be so accurate: We probably need a Starant Graph with a central node that appears to be above the other nodes in the pictorial description that we refer to (last one, bottom, hubs) instead of what we currently have.Some authors have suggested that the hub-and-spoke networks should be better represented by stars or wheels. They are probably wrong, and the best representation is the Starant Graph instead because this graph can become a star, a wheel, and any other network configuration that we seem to see in a hub-and-spoke network.
 Abstract
 Reference
 Full-Text PDF
 Full-text HTML