-
Paper Information
- Paper Submission
-
Journal Information
- About This Journal
- Editorial Board
- Current Issue
- Archive
- Author Guidelines
- Contact Us
Modern International Journal of Pure and Applied Mathematics
2017; 1(2): 24-29
doi:10.5923/j.mijpam.20170102.02

Some Weight on Our Edges
 Abstract
 Reference
 Full-Text PDF
 Full-text HTML
Marcia R. Pinheiro
IICSE University, USA
Correspondence to: Marcia R. Pinheiro , IICSE University, USA.
| Email: |  |
Copyright © 2017 Scientific & Academic Publishing. All Rights Reserved.
This work is licensed under the Creative Commons Attribution International License (CC BY).
http://creativecommons.org/licenses/by/4.0/

In this paper, we put two concepts together: Shortest paths and starant graphs. We calculate the costs involved in putting two randomly selected individuals in contact in a controlled network. That would be the costs in terms of public health. Disease spread became our main concern in what comes to the starant graphs in the year of 2002 because that is one of the directions the work of Comellas et al. and Watts et al. pointed at, and our work is inspired in theirs. Other factors, such as random, and unexpected, contact between individuals, are disregarded, so that if the individual visits the clinic that belongs to Mister X, his mate, but his usual doctor, Mister Y, is not there, and he is then served by Miss R, we will need new calculations, what means that we go from predictive power to disgrace power, and that frontally opposes our initial intentions with this work.
Keywords: Starant graph, Disease spread, Network, Shortest path, Cost
Cite this paper: Marcia R. Pinheiro , Some Weight on Our Edges, Modern International Journal of Pure and Applied Mathematics, Vol. 1 No. 2, 2017, pp. 24-29. doi: 10.5923/j.mijpam.20170102.02.
1. Introduction
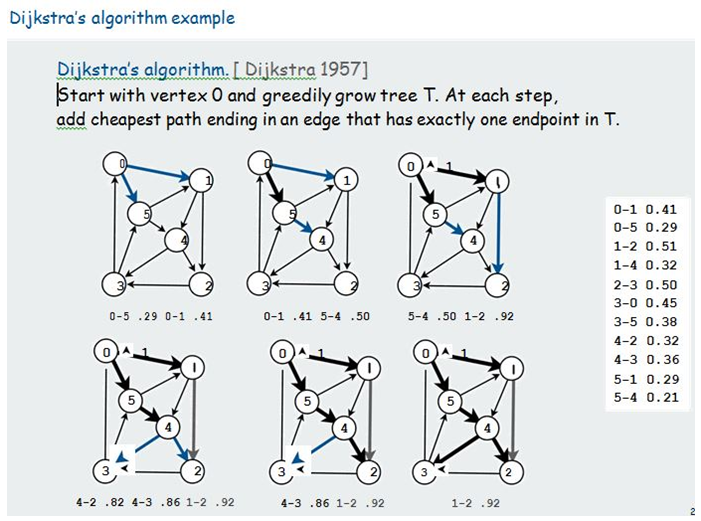
- We designed the Starant Graph in 2002 to address the problem human network for disease spread. Since then, unfortunately working independently, and with little or no support, our progresses were slow, but perhaps reasonably steady. Our first paper on the topic (produced in 2002) brought a bit of criticism to Comellas et al.’s theories. We found what we believed to be a small inaccuracy with a lemma, and counter-examples made it all evident (Pinheiro, 2007). We recently published a summary of our developments in what regards the Starant Graph. That was (Pinheiro, 2016).In-between the first and the last paper on the topic, we produced Starants II or (Pinheiro, 2012). There we talked about Colloquium Rectangles and Double Colloquium Rectangles.We now want to put weights on our edges and apply the concepts associated with the name Dijkstra in the academic products. We will talk about costs and we then will mean cost of putting a particular individual in physical contact with another. That cost is directly connected to disease spread in our studies, so that we worry about impact of the spread each, and every, time.
2. Development
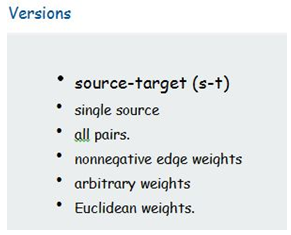
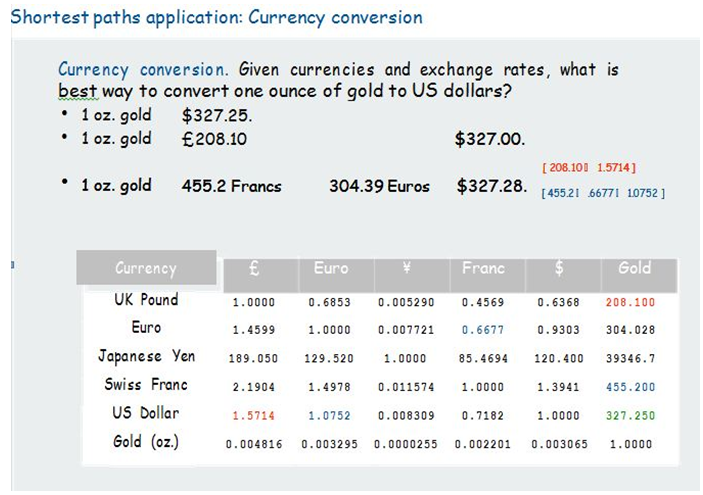
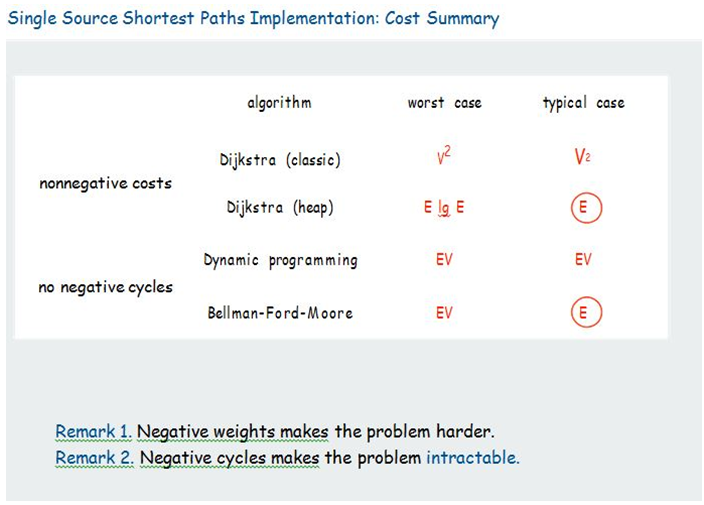
- We will quote Sedgewick (2017) here:
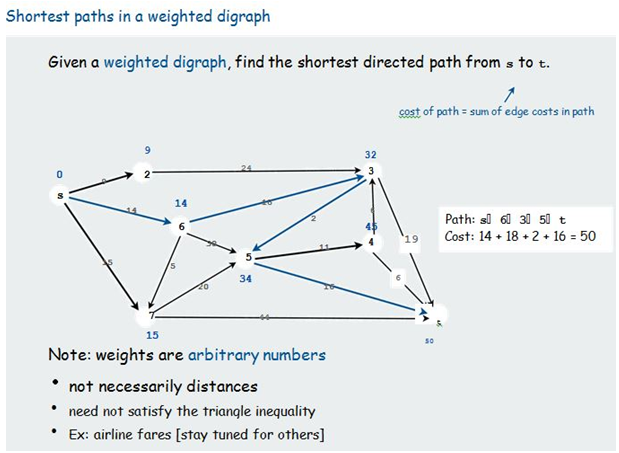 | Figure 1 |
 | Figure 2 |
 | Figure 3 |
 | Figure 4 |
 | Figure 5 |
 | Figure 6 |
 | Figure 7 |
 | Figure 8 |
3. Conclusions
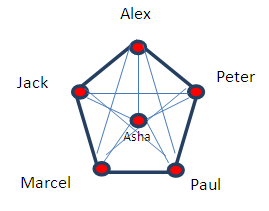
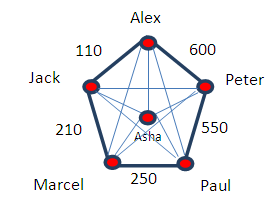
- In conclusion, we have now created a way to tell the impact of the face-to-face contact between any two randomly chosen individuals in a controlled network in terms of public health or population contamination. We make use of Dijkstra’s algorithm to measure such an impact and our calculations are based on how many people the individual who is randomly chosen meets face-to-face during a certain period of time.Each edge of our Starant Graph starts having a weight, and that weight represents the sum of the weights of the networks of both nodes or individuals involved.We could think of a social network environment such as Linkedin here to make it easier: Assume all the people we can meet in face-to-face mode appear in our Linkedin network. In this way, the number of members of our Linkedin is the weight of our network or the weight of our personal network in the problem we here consider; that of disease spread.We make very naïve assumptions, such as that there are no common members to these networks and those networks do not include any member of the main group we study, just for the purpose of presenting the tool, which we will be using later, in more advanced studies.We cannot really add the weight of the edges if we talk about more than two members and face-to-face contact amongst them. In this case, we would have to diminish the weight of the individual’s network attached to the common nodes when considering the edges instead. For instance, in the example we here give, of Peter, Paul, and Marcel meeting face-to-face, if we added the weights of the edges between them, if we simply did that, we would get 550 + 250 = 800, but the impact of these contacts is actually 750 instead because Paul is represented by a node that connects to more than one node involved in this calculation and his weight is 50, precisely what has to be subtracted from the straight sum. In conclusion, we have to add all edges and subtract the weight of the common nodes multiplied by the number of participating nodes that it connects to minus one. If that node only connects to one participating node, we would subtract zero then.