-
Paper Information
- Next Paper
- Paper Submission
-
Journal Information
- About This Journal
- Editorial Board
- Current Issue
- Archive
- Author Guidelines
- Contact Us
Journal of Microbiology Research
p-ISSN: 2166-5885 e-ISSN: 2166-5931
2015; 5(3): 101-108
doi:10.5923/j.microbiology.20150503.04
Investigation of Methanosarcinales and Methanomicrobiales Presence within a Dry Anaerobic Digester
 Abstract
 Reference
 Full-Text PDF
 Full-text HTML
Ryan D. Bartell, Eric Matson, Sabrina Mueller-Spitz, Gregory T. Kleinheinz
Department of Biology, University of Wisconsin Oshkosh, Oshkosh, USA
Correspondence to: Ryan D. Bartell, Department of Biology, University of Wisconsin Oshkosh, Oshkosh, USA.
| Email: |  |
Copyright © 2015 Scientific & Academic Publishing. All Rights Reserved.
Greenhouse gasses such as methane and carbon dioxide are thought to play a major role in global climate change. Anaerobic digesters function to produce energy using the methane derived from organic matter which would typically be deposited in landfills. The three main types of digesters are low-solids wet digesters, high-solids wet digesters, and dry anaerobic digesters. Dry anaerobic digesters are drastically rarer than wet digesters, and the microbial community responsible for the production of biogas is consequently less-studied than in other types of digesters. In this study, the 16S rRNA gene copy concentrations of Methanosarcinales spp. and Methanomicrobiales spp. were determined using qPCR during a 28-day fermentation cycle. Biogas analysis showed that fermenters with an added carbon source, microcrystalline cellulose, produced a greater volume of biogas and methane than those without substrate. At each point in the 28-day fermentation, Methanosarcinales spp. were present at approximately 107 16S rRNA genes per gram of sample, whereas Methanomicrobiales spp. had concentrations between 104 and 106 16S genes per gram of sample. Overall, Methanosarcinales spp. were consistently more abundant at every tested time point. The different concentrations of methanogens could indicate that the nutrients and conditions within the tested digester are more suited to the metabolism of Methanosarcinales spp. than Methanomicrobiales spp. This information helps to fill the knowledge gap concerning methanogen presence in dry anaerobic digesters, and could be used in the future to dictate the type of substrate used in a particular dry anaerobic digester.
Keywords: Methanogen, qPCR, Anaerobic digester, Methane, Methanosarcinales, Methanomicrobiales
Cite this paper: Ryan D. Bartell, Eric Matson, Sabrina Mueller-Spitz, Gregory T. Kleinheinz, Investigation of Methanosarcinales and Methanomicrobiales Presence within a Dry Anaerobic Digester, Journal of Microbiology Research, Vol. 5 No. 3, 2015, pp. 101-108. doi: 10.5923/j.microbiology.20150503.04.
Article Outline
1. Introduction
- Methane recapture is a sustainable way to take waste products and turn it into energy. In the US in 2011, yard trimmings, food waste, and paper and cardboard comprised 13.5%, 14.5%, and 28.0% of municipal solid waste generated, respectively [1]. Organic wastes such as paper and yard trimmings can be diverted from the landfill by means of enhanced recycling programs and food waste has been used as an effective feed stock in anaerobic digestion. Although several different systems are able to capture methane and convert it to heat and energy, three main types exist: low-solids wet anaerobic digesters, high-solids wet anaerobic digesters, and dry anaerobic digesters. Each has its role in renewable energy production, but each also is able to operate under a set of unique conditions with a unique set of feedstock materials. Wet digesters have a total solids (TS) content of less than 20 percent, whereas high-solids digesters have a higher TS percent, usually 20-42 percent. [2-4]. High-solids wet digesters can have solids content as high as 20% but are often about 15%, while traditional wet, continually stirred systems have less than 5% TS.The difference in solids content is an important feature in each system as it will provide indications as to the types of feedstocks that may be appropriate for the system. For example, manure from dairy operations would be an unacceptable option for a dry system as solids would be too low to provide the necessary structure for operation. Some high-solids wet systems have tried to increase solids content by the addition of more solid material to a wet system to increase gas production. Conversely, dry feedstocks such as manufacturing byproducts, food waste, and/or yard wastes are too low in moisture to be efficiently fed into traditional wet systems. Dry anaerobic digesters (AD) have the advantage of taking feedstocks that are not appropriate for other AD systems. Additionally, these systems have the lowest operational cost and parasitic load on operations which make them a desirable technology for certain applications.The anaerobic digester at the University of Wisconsin Oshkosh (UWO digester) is a dry digester which is designed for the breakdown of 25+% solids content, and was the first operational dry digester in North or South America. Because of this, the digester is considered a “high-solids dry anaerobic digester.” In dry anaerobic digestion, the feedstock mix is loaded into the reactor only once in the beginning of the digestion cycle, much like in a batch-fed digester. Once the mixed feedstock is inside the reactor bay, doors close to seal the mix inside, which prevents contact with outside oxygen. Sealing the bay door prevents the influx of atmospheric oxygen, which can hinder the growth and viability methanogenic archaea and anaerobic bacteria [5, 6]. In the UWO digester, percolate (2-3% TS) from a central storage tank is sprayed over top of the mix intermittently and drained through the floor. Like in a continuously-fed system, this helps to provide nutrients and inoculate much of the feedstock with bacteria and archaea necessary to carry out methanogenesis [7]. After 28 days of fermentation, the reactor bay doors are opened, and the cycle repeats. In anaerobic digestion, biogas is produced when organic material is broken down by microorganisms in the absence of oxygen. Common organic materials include foodwaste, plant matter, wastewater, different types of manures, and waste products from industrial processes such as beer and wine production [8-12]. The three main components of biogas are methane, carbon dioxide, and water vapor. Methane and carbon dioxide can constitute as much as 65% and 30-40% of total biogas, respectively; water vapor is maximally saturated in digester biogas at 35°C which translates into about 40 g/m3 [10].The production of biogas is a process generally described in four steps: hydrolysis, acidogenesis, acetogenesis, and methanogenesis [13]. In hydrolysis, polymers are broken down into shorter polymers or monomers. While hydrolysis, acidogenesis, and acetogenesis can be carried out by many different types of bacteria, only archaea are capable of producing methane. Methanogenic archaea use two main metabolic routes to produce methane: acetoclastic and hydrogenotrophic methanogenesis.In acetoclastic methanogenesis, the methyl group of acetate is stripped and a hydrogen atom is added to it to produce methane. The remaining carboxyl group is converted to carbon dioxide [14]. In the hydrogenotrophic pathway, hydrogen serves as an electron donor, and carbon dioxide is reduced to methane. Not all methanogens are capable of carrying out both acetoclastic and hydrogenotrophic methanogenesis. In fact, Methanosarcina acetivorans is the only known organism capable of utilizing all three methanogenic pathways (acetoclastic, hydrogenotrophic, and methylotrophic) [15].While many studies have examined the microbial community dynamics associated with wet AD and AD at wastewater treatment facilities [16-19], to our knowledge, no such studies have been conducted on a system similar to the dry digester found at UWO. While the basic process of methanogenesis may be the same in all applications, the groups of microbes, length of each step in the process, and role of each group of microbes may be very different in each different technology. It stands to reason that feedstock differences, organic content, solids content, bulk-phase differences, etc. will all play a role in the microbial structure in the systems. Until the microbiology of the dry digestion process is better understood, plant managers can only make educated guesses concerning the physical and chemical parameters which are appropriate for the microbial community contained within the system. Since certain methanogens have higher or lower affinities and utilization rates for metabolites such as acetate or carbon dioxide, an optimum methane output could be achieved by creating conditions suitable to the metabolisms of the dominant microbes [20]. Although UWO digester has some similarities to a wet digester, it has several differences in operation and structure that could contribute to microbial community dynamics not present in wet digesters. Previous studies concerning microbial community dynamics in wet digesters have examined the changes in both bacterial and archaeal communities. Results from microbial ecology studies show that biodigesters are very dynamic systems in which groups of microorganisms are commensally-dependent on the production of metabolites by other groups of microorganisms [21].Quantitative real-time polymerase chain reaction (qPCR) has gained popularity in recent years as a method of determining microbial populations in methanogenic systems. Primers and probes for several different clades of methanogens have been developed and tested in previous studies [20, 22-24]. Previous culture-independent studies have shown the families Methanosarcinaceae and Methanosaetaceae (in the order Methanosarcinales) and the order Methanomicrobiales to be very common in anaerobic digestion [18, 25-28]. Methanosaetaceae has also been found to be present in many other environments [16, 29-33]. While the metagenomic data derived from other studies provide a basis for the investigation of the microbial diversity in UWO digester, the applicability of the data is severely limited by the fact that dry digesters are dissimilar in structure, function, and operation to other digesters used in previous studies. For example, in most digesters, the liquid phase constitutes the majority of the volume. In high-solids dry digesters, however, the majority of the digesters volume is solid phase, with the remaining portion being gas phase. Although the process of methanogenesis is analogous between wet and dry AD, limited research has been conducted to further understand the microbial community within a dry AD. This study is the first of its kind conducted on a dry AD system, and serves to fill the knowledge gap surrounding the process of methane production within a dry AD. The overall objective of this study was to begin to characterize the archaeal community within the percolate and feedstock of a dry AD. Specifically, bench-scale reactors with digestate from the UW Oshkosh dry AD system were used to assess the presence of two of the most common methanogenic orders, Methanosarcinales and Methanomicrobiales, were quantified over a 28-day fermentation cycle.
2. Materials and Methods
2.1. Digestate Collection
- Digestate was collected from UWO digester (University of Wisconsin Oshkosh, Oshkosh, WI) for use in biogenic methane potential and microbiological analyses. The digestate was collected shortly after unsealing the digester doors following a complete 28-day fermentation cycle, and was immediately (i.e. >30 minutes) transported to the lab. During transport, the digestate was sealed 5-gallon buckets to mitigate heat loss and oxygen exposure. Freshly-collected digestate was used for each experiment.
2.2. Determination of Biogenic Methane Potential (BMP) in Bench Scale Reactors
- Digestate was collected from UWO digester for each BMP experiment. For BMP analysis, digestate was supplemented with microcrystalline cellulose (MC) (Alfa Aesar, Ward Hill, MA) as the added carbon source for the test to a final concentration of six percent (w/w). MC is used as the positive control in the German standard method for BMP analysis DIN 38414-S8 because it is not broken down as quickly as many simple carbon sources. Digestate not containing MC was used as a negative control. Digestate containing MC (MC(+)) and digestate without MC (MC(-)) were loaded into two-liter eudiometers, and temperature was held at 38°C as prescribed in DIN 38414-S8. Each of the eight MC(+) eudiometers contained 1504 grams digestate hand-mixed with 96 grams MC, and each of the eight MC(-) eudiometers contained only 1504 grams digestate. MC(+) and MC(-) eudiometers were filled such that approximately 20% of the volume of the eudiometer vessel was headspace. The headspace was not flushed with gas after loading. Total gas production was measured throughout the 28 day study period. Gas composition measurements for methane and carbon dioxide were determined from bench-scale systems using a GFM400 series digital gas meter (Gas Data Ltd, UK). The GFM400 has a limit of detection of 0.1%.
2.3. Methanogen Quantification Using qPCR
2.3.1. Construction of Standard Curves for qPCR
- Due to their prevalence in other types of digesters, gene copy concentrations for Methanosarcinales (MSL) and Methanomicrobiales (MMB) were investigated. Primer/ probe sets for the orders Methanosarcinales (MSL) and Methanomicrobiales (MMB) were used to construct a standard curve. The primer/probe set for MSL included MSL812F (forward primer), MSL860F (probe), and MSL1159R (reverse primer), and the MMB primer/probe set included MMB282F (forward primer), MMB749F (probe), and MMB832R (reverse primer) [27]. Digestate was collected from UWO digester, and DNA was extracted from 0.25 grams of digestate using a Powersoil DNA Extraction Kit (Mobio, Carlsbad, CA). The extracted DNA was used as a template to amplify MMB and MSL target sequences via PCR using a StepOne Plus (Applied Biosystems, Carlsbad, CA). Denaturation, annealing, and extension steps for each primer set were performed using times and temperatures previously described in literature [27]. Twenty microliter reaction were run using 1 µl of genomic DNA with Bullseye TaqProbe 2X qPCR Master Mix (Midsci, St. Louis, MO) containing NTPs, Hot Start Taq polymerase, MgCl2, and ROX reference dye. Reactions were diluted to 20 µl using PCR-grade water. Amplification was allowed to run for 40 cycles. To check for amplification, one reaction for each of the replicates of each target group contained the target group’s respective probe. Within two hours of completion of the reaction, a 1:20 dilution of the PCR product was made, and one µl of the dilution from a reaction not containing a probe was inserted into a pCR2.1 plasmid vector from a TA TOPO10 Cloning Kit (Invitrogen, Madison, WI).DNA concentration of the solution containing the extracted plasmids was measured, and the solution was serially diluted in order to make standards. MSL standards ranged from 1.0 x 10³ to 1.0 x 10⁶ 16S rRNA gene copies. For the MMB standard curve, standards ranged from 1.0 x 10³ to 1.0 x 10⁸ 16S rRNA gene copies. Each standard curve qPCR assay was run using the previously described parameters. Each gene concentration was tested in triplicate, and the log value of each concentration was plotted against the average cycle threshold value in order to create a standard curve.
2.3.2. Methanogen Analysis in Digestate
- Digestate from BMP experiments was collected and kept at -80°C until qPCR analysis. DNA was extracted from 0.25 grams of digestate using a Powersoil DNA Extraction Kit (Mobio, Carlsbad, CA). Extracted DNA was tested using previously mentioned primers and probes and qPCR conditions in order to determine the 16S rRNA gene copy concentrations for MSL and MMB based on standard curves for each order.
3. Results
3.1. BMP Analysis of Digestate
3.1.1. Biogas Volumes
- Biogas production from two different experiments was determined. In the first trial, MC(+) produced roughly 20 cm3 of biogas per gram of digestate (wet weight), and MC(-) produced less than ten cm3 of biogas per gram of digestate of biogas. In the second trial, MC(+) produced just over 35 cm3 of biogas per gram of digestate, while MC(-) produced less than ten cm3 of biogas per gram of digestate (Fig. 1).
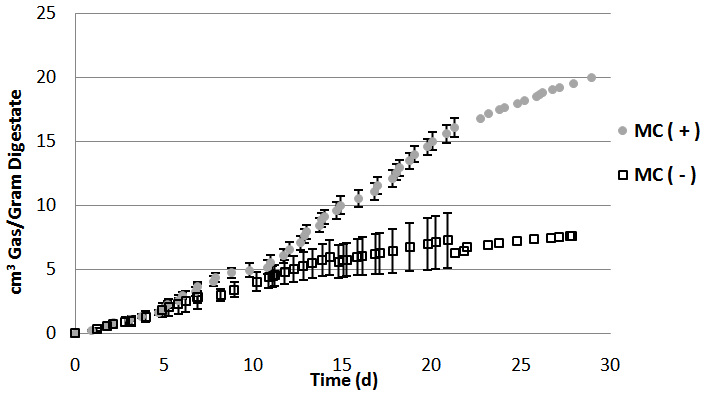 | Figure 1. Total biogas production from UWO digester digestate. Total biogas production from digestate alone (MC(-)) and digestate supplemented with MC (MC+) is shown . Error bars show standard deviations for points where n ≥ 3 |
3.1.2. Methane and Carbon Dioxide Content
- Methane and carbon dioxide composition from digestate biogas was consistent with biogas from the UWO digester. Biogas from MC(+) digestate had averages of 38.0, 53.0, 50.1, and 64.2% methane at 7, 14, 21, and 28-day time points, respectively. Biogas from MC(-) digestate averaged 39.9, 59.7, 63.0, and 59.8% methane at 7, 14, 21, and 28-day time points, respectively (Fig. 2). Biogas from eudiometers containing digestate with microcrystalline cellulose had averages of 62.0, 46.4, 49.8, 35.8% carbon dioxide at 7, 14, 21, and 28-day time points, respectively. Biogas from eudiometers with only digestate averaged 33.2, 33.9, 35.0, 37.7% carbon dioxide at 7, 14, 21, and 28-day time points, respectively (Fig. 3). In MC(+) digestate, methane and carbon dioxide constituted greater than 99 percent of the gas at each tested time point. The production of methane and carbon dioxide from MC(+) digestate is consistent with what has been observed in the full-scale operation of the UWO digester.
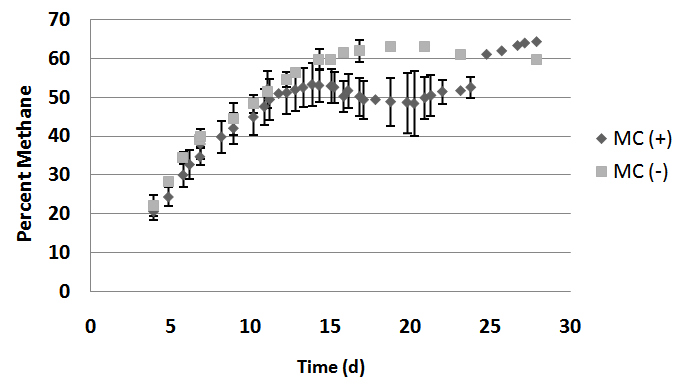 | Figure 2. Average percent methane of biogas produced from digestate. Digestate loaded with microcrystalline cellulose (MC) initially produced biogas with lower percent methane than that produced from digestate alone. Standard deviations are shown for each point expect when there was a single bioreactor remaining |
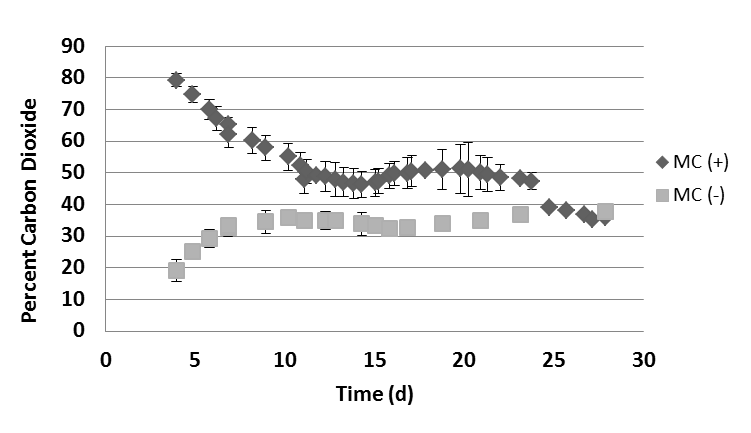 | Figure 3. Average percent carbon dioxide of biogas produced from digestate. Digestate loaded with microcrystalline cellulose (MC) had higher initial carbon dioxide production than the negative control digestate. Standard deviations are shown for each point |
3.2. Real-time PCR Methanogen Analyses
- Two different orders of methanogens were quantified using real-time polymerase chain reaction (qPCR). A one-way ANOVA was conducted using Minitab software on the entire data set, showing that differences between means on at least one day existed (p<0.001). Tukey’s HSD (95% confidence interval) was used to determine which individual means were different or similar to one another. In MC(+) digestate, MSL was present in consistently higher densities than MMB. MSL concentrations began about 107 gene copies per gram digestate, dropped to 3.2 x 10⁶ after 14 days, and then increased in concentration until reaching 107 gene copies per gram digestate at day 28. MMB began the experiment at 2.5 x 10⁴ copies per gram digestate and increased at day 7 to 105 copies per gram digestate. MMB copy concentrations decreased at days 14 and 21, and then increased again at day 28 (Fig. 6).
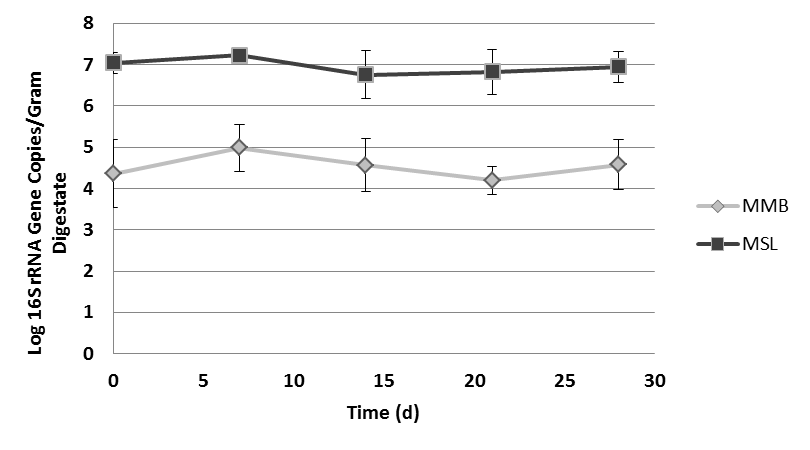 | Figure 6. Methanomicrobiales and Methanosarcinales 16S rRNA gene copy concentrations in MC(+). Methanosarcinales (MSL) was consistently more present over the tested period than Methanomicrobiales (MMB). Standard deviations are shown for each point |
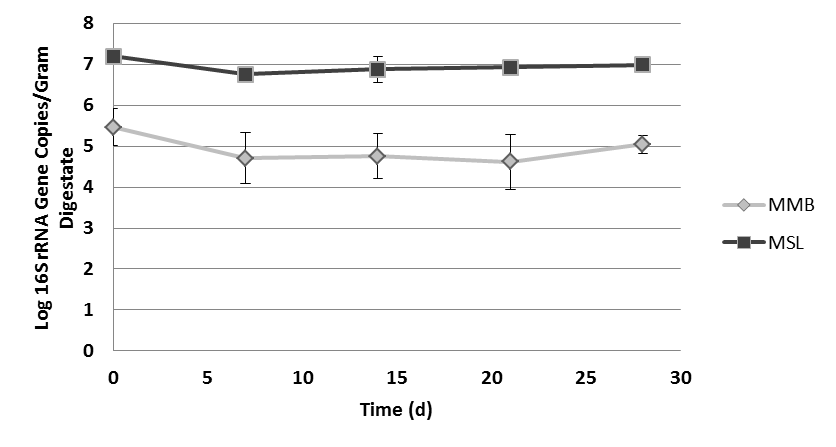 | Figure 7. Methanomicrobiales and Methanosarcinales 16S rRNA gene copy concentrations in digestate with no substrate. Methanosarcinales (MSL) was consistently more present over the tested period than Methanomicrobiales (MMB) |
4. Discussion
- Biogas volume differences between MC(+) and MC(-) digestate were notable. MC(-) digestate had much lower overall gas production than MC(+) digestate. This is expected because microbes are able to use the MC (when present) as a source of carbon. When there is no substrate present, the microbes are forced to use the minimal amount of nutrients that remain in the digestate. If bacteria do not have an abundant source of carbon to metabolize, they may not replicate and produce precursor molecules for methanogenesis. The effects of the limitation on the hydrolytic step of methanogenesis are apparent when examining the volume of biogas production along with the quality (i.e. methane and carbon dioxide content) of the gas produced.Biogas from digestate with microcrystalline cellulose had lower initial methane percentages than biogas produced from negative control digestate. Digestate with microcrystalline cellulose had higher initial carbon dioxide content. In the first seven days, the gas composition of digestate with MC biogas may have been higher in carbon dioxide because bacteria may be using the MC as an energy source and producing carbon dioxide as a byproduct. The limited initial methane production may be due to the time it takes the bacteria to proliferate to a level that provides methanogens the substrates needed to produce methane. For the first seven days, nutrients are limited for methanogens which need either carbon dioxide or acetic acid as an energy source to make methane. Also, in the initial days of the experiment, oxygen is present in trace amounts, which prevents strict anaerobes (such as methanogens) from growing. Although methane was a main constituent in biogas from MC(-) digestate, the digestate did not produce a high volume of biogas. MC(-) digestate produced only a small amount of gas high in methane content, which underlines the importance of the addition of feedstock to a digester. If a full-scale digester did not have feedstock added to it, the digester would likely not produce a high volume of biogas, even though the relatively small volume of biogas produced per unit of substrate would have high methane content.qPCR analysis showed that MSL was more abundant than MMB in MC(+) and MC(-) digestate. There are three families within the order of MSL, and methanogens within the three families are capable of using carbon dioxide and/or acetic acid to make methane. The wider range of molecules that MSL can use may account for its increased ability to survive and proliferate within digestate at higher concentrations than MMB. Families within the order MMB, however, are only capable of using carbon dioxide or formate as an electron acceptor to produce methane. Since members of MSL are able to use multiple metabolic pathways to produce methane, it is expected that this order has an advantage in growing versus members of MMB, which can use comparatively fewer electron acceptors during methane production. Methanosarcinales spp. are metabolically diverse, and are able to produce methane using acetoclastic and/or carbon dioxide reducing pathways, and organisms within Methanomicrobiales are only capable of producing methane by reducing carbon dioxide or utilizing formate or alcohols. Methanomicrobiales spp. are able to subsist during fermentation by reducing carbon dioxide, and it is hypothesized that they are able to survive periods of oxygen-exposure due to their ability to produce super oxide dismutase [34]. The metabolic diversity of Methanosarcinales spp. and the resiliency of Methanomicrobiales spp. may explain why they were the two most common orders in digestate.Although data exist for metagenomic studies of wet anaerobic digesters, the physical and operational differences between types of digesters may have significant impacts on the taxonomic profile of microbial populations, which could be elucidated by long-term and comparative studies. The authors of this study are not aware of any data detailing the taxonomic differences between wet and dry digesters, nor any data showing a complete taxonomic profile of multiple points in time in a dry anaerobic digester. These data may be useful in the future to tailor co-culture, chemical, or feedstock amendments to a specific digester, when used in conjunction with the current methodologies for determining digester functionality or efficiency.
5. Conclusions
- The aim of this study was to provide a greater understanding of the methanogenic population within a dry anaerobic digester. Results show that a much greater volume of biogas was produced when digestate was supplemented with microcrystalline cellulose, and that two orders of methanogens, Methanosarcinales and Methanomicrobiales, were abundant in the tested digester. During the fermentation process, Methanosarcinales was present in greater concentrations that Methanomicrobiales, regardless of whether or not an additional carbon source was added. At the tested time-points, gene copy concentrations fluctuated only minimally over the 28-day fermentation for both orders of methanogens.The information from this study provides an essential foundation on which to build the understanding of the microbiological dynamics of a dry anaerobic digester. Characterizing the microbiology, biochemistry, and metabolomics of a dry AD can potentially inform plant managers of dry AD systems which substrates to use or may provide insights into nutrient sources that can be used as amendments to optimize methane production in the future. Building a deeper understanding of dry AD would require long-term metagenomic studies to help elucidate the variability of organisms present within a dry anaerobic digester, studies with a variety of nutrient sources to determine the impact substrates have on the biological or biochemical dynamics of the system, and studies which actively alter the microbiology of the system to determine how alteration of the commensal relationship between bacteria and archaea effects metabolite and biogas production.
ACKNOWLEDGEMENTS
- The authors wish to thank the University of Wisconsin Oshkosh for access and use of its dry anaerobic digester. The authors would also like to acknowledge the time, effort, and advice received from staff at the Environmental Research and Innovation Center at UW Oshkosh.