-
Paper Information
- Paper Submission
-
Journal Information
- About This Journal
- Editorial Board
- Current Issue
- Archive
- Author Guidelines
- Contact Us
Journal of Microbiology Research
p-ISSN: 2166-5885 e-ISSN: 2166-5931
2015; 5(2): 41-45
doi:10.5923/j.microbiology.20150502.01
A Preliminary Study of Water Quality in Rural Belize
 Abstract
 Reference
 Full-Text PDF
 Full-text HTML
Karen Waight, Josue Ake, Joselyn Romero, Thippi Thiagarajan
Faculty of Science and Technology, University of Belize, Belize, Central America
Correspondence to: Thippi Thiagarajan, Faculty of Science and Technology, University of Belize, Belize, Central America.
| Email: |  |
Copyright © 2015 Scientific & Academic Publishing. All Rights Reserved.
A preliminary study was conducted to analyze the water quality of creek waters used by villagers in the Cayo district of Belize. Three sites on water bodies that are used by the residents of St. Margaret village for various domestic purposes were chosen. Various physical, chemical and microbiological parameters were analyzed by using standard water quality measurements and compared for the wet and dry seasons. The results indicate that the pH was high during dry season especially in the month of April. The phosphate levels were high during the wet season in almost all the sites studied. Dissolved oxygen levels were high during March and April, but were generally low during the wet season. The fecal coliform levels were alarmingly high during the month of October. Further analysis for the presence of other indicator organisms such as Salmonella and Shigellarevealed that these enteric pathogens were generally present in the creek waters around the St. Margaret village. The results from this study suggested that the water bodies are not safe for human consumption especially during rainy season.
Keywords: Watershed, Water Quality, Microbial Indicators, Rural Belize
Cite this paper: Karen Waight, Josue Ake, Joselyn Romero, Thippi Thiagarajan, A Preliminary Study of Water Quality in Rural Belize, Journal of Microbiology Research, Vol. 5 No. 2, 2015, pp. 41-45. doi: 10.5923/j.microbiology.20150502.01.
1. Introduction
- The availability of good quality potable water is an important feature for preventing diseases and improving quality of life for rural populations of the developing countries [1]. Natural water contains different types of impurities that are introduced in to the aquatic system by different ways such as weathering of rocks and leaching of soils, dissolution of aerosol particles from the atmosphere and from several human activities, including mining, processing and the use of metal based materials [2]. Drinking water pollution causes water born disease which has led to the death of millions of people [3]. Knowledge of the quality of a country's streams and aquifers is important because of the implications to human and aquatic health. Water quality refers to the chemical, physical and biological characteristics of water. It is most frequently referred to a set of standards against which compliance can be assessed. The most common standards used to assess the water quality relate to health of ecosystems, safety of human contact and drinking water [4]. Many studies describe associations between water quality indicators and health effects on human beings. Besides physical and chemical parameters, microbial water quality has been extensively studied in recent years [1, 5]. Most of these studies emphasize on correlation between water borne diseases and exposure to contaminated water sources [6, 7]. Indicator microorganisms such as total and fecal coliforms, and other GI tract related microbes have been used as bench mark for drinking water quality assessment in urban and rural areas [8, 9]. Belize is a small country with a population of approximately 341,000, of which more or less half live in urban areas and half in rural areas [10]. It has a very young population employed in agriculture, tourism, and the service sector. Belize is divided into 18 major watershed areas. These watersheds play a critical role in keeping the overall pristine nature of tropical ecosystem of Belize. Most of the rural populations in the country depend up on these watersheds for their livelihood. St. Margaret Village is a small rural community located in the Cayo District. The village has a population of approximately 1,500 inhabitants with about 250 households. People from St. Margaret village are not economically well-off and hence cannot afford to buy purified water. Most of the residents get drinking water from the closest river/creek that run adjoining the village on both sides, The villagers use water from both the Santa Martha River and the Dry Creek for various domestic purposes, without any concern for the water quality or the danger of getting water borne diseases. The Santa Martha River and Dry Creek originate from the nearby Maya Mountains (Figure 1) and are part of the Sibun River watershed.
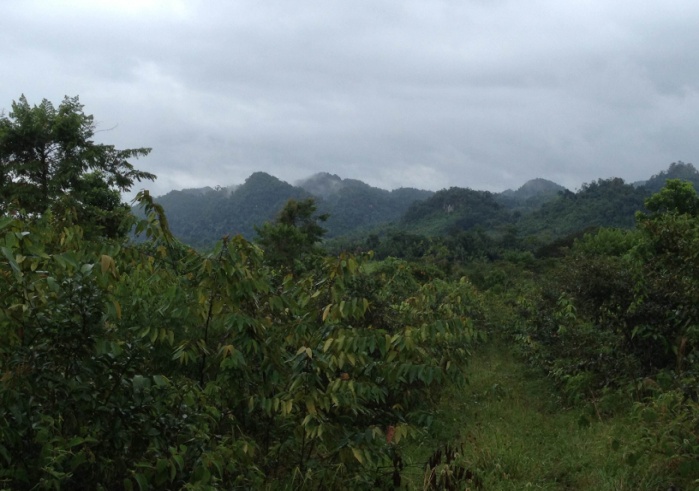 | Figure 1. The Maya Mountain – The Main Watershed of Sibun River |
2. Materials and Methods
- The overall objective of the study was to compare the physical, chemical and biological aspects of water quality of creeks/rivers around St. Margaret’s village, Cayo district during the wet and dry season. The study design consisted of an intensive water sampling from the creeks/rivers on a monthly basis for a period of 3 months during wet season (October – December) and 3 months during dry season (February to April). The total rainfall for the study area during the dry season (February to March) is between 150 to 200 mm and the total rainfall for the wet season (October to December) is about 800 mm [11]. The water level in the streams, creeks and rivers fluctuate greatly between the wet and dry season. Site Description:Sibun River watershed is one of the main watershed areas in the Central Belize and the tributaries of Sibun River passes through St. Margaret Village [12]. The Sibun watershed is mostly forest and marshland with some agriculture lands that are under milpa, citrus, cacao and pasture land. It can be up to 1000m in elevation at the highest point. Three sites were selected close to the St. Margaret village where the village people go frequently either for drinking purposes or for entertainment. Site 1 is 300 meters from the village on the west and it is used by the villagers for mostly drinking purpose. Site 2 is called the Dry Creek and this site is frequented by villagers for swimming/bathing purpose (Figure 2). Site 3 is called the Santa Martha River and this site is mainly used for swimming. Site 3 is the most frequently used site by the villagers. The GIS coordinates and the elevation data for the three selected study sites are given in table 1.
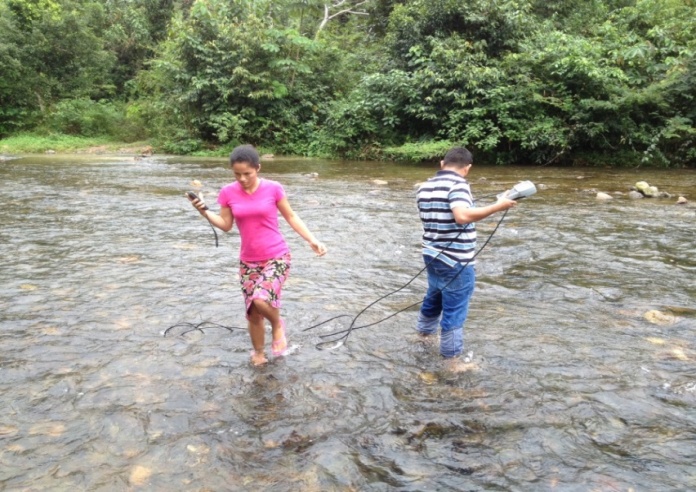 | Figure 2. The Dry Creek (Site 2) During Wet Season |
3. Results
- The results for physical, chemical and microbiological parameters were averaged and presented in tables and graphs as necessary. Table 2 summarizes the data for the physical parameters. Belize being a sub tropical country, the temperature remained between 22 and 29 degrees Celsius during the study period. The highest temperature was recorded in the month of April when the temperature was above 28℃. Similarly the pH was also highest during the month of April in all three sites studied. Site 1 and site 2 showed pH above 9 which suggests the water is alkaline. Since the watershed originates from calcium rich Maya Mountains, when the water level decreased, the pH increased. The water bodies were slightly acidic during the other months of the year. The turbidity was highest during the month of February at site 1 and site 3. Turbidity was lowest during November and December for all three sites.
| |||||||||||||||||||||||||||||||||||||||||||||||||||||||||||||||||||||||||||||||||||||||||||||||||||||||||||||||||||
| |||||||||||||||||||||||||||||||||||||||||||||||||||||||||||||||||||||||||||||||||||||||||||||||||||||||||||||||||||
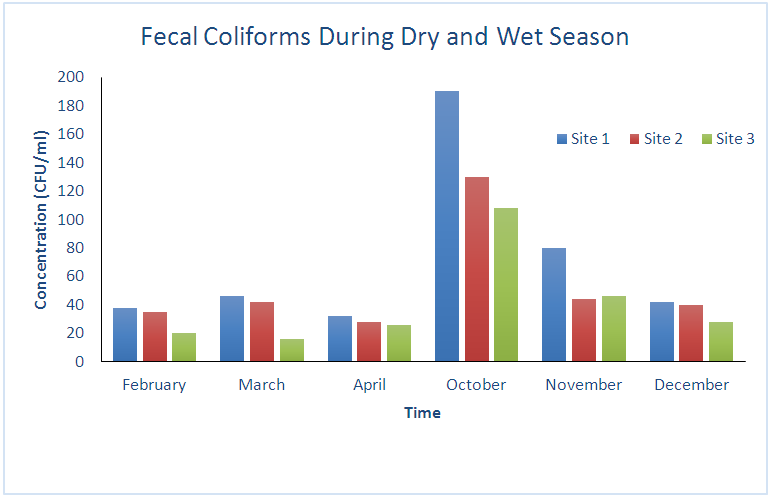 | Figure 3. Concentration of Fecal Coliforms During Wet and Dry Season |
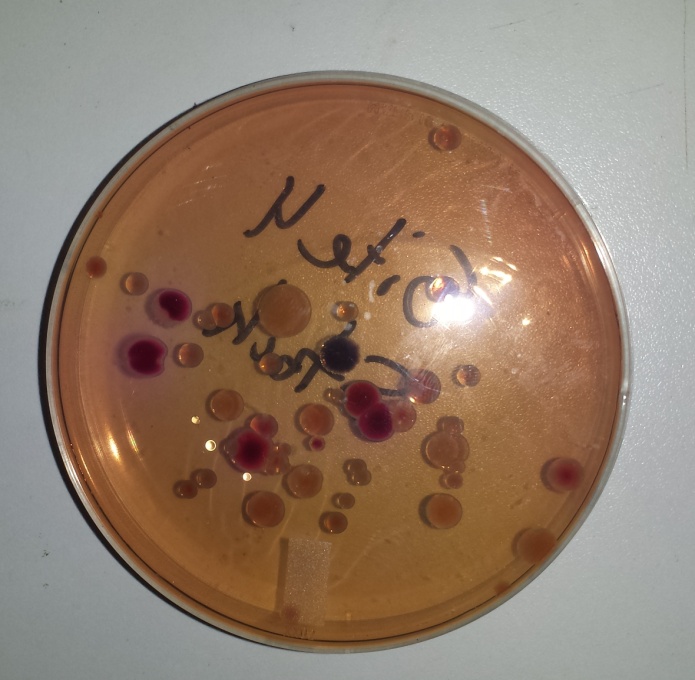 | Figure 4. Salmonella and Shigella on SS agar |
| |||||||||||||||||||||||||||||||||||||||||||
4. Discussion
- Availability of quality of water is an important component of human life. Water quality monitoring is the critical step towards creating awareness among the general public. Many studies relate fecal contamination of water bodies to enteric diseases in human populations [15 – 17]. Since microbial contamination was high during the wet season it can be inferred that these ailments are related to consumption of contaminated water. Our survey results support that inference. Rain fall has a direct impact on the nutrient leaching and fecal contamination of water bodies as run-off water carries human and animal waste in to the nearby water bodies [18]. Since farming activities are found around the watershed area of St. Margaret village, there is high chance of animal fecal contamination reaching the creeks during rainy season. Water quality monitoring is necessary for prevention of waterborne diseases and organisms such as Shigella and Salmonella are important indicator microorganisms in that exercise [19].
5. Conclusions
- Water quality monitoring is an expensive process because of the significant costs associated with the constant testing as well as development and implementation of regulations. Many people living in rural Belize do not have access to treated potable water. The main source of water for rural population is mainly nearby rivers and creeks. These water bodies are used for recreational as well as domestic purpose including drinking water. The study highlights the need for awareness of water quality for the people living in the villages of Belize. Government also ought to provide healthy drinking water for the public to avoid serious health risk associated with the consumption of contaminated water.
References
| [1] | Oluduro, A. O., Adewoye, B. I., 2007, Efficiency of moringa Oleifera Seed extract on The microflora of surface and ground water, Journal of plant Science, 6, 453-438. |
| [2] | Asaolu, S.S., Ipinmoroti, K.O., Adeyinowo C. E,, Olaofe, O., 1997, Interrelationship 0f heavy metals concentration in water, sediment as fish samples from Ondo State coastal Area, Nigeria, African Journal of Science 1, 55-61. |
| [3] | Adefemi, S.O, Awokunmi, E.E., 2010, Determination of physico-chemical parameters and heavy metals in water samples from Itaogbolu area of Ondo-State, Nigeria, African Journal of Environmental Science and Technology, 4(3), 145-148. |
| [4] | World Health Organisation. “Guidelines for Drinking Water Quality”. 2nd edition. Health Criteria and Other Supporting Information. WHO, Geneva, 1996, 2, 940-949. |
| [5] | Obire, M. A., and Puthetti, R.R., 2008, The impact of human activities on drinking water quality Journal of Basic and Applied Biology, 2 (4), 52-58. |
| [6] | Farley, K. A., Jobba´gy, E. G., Jackson, R. B., 2005. Effects of afforestation on water yield: a global synthesis with implications for policy, Global Change Biology, 11, 1565–1576. |
| [7] | Wade, T. J., Calderon, R.L., Brenner, K.P., Sams, E., Beach, M., Haugland, R., Wymer, L. and A. P. Dufour, 2008, High Sensitivity of Children to Swimming-Associated Gastrointestinal Illness Results Using a Rapid Assay of Recreational Water Quality. Epidemiology, 19, 375-383. |
| [8] | Kinzelman, J., Ng, C., Jackson, E., Gradus, S., and Bagley, R., 2003, Enterococci as Indicators of Lake Michigan Recreational Water Quality; Comparison of Two Methodologies and Impact on Public Health Regulatory Events, Applied. Environmental Microbiology 69(1), 92-96. |
| [9] | Lyon, J.P., and O'Connor, J.P., 2008, Smoke on the water: Can riverine fish populations recover following a catastrophic fire-related sediment slug? Austral Ecology, 33(6), 794-776. |
| [10] | Statistical Institute of Belize, 2010, Population and Housing Censes, Report 2010, P. |
| [11] | Belize Meteorological Service, 2014:http://www.hydromet.gov.bz/monthly-rainfall-summary. |
| [12] | Boles, Ed, 1999, The Sibun River Watershed Atlas, Sibun Watershed Association and The Government Printer, Belmopan, Belize. |
| [13] | Eaton, A. D., Clesceri, L.S., Greenberg, A. E. (eds.). 1995. Standard methods for the examination of water and wastewater, 19th ed. American Public Health Association, Washington, D.C. |
| [14] | Murray, P.R., Baron, E.J., Pfaller, M.A., Tenover, F.C., Yolken R.H. (eds.). 1999, Manual of clinical microbiology, 7th ed. American Society for Microbiology, Washington, D. C. |
| [15] | Bain R., Cronk R., Wright J., Yang H., Slaymaker T., 2014, Fecal Contamination of Drinking-Water in Low- and Middle-Income Countries: A Systematic Review and Meta-Analysis, PLoS Med, 11(5), e1001644. doi:10.1371/journal.pmed.1001644. |
| [16] | Gwimbi, P., 2011, The microbial quality of drinking water in Manonyane community: Maseru District (Lesotho), African Health science (3), 474 – 480. |
| [17] | Mitch, A.A., Gasner, K.C., Mitch. W.A., 2010, Fecal coliform accumulation within a river subject to seasonally-disinfected wastewater discharges. Water Research. 44 (16), 4776 - 4782. |
| [18] | Hill, D.D., Owens, W. E., and Tchounwou, P.B., 2006, The impact of rainfall on fecal coliform bacteria in Bayou, Dorcheat (North Louisiana), International Journal of Environmental Research and Public Health 3 (1), 114 – 117. |
| [19] | Cabral, J.P., 2010, Water microbiology, Baterial Pathogens and Water, International Journal of Environmental research and Public Health, 7 (10), 3657 – 3703. |