-
Paper Information
- Previous Paper
- Paper Submission
-
Journal Information
- About This Journal
- Editorial Board
- Current Issue
- Archive
- Author Guidelines
- Contact Us
Journal of Microbiology Research
p-ISSN: 2166-5885 e-ISSN: 2166-5931
2014; 4(4): 161-169
doi:10.5923/j.microbiology.20140404.02
Toxicity of Binary Mixtures of Formulated Glyphosate and Phenols to Rhizobium Species Dehydrogenase Activity
 Abstract
 Reference
 Full-Text PDF
 Full-text HTML
C. O. Nweke 1, N. C. Ahumibe 2, J. C. Orji 1
1Department of Microbiology, Federal University of Technology, P.M.B. 1526, Owerri, Nigeria
2Department of Biotechnology, Federal University of Technology, P.M.B. 1526, Owerri, Nigeria
Correspondence to: C. O. Nweke , Department of Microbiology, Federal University of Technology, P.M.B. 1526, Owerri, Nigeria.
| Email: |  |
Copyright © 2014 Scientific & Academic Publishing. All Rights Reserved.
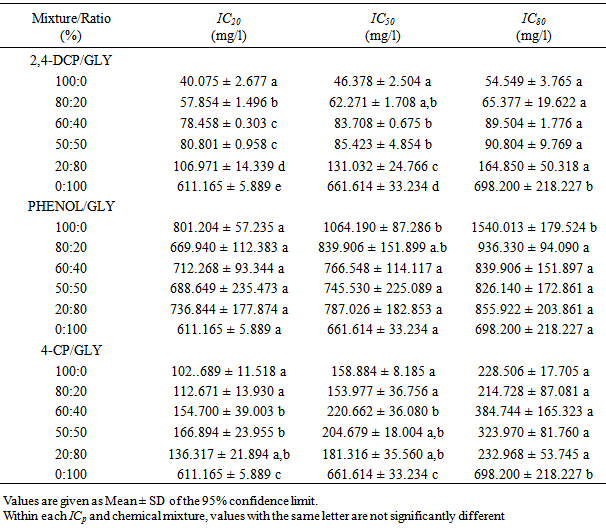
Acute toxicities of formulated glyphosate (Roundup®) in binary mixtures with 2,4-dichlorophenol, 4-chlorophenol and phenol were determined based on inhibition of 2-(p-Iodophenyl)-3-(p-nitrophenyl)-5-phenyl tetrazolium chloride (INT)-dehydrogenase activity in Rhizobium species. The phenolic compound: glyphosate mixture ratios (%) were 100:0, 20:80, 50:50, 60:40, 20:80 and 0:100 for the respective mixtures in the concentration range of 0 – 5000 mg/l. The effective doses (ICps) were estimated using hormetic dose-response model. The median inhibitory concentrations (IC50) of the formulated glyphosate, phenol, 4-chlorophenol and 2,4-dichlorophenol were 661.614 ± 33.234 mg/l, 1064.190 ± 87.286 mg/l, 158.884 ± 8.185 mg/l and 46.378 ± 2.504 mg/l respectively. The joint action toxicity of the mixtures on test organism was evaluated with isobolographic representations and toxicity index (TI) model. The isobole analysis indicated additive interaction between glyphosate and phenol. With the exception of 20:80 of 2,4-dichlorophenol:glyphosate mixture ratio that was synergistic, other ratios of the mixture were additive. A synergistic (especially 20:80 4-CP:glyphosate mixture) and additive interaction was observed for some ratios of glyphosate and 4-chlorophenol mixtures. However, the TI of most isoboles are within the range of 0.5 – 2.0 and are considered additive. Synergistic and additive interaction of formulated glyphosate with intermediates of 2,4-D was possible against the dehydrogenase activity of Rhizobium species, an important soil bacterium. The dynamics of the toxic effects thus would depend on the relative amounts of these compounds.
Keywords: Roundup®, Herbicides, Dehydrogenase Activity, Phenols, Toxicity
Cite this paper: C. O. Nweke , N. C. Ahumibe , J. C. Orji , Toxicity of Binary Mixtures of Formulated Glyphosate and Phenols to Rhizobium Species Dehydrogenase Activity, Journal of Microbiology Research, Vol. 4 No. 4, 2014, pp. 161-169. doi: 10.5923/j.microbiology.20140404.02.
Article Outline
1. Introduction
- Increased application of herbicides for improved and sustained agriculture has resulted in the contamination of agricultural soils with organic and inorganic pollutants. One of most commonly used herbicide is glyphosate (N-phosphonomethylglycine), a post-emergence herbicide. Glyphosate is desirable due to its effective control of weeds, rapid inactivation in soil and low mammalian toxicity [1, 2]. However, environmental concern over glyphosate has grown due to its undesirable side effects on non-target organisms and persistence in soil and groundwater [3]. Glyphosate inhibits amino acid synthesis in bacteria and fungi via the enzyme, 5-enolpyruvyl-shikimate-3-phosphatase synthase in shikimic acid pathway [4, 5]. However, applications of glyphosate at high rate have been reported to stimulate microbial respiration [6, 7].Glyphosate is often used in mixture with other herbicides such as 2,4-dichlorophenoxyacetic acid (2,4-D) amines and esters to widen spectrum, improve herbicide action and save cost [8, 9]. In one of its commercial formulations, Roundup®, glyphosate is formulated as isopropylamine (IPA) salt of glyphosate (36% glyphosate a.i.) and a surfactant, polyoxyethyleneamine (POEA). The increased toxicity of this glyphosate formulation in comparison to glyphosate is attributed to the surfactant component [10]. Field application of glyphosate at recommended rates have been generally found to be non- toxic to soil microorganisms [11].Both antagonistic and synergistic effect of 2,4-D on glyphosate activity have been reported. Glyphosate and 2,4-D mixture has resulted in reduced herbicide activity against grass compared to glyphosate applied alone [12, 13] but 2,4-D enhanced the activity of glyphosate against Rape [12]. Glyphosate applied with 2,4-D increased leafy Spurge control by 10-fold after 3 months of exposure compared to glyphosate alone [8]. Combinations of glyphosate with 2,4-D was generally more effective against cutleaf eveningprimrose than glyphosate applied alone [14]. Synergistiic effect of 2,4-D and glyphosate mixture against Brazil Pusley has also been reported by Sharma and Singh [15]. The environmental fate of these herbicides includes degradation by plants and microorganisms, hydrolysis and photolysis. A wide range of microorganisms have been reported to degrade glyphosate, 2,4-D and other herbicides in soil. Phenoxy herbicides are degraded to phenolic intermediates, some of which have toxicological significance. Microorganisms degrades 2,4-dichlorophenoxyacetic acid to 2,4-dichlorophenol [16]. The 2,4-dichlorophenol can be degraded to 4-chlorophenol and then phenol [17–19]. Herbicides may remain in soil for variable periods depending on application rates, soil and environmental conditions. Generally, glyphosate is moderately persistent in soil. The half-life of glyphosate in soil has been widely studied and values between 2 and 197 days have been reported in the literature [20–23]. The amine salts and esters of 2,4-D are not persistent under most environmental conditions. Soil half-life values have been estimated at 10 days for the acid, diethylamine salt, and ester forms [24]. Another study estimated a soil half-life for the ester form ranging from 1-14 days with a median half-life of 2.9 days. In aerobic mineral soils, a half-life of 6.2 days was estimated.Thus 2,4-dichlorophenol, 4-chlorophenol, phenol and other phenolic compounds could coexist with glyphosate where glyphosate is applied as mixture with 2,4-D and other phenoxy herbicides. It is therefore important to assess the toxicity interactions of glyphosate with these phenolic intermediates on non-target soil microorganisms. To the best of our knowledge, much work has not been done in this regard. In this study, we evaluated the toxicity of glyphosate as active ingredient in Roundup®, alone and in mixture with 2,4-dichlorophenol, 4-chlorophenol and phenol based on inhibition of dehydrogenase activity in Rhizobium species, an important soil bacterium.
2. Materials and Methods
2.1. Test Organism
- The test organism, Rhizobium species was isolated from the root nodule of mature Vigna unguiculata. The nodules were washed thoroughly with sterile distilled water and surface disinfected in sterile culture tubes with 75 % ethanol for 5 minutes. After thoroughly rinsing with sterile distilled water, the nodules were crushed with sterile glass rod. The resultant suspension was streaked onto yeast extract mannitol (YEM) agar plates (HiMedia) and incubated for 48 h at room temperature (28 ± 2℃). The culture was purified and characterized biochemically using standard microbiological methods. Pure cultures of the organism were stored on YEM agar slants at 4℃.
2.2. Preparation of Inoculum for Toxicity Assay
- A 24-h culture of Rhizobium species grown in nutrient broth on a rotary shaker (150 rpm) at room temperature was harvested by centrifugation (3500 rpm, 10 min). Harvested cells were washed twice in sterile distilled water and suspended therein. The optical density (A540) of the cell suspension was adjusted to 0.2.
2.3. Binary Mixture Ratios
- The binary mixtures consisted of phenolic compounds and glyphosate (as active ingredient in formulated glyphosate pesticide, Roundup). The phenolic compounds included 2,4-dichlorophenol (2,4-DCP), 4-chlorohenol (4-CP) and phenol. The binary mixtures were studied as a function of the following weight to weight ratios: p (%) = 100, 80, 60, 50, 20, and 0 of 2,4-dichlorophenol, 4-chlorophenol or phenol, and 100-p (%) of glyphosate corresponding to phenolic compound: glyphosate ratios of: 100:0 %, 80:20 %, 60:40 %, 50:50 %, 20:80 % and 0:100 %.
2.4. Dehydrogenase Activity Assay
- 2-(p-Iodophenyl)-3-(p-nitrophenyl)-5-phenyl tetrazolium chloride (INT)-dehydrogenase activity assay was done in 2-ml volumes of phosphate-buffered (pH 7) nutrient broth supplemented with varying concentrations of 2,4-dichlorophenol, 4-chlorophenol, phenol and/or glyphosate (as active ingredient in formulated glyphosate pesticide, Roundup). A 0.5 ml portion of X4-strength nutrient broth and requisite volumes of distilled water and stock solutions (200 and 8000 mg/l) of respective phenolic compound and/or glyphosate were added to each tube to obtain the different binary mixtures of phenolic compound: glyphosate ratios. Thereafter, 0.1ml each of 0.2% aqueous solution of INT and bacterial suspension were added into each tube. The final concentrations of the toxicants ranged from 0 to 5000 mg/l. The controls consisted of the medium without phenols or glyphosate. The cultures were incubated at room temperature (28 ± 2℃) for 24 h. After incubation, the INT formazan (INTF) produced was extracted in 8 ml of amyl alcohol. Absorbance of the extract was determined spectrophotometrically at 500 nm (Turner, model 390).
2.5. Estimation of Relative Response
- The dehydrogenase activities at varying concentrations of the individual component and binary mixtures of glyphosate with 2,4-dichlorophenol, 4-chlorophenol or phenol were calculated relative to the control as shown in equation 1. The relative responses were generated as mean and their standard deviations from triplicate determinations.
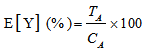 | (1) |
2.6. Data Analysis
2.6.1. Determination of Toxicity Thresholds
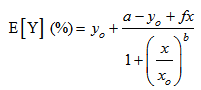
- The dose-relative response data were tested with 4-parameter logistic model (eq. 2).
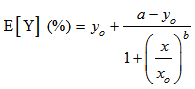 | (2) |
 | (3) |
 | (4) |
 | (5) |
2.6.2. Determination of Toxic Unit (TU)
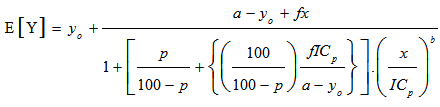
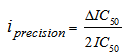
- The toxicities of the mixture components expressed in TU for a given ICp were calculated from equations 6 and 7.
 | (6) |
 | (7) |
 | (8) |
 | (9) |
2.6.3. Isobolographic Analysis of the Mixture Toxicities
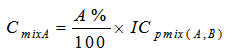
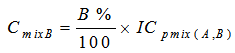
- The estimated IC50 and TU values were used in subsequent determination of isoboles and isobolographic analysis of the mixture toxicity. The TU values of the binary mixtures are plotted in an isobologram as described by Boillot and Perrodin [28]. The straight line joining the TU of component A on one axis and TU of component B on the other axis is called an additivity line representing the additive effect of the mixture. When the TUs data point (TU of component A versus TU of component B) plotted in the isobologram is below or above the additivity line, the interactions are taken to be synergistic or antagonistic respectively. Similarly, CmixA versus CmixB isoboles were plotted and the straight line joining IC50A on one axis and IC50B on the other axis is the line of additivity. Isoboles below and above this line are due to synergistic and antagonistic interactions respectively.
2.6.4. Analysis of Combined Effects Using Toxic Index Model
- Toxic index (TI) model was also used to analyze the combined effect of the binary mixtures. The TI values were calculated as follows (equation 10):
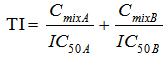 | (10) |
3. Results
3.1. Ecotoxicity of the Substances
- The responses of the dehydrogenase activities (DHA) of Rhizobium species to the stress of glyphosate, 2,4-dichlorophenol, 4-chlorophenol and phenol as individual substances and the mixtures showed that the substances had biphasic effect on the enzyme activity (Fig. 1). DHA were stimulated at low doses (hormesis) and inhibited at high doses. As individual substances, glyphosate, phenol, 4-chlorophenol and 2,4-dichlorophenol stimulated the enzyme activity at concentrations up to 400 mg/l, 600 mg/l, 60 mg/l and 20 mg/l respectively. At concentrations above the hormetic range, glyphosate and phenols progressively inhibited dehydrogenase activity of the Rhizobium species, reaching saturations at 1200 mg/l for glyphosate and 4-CP, 400 mg/l for 2,4-DCP and 3000 mg/l for phenol.
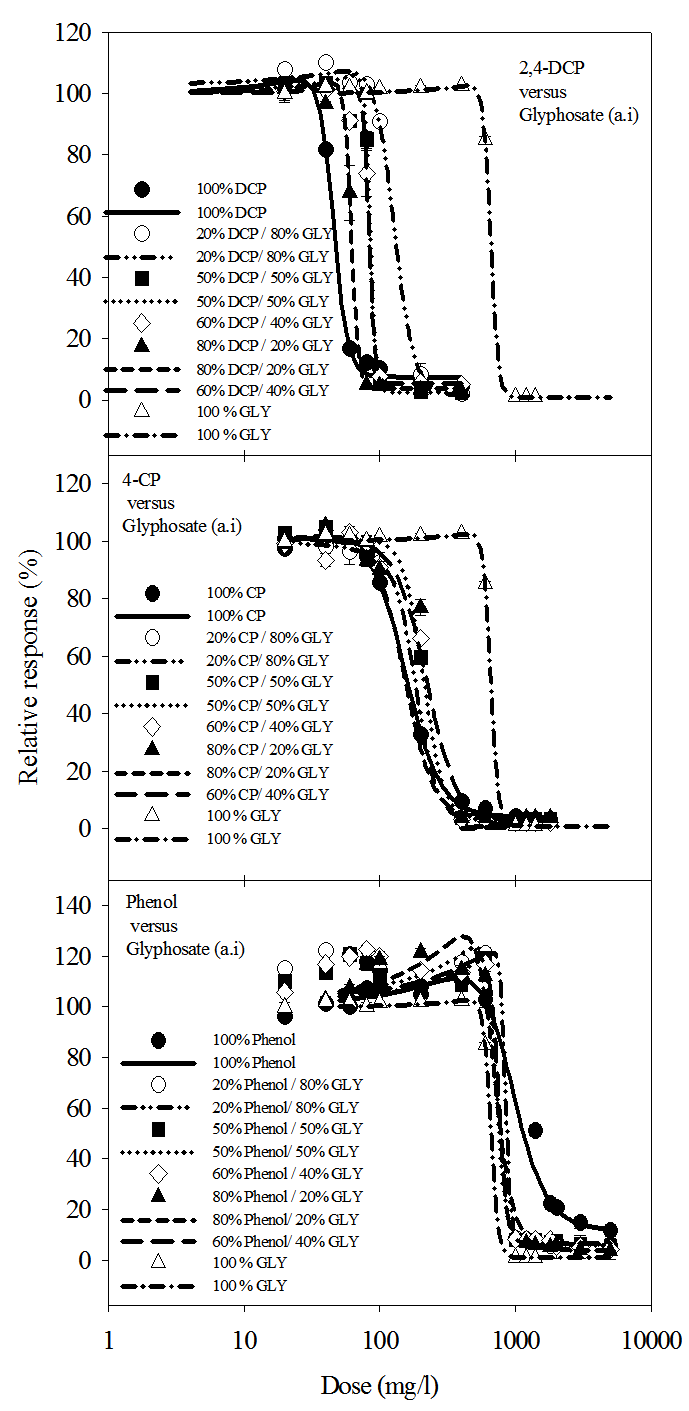 | Figure 1. Experimental (data points) and model-predicted (lines) [eq. 3] toxicity of glyphosate (GLY), 2.4-dichlorophenol (DCP), 4-chlorophenol (CP) and phenol as individual substances and their mixtures to the dehydrogenase activity of Rhizobium species |
3.2. Isobolographic Analysis of the Mixture Toxicities
- The isobolographic analysis of the mixtures based on IC50 and TU values are shown in Figs. 2 and 3. Fig. 2 shows the isobologram based on the IC50 values of individual substance and the mixtures. The isobolograms showed similar patterns of additivity, synergism and in some cases antagonism especially for the 2,4-DCP/glyphosate mixtures. Based on the IC50 values, the isobologram showed synergistic effect of 20% 2,4-DCP/80% glyphosate, 20% 4-CP/80% glyphosate and 50% 4-CP/50% glyphosate mixture concentration ratios. On the other hand, at concentrations of 80% 2,4-DCP/20% glyphosate and 60% 2,4-DCP/40% glyphosate, the effects of the compounds are antagonistic while at a mixture concentration of 50% 2,4-DCP/50% glyphosate, the effect was additive. The isobologram of phenol/glyphosate mixtures showed slight antagonistic and synergistic actions, with some values lying within the additivity line.
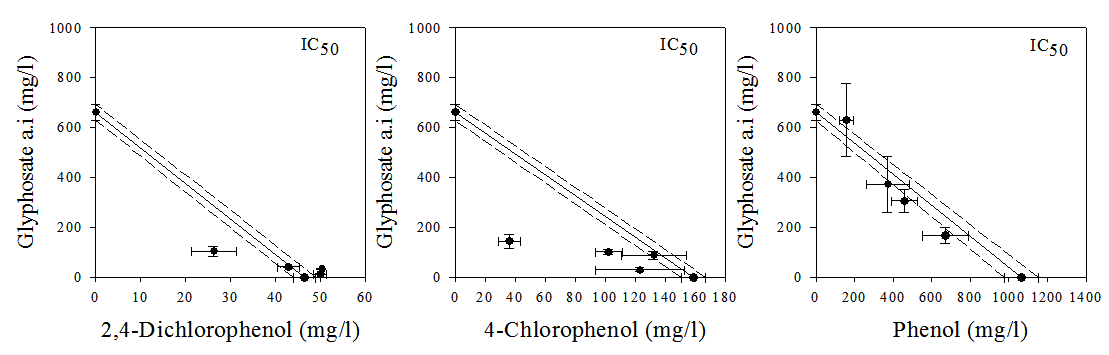 | Figure 2. The IC50 isobole representations for glyphosate and phenols as individual and mixtures tested against dehydrogenase activity of Rhizobium species. The bars represent the standard deviations of the 95% confidence interval of the values. The solid and dotted lines represents additivity line and its 95% confidence belt |
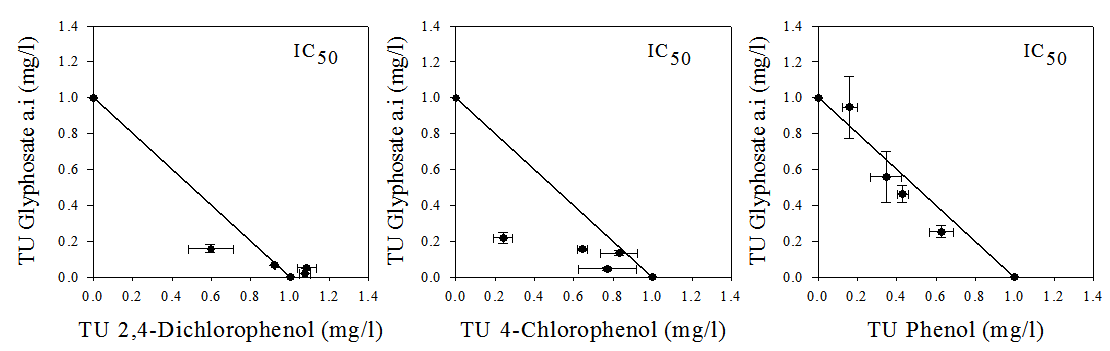 | Figure 3. IC50 Toxic units (TU) isobole representations of binary combinations of glyphosate and phenolic compounds on Rhizobium species dehydrogenase activity |
3.3. The Toxicity Index
- According to the TI model, both synergistic and antagonistic effects were observed in the mixtures (Fig. 4). The TI values ranged between 0.720 ± 0.099 to 1.136 ± 0.052 for 2,4-DCP/glyphosate mixture, 0.881 ± 0.096 to 1.093 ± 0.197 for phenol/glyphosate mixture and 0.445 ± 0.065 to 0.963 ± 0.109 for 4-CP/glyphosate mixture. The effects of 20% 2,4-DCP/80% glyphosate, 50% 2,4-DCP/50% glyphosate, 60% phenol/40% glyphosate and 80% phenol/20% glyphosate mixtures were synergistic while the effects of 60% 2,4-DCP/40% glyphosate and 80% 2,4-DCP/20% glyphosate mixtures were antagonistic. With exception of 60% 4-CP/40% glyphosate, synergistic effect was observed in the 4-CP/glyphosate mixtures.
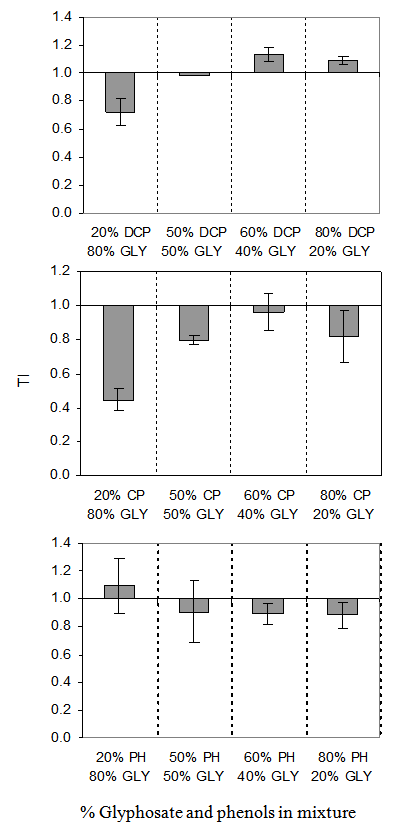 | Figure 4. IC50 Toxic Index (TI) of glyphosate (GLY) in binary mixture with 2, 4-dichlorophenol (DCP), 4-chlorophenol (CP) and phenol (PH) |
4. Discussion
- The DHA of Rhizobium species showed biphasic effects upon exposure to glyphosate and phenolic compounds applied singly and as mixtures. Biphasic response to chemicals is a phenomena widely occurring in microorganisms and higher forms of life [29]. Stimulation of DHA at low doses (hormesis) observed in this study is in line with reported hormetic effects of glyphosate and phenolic compounds on microorganisms. Hormetic effects of phenol and 3,5-dichlorophenol on immobilized bioluminescent Vibrio fischeri was reported by Christofi et al. [30]. A time-dependent hormetic effect of phenol on dehydrogenase activity was observed in Bacillus species, Pseudomonas species and microbial communities of petroleum refinery wastewater [31]. At 20 mg/l, 2-chlorophenol and 4-chlorophenol was reported to stimulate dehydrogenase activity in Pseudomonas species [32]. At 50 mg/l, glyphosate stimulated mycelial growth of lignicolous freshwater fungi, Camposporium antennatum and Helicospouim griseum [33]. Application of glyphosate to soil led to a significant increase in dehydrogenase activity with respect to untreated control soil samples and at concentrations up to 50 mM, respiration rates increased with increasing glyphosate application [34]. The in vitro inhibition of dehydrogenase activity observed in this study at high concentrations of glyphosate and phenols is consistent with what has been reported elsewhere. Glyphosate is reportedly more toxic to microorganisms when grown in soil-free medium [7]. Phenols are notable membrane-damaging microbiocide [35-37], causing loss of cytoplasmic membrane integrity and thus disruption of membrane functions. Since dehydrogenase enzymes are membrane associated, loss of membrane integrity will ultimately affect their activity. The order of toxicity for phenols (2,4-dichlorophenol > 4-chlorophenol > phenol) is in line with reported higher toxicity of substituted phenols than phenol against microorganisms [38-40]. The range of IC50 values observed for the individual compounds (1064. 19 mg/l for phenol and 46. 378 mg/l for 2,4-DCP) were within the range reported by other researchers. An IC50 of 608.1 mg/l phenol, based on inhibition of oxygen uptake in activated sludge was reported by Chan et al. [41]. A 24-h IC50 ranging from 527.881 ± 56.462 mg/l to 1400.203 ± 15.468 mg/l phenol was reported against dehydrogenase activity in petroleum refinery wastewater bacteria [31]. Most of the toxicity reports against bacteria dealt with glyphosate as a single agent. However, in the natural environment, microorganisms are exposed to mixtures of chemicals which have toxicities different from those of their individual components. These chemicals may also interact to modulate the toxicity of each other in a mixture. This has been established in this study with the formulated glyphosate and the three phenolic compounds tested. Glyphosate modulated the toxicity of 2,4-dichlorophenol, 4-chlorophenol and phenol and vice versa producing synergistic and antagonistic effects. This modulation however, seem to be dependent on the relative proportions of the most toxic and least toxic components.The isobolographic analysis of the IC50 and TU values as well as the TI model used to analyse mixture toxicity indicated similar results with regards to the toxicity of phenols and glyphosate mixture against the dehydrogenase activity in Rhizobium species. Although there were seemingly synergistic and antagonistic responses to the joint action of the mixture, the TI values (between 0.720 ± 0.099 to 1.136 ± 0.052 for 2,4-DCP/glyphosate mixture; 0.881 ± 0.096 to 1.093 ± 0.197 for phenol/glyphosate mixture and 0.445 ± 0.065 to 0.963 ± 0.109 for 4-CP/glyphosate mixture) are included within the interval 0.5 – 2.0 proposed by Deener [42] as additive. In the case of 4-CP and glyphosate, all the TI values except 0.445 ± 0.065 are entirely within the 0.5 – 2.0 range. This indicates a seemingly marginal synergistic action of the 20% 4-CP/80% glyphosate mixture. Considering the 0.5 – 2.0 range of TI values, most isoboles obtained in this study against Rhizobium species dehydrogenase activity are not very far from additive line and thus the effects of combined substances are considered additive. Similar conclusion was made by Boillot and Perodin [28] on a seemingly antagonistic interaction between glutaraldehyde and surfactants against mobility of Daphnia magna.
5. Conclusions
- The aim of this study was to assess the ecotoxicity of glyphosate as an active ingredient in Roundup®, three phenolic compounds (2,4-dichlorophenol, 4-chlorophenol and phenol) and binary mixtures of phenols and glyphosate on the dehydrogenase activity of Rhizobium species. The results showed that the toxicity of the toxicants over 24 h period can be ranked as 2,4-DCP > 4-CP > glyphosate > phenol. The analyses indicated possibility of synergistic, additive and antagonistic actions depending on the relative ratios of the individual components. However, TI model and isobolographic representations lead to the conclusion that the joint action of the mixtures on Rhizobium species dehydrogenase activity is additive. This information constitutes an essential contribution towards assessing the environmental risk of 2,4-DCP, 4-CP, phenol and glyphosate, especially as the possibility of co-contamination of natural media with these chemicals exist when glyphosate and 2,4-D are applied as pesticide mixtures. Natural processes that modulate the residual amounts of these herbicides in environmental media may play crucial role in the overall response of microorganisms to the toxicity of these chemicals. To enlarge the conclusion of this study, joint action of these toxicants on microbial community of soil and aquatic environment is needed.
References
| [1] | Torstensson, L., Behavior of glyphosate in soils and its degradation. In: Grossbard, E., Atkinson, D. (Eds.), The Herbicide Glyphosate. Butterworths, Boston, pp. 137 – 150, 1985. |
| [2] | Levesque, C.A., and Rahe, J.E., 1992, Herbicide interactions with fungal root pathogens, with special reference to glyphosate. Ann. Rev. Phytopath. 30, 579 – 602. |
| [3] | Vereecken, H., 2005, Mobility and leaching of glyphosate: a review. Pest Manag. Sci. 61, 139 – 1151. |
| [4] | Bentley, R., 1990, The shikimate pathway– a metabolic tree with many branches. Crit. Rev. Biochem. Mol. Biol. 25, 307 – 308. |
| [5] | Franz, J. E., Mao, M.K., and Sikorski, J.A., Glyphosate: a unique herbicide. American Chemical society Monograph 189. American chemical society, Washington DC., 1997. |
| [6] | Haney, R. L., Senseman, S. A., Hons, F. M., and Zuberer, D. A., 2000, Effect of glyphosate on soil microbial activity and biomass. Weed Sci. 48, 89 – 93. |
| [7] | Busse, M. D., Ratcliff, A. W., Shestak, C. J. and Powers, R. F., 2001, Glyphosate toxicity and the effects of long-term vegetation control on soil microbial communities. Soil Biol. Biochem. 33, 1777 – 1789. |
| [8] | Lym, R. G., 2000, Leafy spurge (Euphorbia esula) control with glyphosate plus 2,4-D. J. Range Manage. 53, 66 – 72. |
| [9] | Espinoza, N., and Mera, M., Some broadleaf herbicides used in mixtures with glyphosate may hinder the growth of narrow-leafed lupin. In: J.A. Palta and J.B. Berger (eds). 2008. ‘Lupins for Health and Wealth’ Proceedings of the 12th International Lupin Conference, 14-18 Sept. 2008, Fremantle, Western Australia. International Lupin Association, Canterbury, New Zealand, 2008. |
| [10] | Tsui, M. T. K., and Chu, L. M., 2003, Aquatic toxicity of glyphosate-based formulations: comparison between different organisms and the effects of environmental factors. Chemosphere 52, 1189 – 1197. |
| [11] | Ratcliff, A.W., Busse, M. D., and Shestak, C. J., 2006, Changes in microbial community structure following herbicide (glyphosate) additions to forest soils. Appl. Soil Ecol. 34, 114 – 124. |
| [12] | O'Sullivan, P. A., and O'Donovan, J. T., 1980, Influence of various herbicides and Tween 20 on the effectiveness of glyphosate. Can. J. Plant Sci. 60, 939 – 945. |
| [13] | Flint, J. L., and Barrett, M., 1989, Antagonism of glyphosate toxicity to johnsongrass by 2,4-D and dicamba. Weed Sci. 37, 700 – 705. |
| [14] | Reynolds, D., Steve, C., and Jordan, D., 2000, Cutleaf eveningprimrose control with preplant burndown herbicide combinations in cotton. The Journal of Cotton Science 4, 124 – 129. |
| [15] | Sharma, S. D., and Singh, M., 2001, Surfactants increase toxicity of glyphosate and 2,4-D to Brazil Pulsey. HortScience 36(4), 726 – 728. |
| [16] | Daugherty, D., and Karel, S., 1994, Degradation of 2,4-dichlorophenoxyacetic acid by Pseudomonas cepacia DBO1 (pRO101) in a dual-substrate chemostat. Appl. Environ. Microbiol. 60, 3261 – 3267. |
| [17] | Kohring, G-W., Zhang, X., and Wiegel J., 1989, Anaerobic dechlorination of 2,4-dichlorophenol in freshwater sediments in the presence of sulphate. Appl. Environ. Microbiol. 55(10), 2735 – 2737. |
| [18] | Zhang, X., and Wiegel, J., 1990, Sequential anaerobic degradation of 2,4-dichlorophenol in freshwater sediments. Appl. Environ. Microbiol. 56(4), 1119 – 1127 |
| [19] | Fukumori, F., and Hausinger, R., 1993, Alcaligenes eutrophus JMP134 “2,4- dichlorophenoxyacetatemonooxygenase” is an α-ketoglutarate-dependent dioxygenase. J. Bacteriol. 175, 2083 – 2086. |
| [20] | U.S.D.A., Forest Service, Pesticide background statements. p. G1-G72. In Agriculture Handbook No. 633. Vol. 1. Herbicides. Part 2, 1984. |
| [21] | WHO, Environmental Health Criteria 159, Toxicological Evaluations - Glyphosate; International Programme on Chemical Safety, World Health Organization: Geneva, Switzerland, 1988. |
| [22] | U.S. EPA, Pesticide Fact Handbook. Vol. 2. p. 301-312. Noyes Data Corporation. Park Ridge, New Jersey, 1990. |
| [23] | Giesey, J. P., Dobson, S., and Solomon, K. R., 2000, Ecotoxicological risk assessment for Roundup herbicide. Rev. Environ. Contam. Toxicol. 167, 35 – 120. |
| [24] | U.S. EPA, Reregistration Eligibility Decision (RED) 2,4-D; EPA 738-R-05-002; U.S. Environmental Protection Agency, Office of Prevention, Pesticides and Toxic Substances, Office of Pesticide Programs, U.S. Government Printing Office: Washington, DC, 2005. |
| [25] | Brain, P., and Cousens, R., 1989, An equation to describe dose responses where there is stimulation of growth at low doses. Weed Res. 29, 93 – 96. |
| [26] | Cedergreen, N., Ritz, C. and Streibig, J. C., 2005, Improved empirical models describing hormesis. Environ. Toxicol. Chem. 24(12), 3166 – 3172. |
| [27] | Schabenberger, O., Tharp, B. E., Kells, J. J., and Penner, D., 1999, Statistical test for hormesis and effective dosages in herbicide dose–response. Agron. J. 91, 713–721. |
| [28] | Boillot, C., and Perrodin, Y., 2008. Joint-action ecotoxicity of binary mixtures of glutaraldehyde and surfactants used in hospitals: use of the Toxicity Index model and isobologram representation. Ecotoxicol. Environ. Saf. 71, 252 – 259. |
| [29] | Calabrese, E. J., and Blain, R., 2005, The occurrence of hormetic dose responses in the toxicological literature, the hormesis database: an overview. Toxicol. Appl. Pharmacol. 202, 289– 301. |
| [30] | Christofi, N., Hoffmann, and C., Tosh, L., 2002, Hormesis responses of free and immobilized light-emitting bacteria. Ecotoxicol. Environ. Saf. 52, 227 – 231. |
| [31] | Nweke, C.O., and Okpokwasili, G.C., 2010a, Influence of exposure time on phenol toxicity to refinery wastewater bacteria. J. Environ. Chem. Ecotoxicol. 2(2), 20 – 27. |
| [32] | Nweke, C.O., and Okpokwasili, G. C., 2010b, Inhibition of dehydrogenase activity in petroleum refinery wastewater bacteria by phenolic compounds. Ambi-Água 5(1), 6-16. |
| [33] | Tsui, K. M. C., Kevin D. H., and Hodgkiss I. J., 2001, Effects of glyphosate on lignicolous freshwater fungi of hong Kong. Sydowia 53(1), 167 – 174. |
| [34] | Partoazar, M., Hoodaji M., and Tahmourespour, A., 2011, The effect of glyphosate application on soil microbial activities in agricultural land. Afr. J. Biotechnol. 10(83), 19419 – 19424. |
| [35] | Keweloh, H., Weyrauch, G., and Rehm, H. J., 1990, Phenol induced membrane changes in free and immobilized Escherichia coli. Appl. Microbiol. Biotechnol. 33, 65 – 71. |
| [36] | Heipieper, H. J., Keweloh, H., and Rehm, H. J. 1991, Influence of phenols on growth and membrane permeability of free and immobilized Escherichia coli. Appl. Environ. Microbiol. 57, 1213 –1217 |
| [37] | Heipieper, H. J., Diefenbach, R., and Keweloh, H., 1992, Conversion of cis unsaturated fatty acids to trans, a possible mechanism for the protection of phenol-degrading Pseudomonas putida P8 from substrate toxicity. Appl. Environ. Microbiol. 58, 1847 – 1852. |
| [38] | Cenci, G., Caldini, G., and Morozzi, G., 1987, Chlorinated phenol toxicity by bacteria and biochemical tests. Bull. Environ. Contam. Toxicol. 38, 868 – 875. |
| [39] | Gül, S., Öztürk, D., 1998, Determination of the structure-toxicity relationship of amphiprotic compounds by means of the inhibition of the dehydrogenase activity of Pseudomonas putida Turkish J. Chem 22, 341 – 349. |
| [40] | Ren, S., and Frymier, P. D., 2002, Estimating the toxicities of organic chemicals to bioluminescent bacteria and activated sludge. Water Res. 36, 4406 – 4414. |
| [41] | Chan, C-M., Lo, W., Wong, K-Y., and Chung, W-F., 1999, Monitoring the toxicity of phenolic chemicals to activated sludge using a novel optical scanning respirometer. Chemosphere 39(9), 1421 – 1432. |
| [42] | Deneer, J.W., 2000, Toxicity of mixtures of pesticides in aquatic systems. Pest Manage. Sci. 56 (6), 516 – 520. |