Nana Yaw Asiedu1, Yaa Adoma Asiedu2, 3, Phanuel Coffie Kofi Bediako4
1Department of chemical Engineering, College of Engineering, Kwame Nkrumah University of Science and Technology, Kumasi, Ghana
2School of Chemistry, University of Witwatersrand, Johannesburg, South Africa
3Formerly Department of Chemical Engineering, College of Engineering, Kwame Nkrumah
4University of Science and Technology, Kumasi, Ghana
Correspondence to: Nana Yaw Asiedu, Department of chemical Engineering, College of Engineering, Kwame Nkrumah University of Science and Technology, Kumasi, Ghana.
| Email: |  |
Copyright © 2014 Scientific & Academic Publishing. All Rights Reserved.
Abstract
Micro-organisms which are believed to metabolize waste petroleum oils from soaked soils were isolated and characterized into appropriate genera in an earlier publication. Further studies conducted on the isolates showed that isolates from petrol contaminated soils were more efficient metabolizers. The maximum growth period which occurred at the end of the logarithm phase was 5 days for petrol isolates and 6 days for Kerosene, Diesel and Engine oil isolates. This paper has shown that the maximum growth rates of the isolates determined by the exponential growth model showed that the isolates from Engine oil contaminated soils gave the highest growth rate followed by Diesel, Petrol and Kerosene respectively. The time required for doubling cell mass concentration in ascending order was Diesel, Petrol, Engine oil and Kerosene. The average pH and temperature for maximum growth of the isolates were determined to be 7.3 and 304K respectively. The work has also shown that the isolates are similar in nature and they show mesophilic characteristics.
Keywords:
Micro-organisms, Metabolizers, Growth Rate, Growth Periods, Doubling Time
Cite this paper: Nana Yaw Asiedu, Yaa Adoma Asiedu, Phanuel Coffie Kofi Bediako, Estimating Maximum Growth Rates of Petroleum Metabolizers from Turbidity Data Using Exponential Growth Method, Journal of Microbiology Research, Vol. 4 No. 3, 2014, pp. 125-135. doi: 10.5923/j.microbiology.20140403.01.
1. Introduction
In Ghana petroleum is the key fuel for energy supply on which most of the possibilities for economic development depend to a large extent. It plays an essential part of the lives of people in Ghana. Petroleum products such as kerosene are used in many homes for cooking and lighting. In the rural areas for instance it is a very important essential commodity. Gasoline, Engine oil and lube oils are also used in automobiles and industrial engines. Generally, industrial activities essential to the development of a country generate wide variety of wastes. The waste has to be pretreated before disposal or recycled so that they do not adversely affect the environment. Chemical nature of these wastes is so diverse depending upon the type of industrial activity, and there is no single method of pretreatment that can be prescribed. Special methods have to be developed to treat petroleum waste from a particular type of industry. Waste petroleum oils are generated by automobiles and by almost every kind of industrial activity. Disposal of these has been the focus of attention in recent times. Petroleum pollution can be on a small scale, where products are dumped into streams or where auto- mechanics use the product of service vehicles. This type of pollution is minor and occurs in most garages. Petroleum oil waste may pose problems to vegetation, fish and human lives. In Ghana there is no record on any major oil disaster since Ghana became an oil producing country in recent times. An extensive work carried out by Boakye and Kumah [1] in some towns in Ghana which include; Accra, Kumasi, Tarkoradi, and the mining district of Obuasi. These areas were chosen because of their developed industrial base, good road and rail connections and their relative nearness to each other. A total of 184 areas were surveyed. The results of their survey showed that 4991 kiloliters of waste oils are generated per year in the areas surveyed. Out of this only 1788 kiloliters per year (36%) were reused and the rest 3203 kiloliters (64%) go to waste. Such large amount of waste petroleum oils must be checked, since it is a threat to the environment. Zobel [2], reviewed the action of micro-organisms on hydrocarbons and recognized that many micro-organisms have the ability to utilize hydrocarbons as a sole source of energy and carbon and that such micro-organisms are widely distributed in nature, he further recognized that the microbial utilization of hydrocarbons was highly dependent on the chemical nature of the compounds within the petroleum mixture and on environmental determinants. Twenty-one year after Zobel,’s [2] classic review, the super tanker, Torrey canyon sank in the English Channel and with this incidence attention of the scientific community was dramatically focused on the problems of oil pollution. Disposal techniques proposed to combat this oil pollution thus include the following:• Incineration:This is very easy to carry out but has serious environmental consequences. Commercial lubricating oils contain metal compounds such as lead tetra-ethyl as additives to improve upon performance of engines and harmful metallic oxides produced are released into the atmosphere with the combustion gases.• Treating with detergents:This is generally used for oil spills in the open seas. The detergents break the oil into smaller particles and disperse it through the water in micelles. These detergents are expensive and often non-biodegradable, thus adversely affect the environment. • Re-refining and recyclingThis seems to be the ideal way of petroleum waste disposal. This is an established industrial activity in several developed countries. It involves the treatment of sulphuric acid and activated clay and produces a waste acid clay sludge as a by product. This voluminous sludge itself poses a disposal problem and it is a major disadvantage of an otherwise simple technology. Newer reclaiming methods such as thin film vacuum distillation with hydro-finishing and solvent extraction are environmentally superior but require advanced technology and large capital investment.• Microbial methodsThe microbial disposal of waste petroleum oils is a new method in development that results in end-products that are completely friendly. Microbes disintegrate the hydrocarbon into smaller biodegradable products. These microbes feed on petroleum polluted areas and can be found in soils contaminated with petroleum dumps.In a recent publication some of these micro-organisms were isolated, and characterized into their appropriate genera. The organisms reported are strains of bacteria: Pseudomonadaceae, Asotobacteraceae, Methylomomdaceae, and Halobacteraceae, Asiedu et al [3]. These organisms are not confined to one region. Wherever they are found to be associated with soils and other surfaces in which the petroleum fractions can be present may serve as a source of microbial inoccular, Beerstecher [4]. In this study, further works has been done on the strains of bacteria reported by Asiedu et al [3], by looking at the optimum growth parameters of these strains and propose growth kinetics for the strains.
2. Materials and Methods
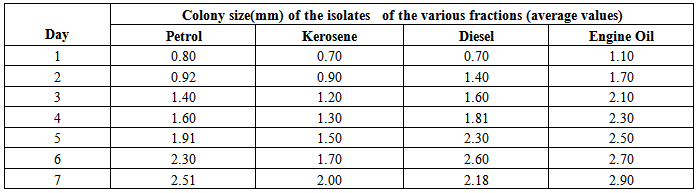
Determination of growth rates and doubling times of the isolatesAgar was prepared and the surface was touched with 0.4mm diameter loop containing bacterial culture of the isolates and incubated at 32℃ for colony observation. Daily increase of the colony diameters of the isolates were observed and measured over a period of 7 days. The data was used to plot a graph of colony size against time as shown in figures (1), (2) and (3). A straight line profile was obtained and the slope (µ) was used as the growth of the isolates. The doubling time (δ) for each isolate was determined using equation (1) below. Results of the doubling times are shown in table (1).Table 1. Colony size of the isolates
 |
| |
|
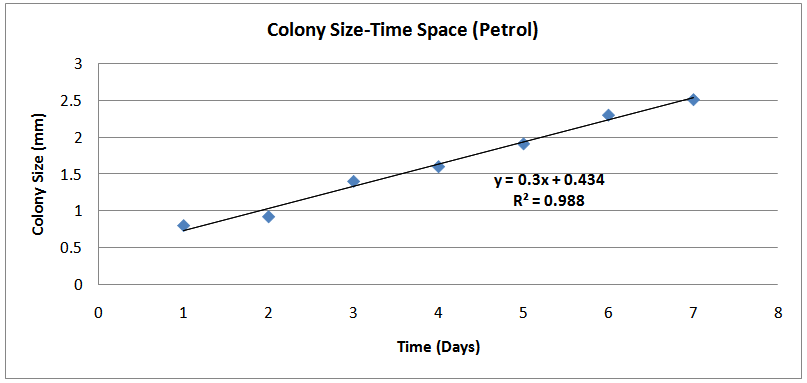 | Figure (1). Colony Size-Time Space (Petrol) |
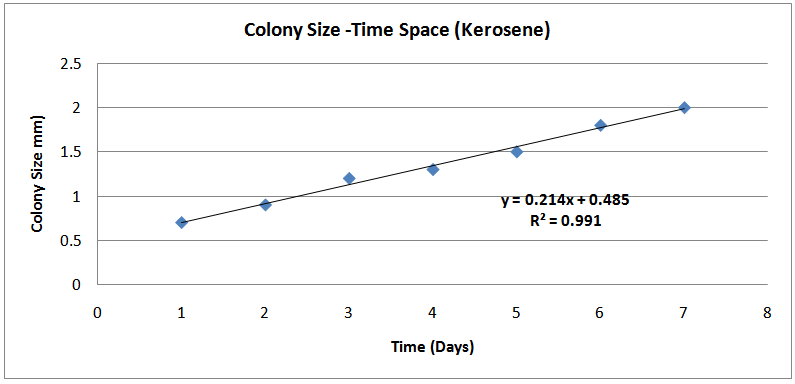 | Figures (2). Colony Size-Time Space (Kerosene) |
 | Figure (3). Colony Size-Time (Day) Space( Diesel) |
 | (1) |
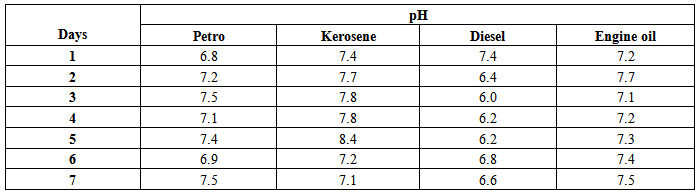
Colorimetric determination of turbidity of bacterial suspension with timeThe cell mass concentration of micro-organisms depends upon turbidity measurements of culture medium. Using sterile wire-loop in each, a loop full of isolates was dispensed in 9.0mL distilled water. 1.0mL was then taken in each to inoculate 20mL aliquots of the liquid microbial growth medium. This was to ensure approximately equal number of cells in each inoculum. Absorbance changes in turbidity with time were measured using the Griffin Colorimeter Model 40. The wavelength of the light used was 540nm. Profiles of turbidity changes with time were used to obtain the maximum growth of each isolates. The profile are shown in figures (13)- (16) below.Temperature optimization for optimum growthThis experiment was performed to determine the best temperature required for optimum growth by the isolates. The isolates of the various fractions were cultured in a nutrient Agar by culturing at different temperatures. The method used is similar to the description of above. The profiles of growth rates against temperatures were used to estimate the optimum temperature required for optimum growth. The results are presented in figures (18)-(20) below. Optimum pH determinationIn this experiment 3mL of nutrient broth was dispensed in eight test tubes and inoculated with the isolates from the various petroleum fractions, pH changes with time was monitored with electronic pH meter as the organisms grow. A plot of pH against time was used to determine the optimum pH. These profiles are shown in figures (21)-(24) below.
3. Results
Determination of growth rates and doubling times of the isolatesThe growth rates of the Isolates were studied using increase of colony size with time. Table 1 below shows the results and corresponding plots which were used to determined the growth rates of the isolates.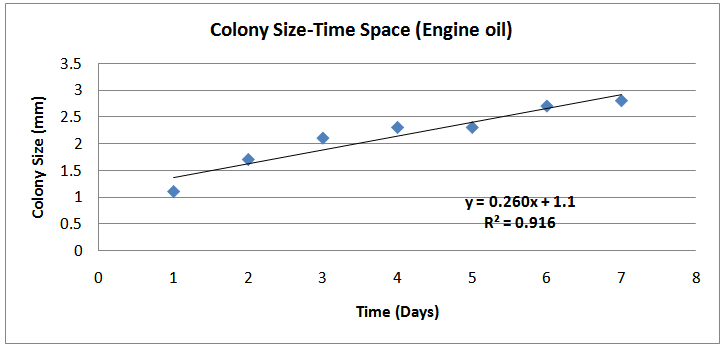 | Figure (4). Colony Size- Time (Day) Space (Engine oil) |
Table 2. Growth rate and doubling times
 |
| |
|
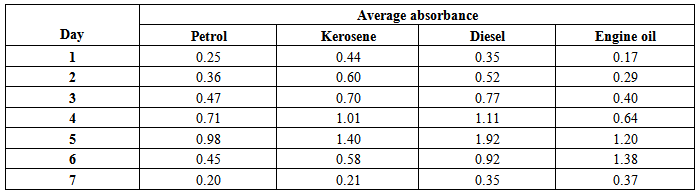
Absorbance against timeThe results below show the variations of absorbance with time are shown in table 3 below.Table 3. Absorbance-Time information
 |
| |
|
The profiles of the absorbance –time space of the above data are shown in figures (5) - (8) below: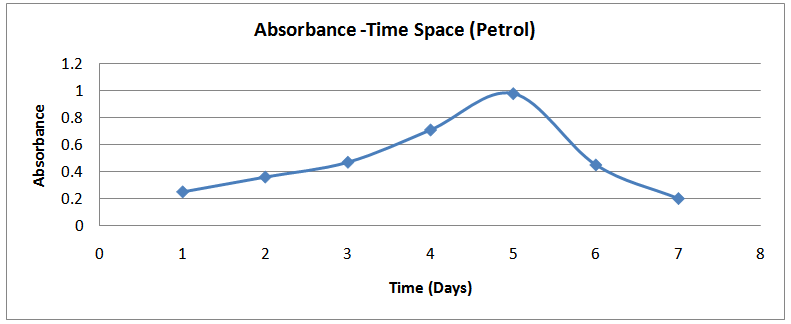 | Figure (5). Absorbance-Time Profile (Petrol) |
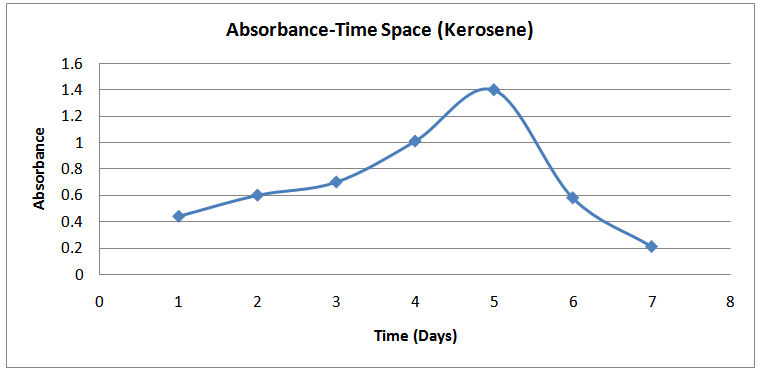 | Figure (6). Absorbance-Time Profile (Kerosene) |
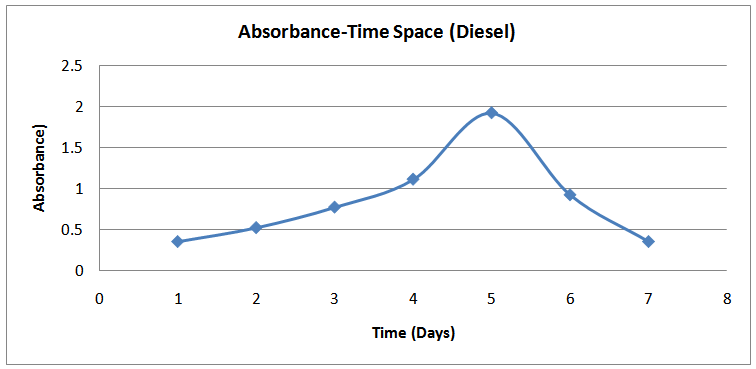 | Figure (7). Absorbance-Time Profile (Diesel) |
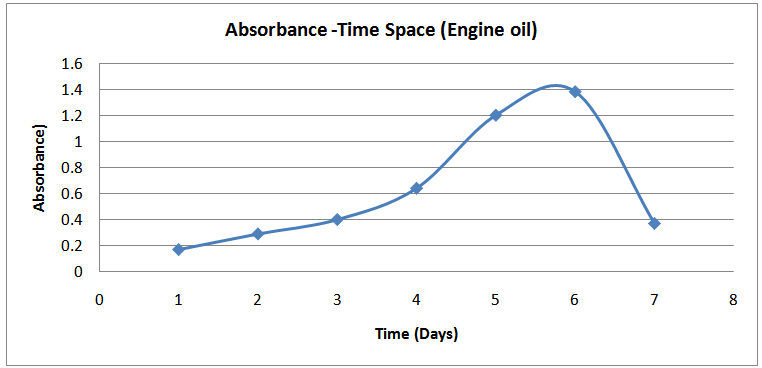 | Figure (8). Absorbance-Time Profile (Engine oil) |
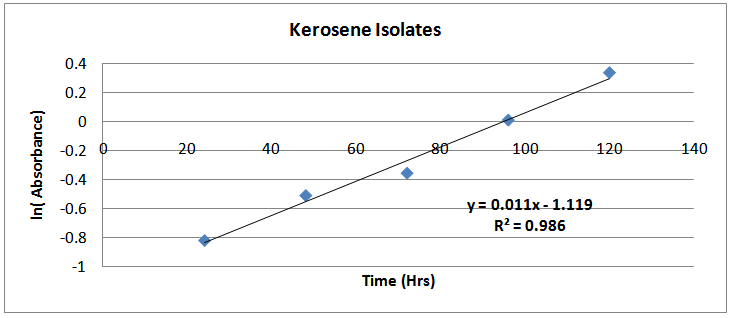
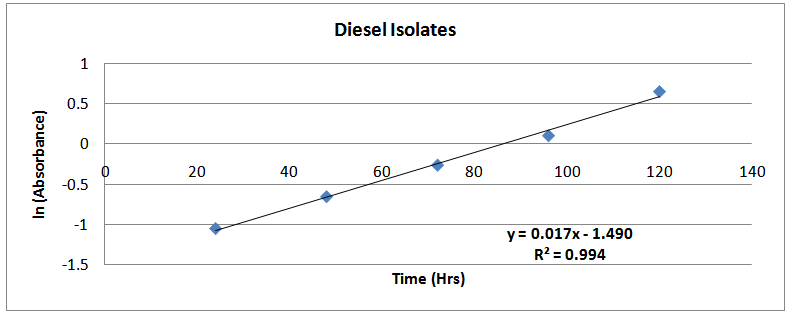
Using the exponential growth method to determine µ(max) from turbidity dataµ(max) was estimated by the application of exponential growth model proposed by Pruitt et al [6], Zwietering et al [7] and Dalgaard et al [8] is shown in equation (3) below: | (2) |
Figures (13)-(16) show the plots of ln (Abst) at anytime against time. The slopes of the lines were used as the maximum growth rates of the isolates.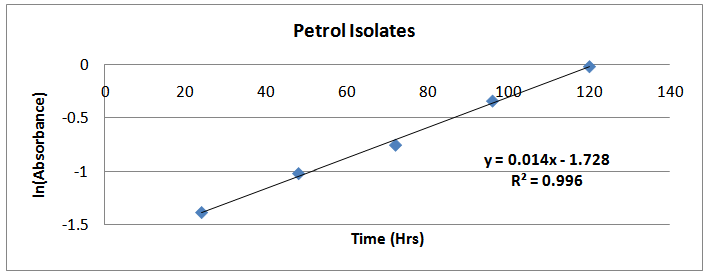 | Figure (9). ln(Absorbance)-time profile (petrol isolates) |
 | Figure (10). ln(Absorbance)-time profile (kerosene isolates) |
 | Figure (11). ln(Absorbance)-time profile (diesel isolates) |
 | Figure (12). ln(Absorbance)-time profile (engine isolates) |
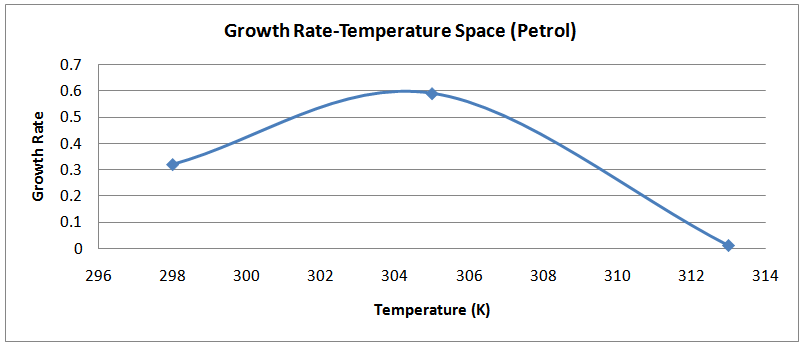 | Figure (13). Temperature-Growth Rate Space (Petrol) |
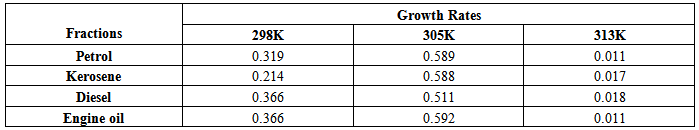
Temperature optimizationThe information used for temperature optimization is shown in table 4 below.Table 4. Temperature-Growth Rate Data
 |
| |
|
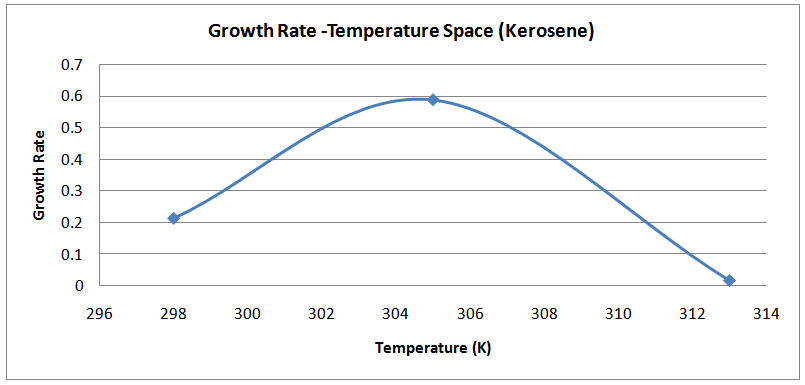 | Figure (14). Temperature-Growth Rates Space(Kerosene) |
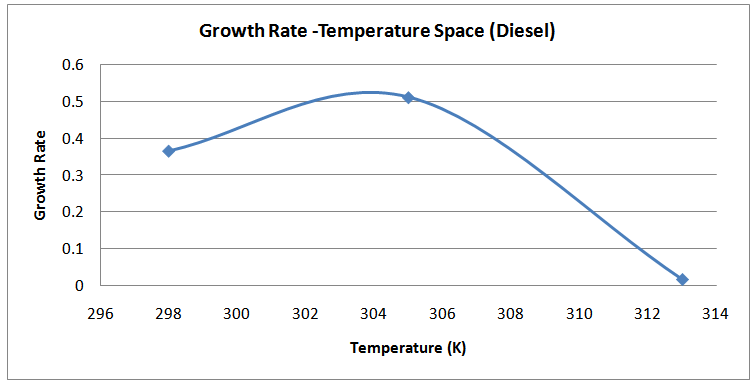 | Figure (15). Temperature-Growth Rates Space (Diesel) |
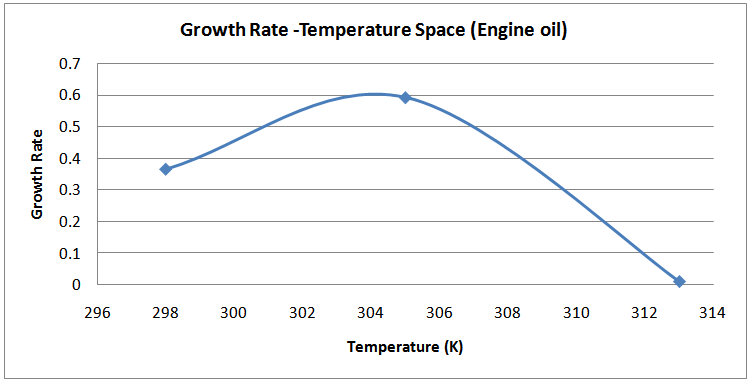 | Figure (16). Temperature-Growth Rates Space (Engine oil) |
pH optimizationThe information used for optimization of pH is shown in table 5 below.Table 5. Optimization of pH data
 |
| |
|
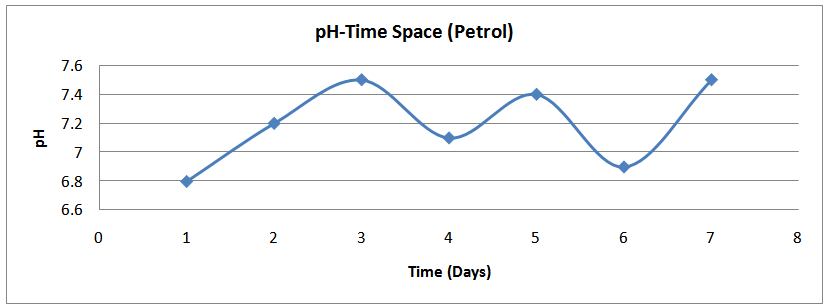 | Figure (17). pH time profile (Petrol) |
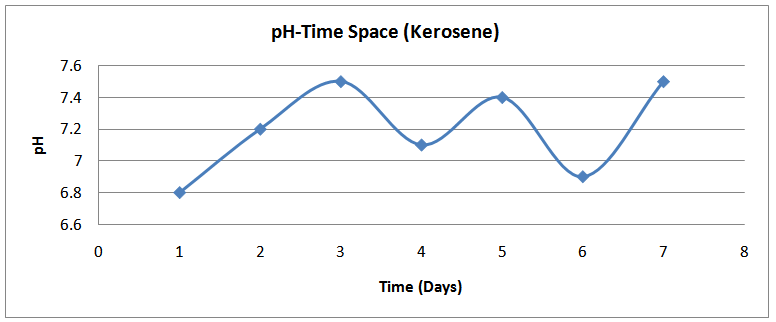 | Figure (18). pH time profile (Kerosene) |
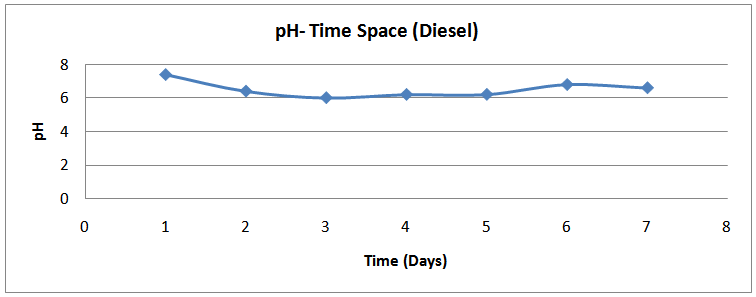 | Figure (19). pH time profile (Diesel) |
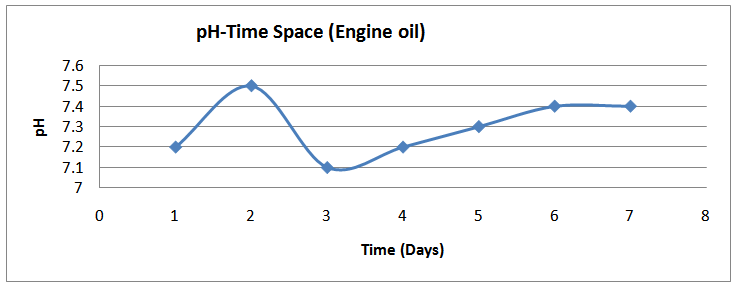 | Figure (20). pH time profile (Engine oil) |
4. Discussion of Results
The isolates showed different growth rates as shown in figures (1)-(4) and doubling times as shown in table (2) above. This is a clear indication that the isolates from soils contaminated with the various fractions are different micro-organisms. The growth rate of isolates from kerosene contaminated soils was the highest with a doubling time of about 79 hours, whiles doubling times for Petrol, Engine oil and Diesel are 55, 64 and 50 per hours respectively. The growth trend of the isolates does not vary appreciably from isolates to isolate. The figures (13)-(16) shows the growth profile of the isolates. They appear very similar in nature. This is an indication that the isolates precede through similar growth processes. The maximum growth occurred in the fifth day which was the end of the logarithm phase during the growth process for Petrol, Kerosene, and Diesel contaminated soils, whiles that of the Engine oil contaminated soil isolates occurred on the sixth day. The maximum growth rate for the isolates determined were 0.014, 0.011, 0.017 and 0.018/h for petrol, kerosene, diesel and engine oil respectively. The microbial growth rate shows how organisms metabolize the organic matter in the soil complex. Hence, it can be inferred that microbes isolated from soil contaminated with engine oil appears to be more aggressive as they can easily convert the carbon in the contaminated soil to cellular materials than other isolates. Optimum temperatures were determined by studying the isolates growth rate with temperature. The profiles are shown in figures (13-(16). The profiles are similar indicating similar growth metabolism with the various temperatures considered (298K, 305K and 313K). The organisms could not tolerate higher temperatures as their rate growth was smaller as shown in table 4 above and also from their profiles growth rates diminished as temperature increases. The isolates grew better at 298K however it was determined that the optimum growth occurred at 305K as shown in the figures (13)-(16) above. This however was not surprising since these organisms strive and survive around temperatures about 305K in nature. This also gave other identification / characterization criteria as these organisms were considered to be mesophilic organisms. The variation of pH with time during the growth occurred between 6.6-8.4. This is considered the optimum pH within which the organisms can best be cultured or produced in a biochemical reactor. The pH profiles with time are shown in figures (17)-(20) above. This optimum pH is consistent with literature values.
5. Conclusions
Optimum growth parameters have been determined in these experimental studies has opened a way for more biochemical engineering work to be carried out on the isolates. It is shown that optimum growth parameters will only occur under optimum pH and temperatures. The above determinations are invariably required for preliminary design optimization and simulation of batch and continuous bioreactors for the larger scale production of these petroleum metabolizers for the treatment of waste petroleum oils.
ACKNOWLEDGEMENTS
We thank Mr. K.O. Nyako (late), formerly of Biological Science Department, Kwame Nkrumah University of Science and Technology, Kumasi –Ghana and his team of technicians especially Mr. Osei, for their assistance and expertise made available to as during this work. We also express our sincere appreciation for the Kwame Nkrumah University of Science and Technology, Kumasi –Ghana for financial support for this work.
References
| [1] | Boakye, K., Kumar, A. Assesmant of used petroleum oil generation and its utilization in Ghana. 1995. Unpublished Data. |
| [2] | ZoBell, C. E. 1946. US. Patent 2413,278. |
| [3] | Asiedu, N.Y. Microbial disposal of waste petroleum oils. M.sc (Chemical Eng.) Thesis Kwame Nkrumah University of Science anf Technology, Kumasi Ghana, 2000. |
| [4] | Beerstecher, E. An introduction to Microbiological Petroleum Engineering, Elsevier Press, Inc.,: Houston New York, 1954. |
| [5] | Clifton, C. E. Introduction to the Bacteria, McGraw-Hill Book Company, Inc. USA, 2nd Ed. 1958. |
| [6] | Pruitt, K. M., DeMuth, R. E., Turner, M. E., 1979. Practical application of generic growth theory and the significance of the growth curve parameters. Growth 43, 19-35. |
| [7] | Zwietering, M. H., Jongenburger, L., Rombouts, F. M., Van’T Reit, K. 1990. Modeling of the bacterial growth curve. Appl. Environ. Microbiol. 56, 1875 -1881. |
| [8] | Dalgaard, P., RoSS, T., Kamperman, L., Neumeyer, K., MckMeekin, T. A. 1994. Estimation of bacteria growth rates from turbidimetric and viable count data. Int. J. Food Microbiol 23 391 -401. |
 Abstract
 Reference
 Full-Text PDF
 Full-text HTML