-
Paper Information
- Paper Submission
-
Journal Information
- About This Journal
- Editorial Board
- Current Issue
- Archive
- Author Guidelines
- Contact Us
Basic Sciences of Medicine
p-ISSN: 2167-7344 e-ISSN: 2167-7352
2018; 7(2): 21-26
doi:10.5923/j.medicine.20180702.01

A Study on Serum Level of Chemerin in Experimentaly- Induced Thyroid Dysfunctions
 Abstract
 Reference
 Full-Text PDF
 Full-text HTML
Husam M. Edrees1, 2, Eslam K. Fahmy2, Safya E. Esmaeel2
1Faculty of Medicine-Department of Physiology- Zagazig-University, Egypt
2College of Public Health and Health Informatics, Qassim University, Saudi Arabia
Correspondence to: Husam M. Edrees, Faculty of Medicine-Department of Physiology- Zagazig-University, Egypt.
| Email: |  |
Copyright © 2018 The Author(s). Published by Scientific & Academic Publishing.
This work is licensed under the Creative Commons Attribution International License (CC BY).
http://creativecommons.org/licenses/by/4.0/

Chemerin was identified as an adipokine in inflamed tissues and participate in adaptive and innate immunity. Thyroid dysfunction causes alteration in adipokines and lipids profile. This research aims to investigate the effect of experimental thyroid dysfunction on plamsa levels of chemerin in rats. Experimental Design: The research was carried out on fourty five adult and healthy male albinorats grouped into: Control (Group I), Hypothyroid (Group II) and Hyperthyroid (Group III) groups. Propylthiouracil administration 1mg/ml (four weeks) was used to induce hypothyroidism, Hyperthyroidism was produced by administration of L-thyroxine 2Pg/ml (four weeks), untreated animals are considered as controls. Results: Serum chemerin level was found to be significantly increased in Group II (hypothyroidism) with significant decrease in Group III (hyperthyroidism). Chemerin was found to have significant negative correlation with T3 and T4 levels and significant positive correlation with thyroid stimulating hormone (TSH) in all study groups. Moreover, in group II, there were a significant increase in serum levels of total cholesterol (TC), triglycerides (TG) and low density lipoprotein (LDL) and a significant decrease in level of high density lipoprotein (HDL), while in group III, There was a significant decrease in TC, TG and LDL and a significant increase in level of HDL. Conclusion: experimental thyroid dysfunction affect serum chemerin level, so, chemerin could be considered as a laboratory marker of thyroid hormone disorders.
Keywords: Chemerin, Inflammatory cytokines, Hypothyroidism, Hyperthyroidism
Cite this paper: Husam M. Edrees, Eslam K. Fahmy, Safya E. Esmaeel, A Study on Serum Level of Chemerin in Experimentaly- Induced Thyroid Dysfunctions, Basic Sciences of Medicine , Vol. 7 No. 2, 2018, pp. 21-26. doi: 10.5923/j.medicine.20180702.01.
Article Outline
1. Introduction
- Many metabolic parameters are regulated by Thyroid function. Thyroid hormones affects metabolism of lipoprotein and cardiovascular disease. Certainly, within the normal level of thyroid-stimulating hormone (TSH), it was observed that with increasing TSH, there is an increase in lipoprotein cholesterol (total and low-density) and triglycerides with decrease in high-density lipoprotein cholesterol [1]. Hypothyroidism is a common disease which unfavorably affects lipids metabolism. However, hyperthyroidism can be connected to low cholesterol level. Generally, thyroid dysfunction must be considered on assessing and managing patients with dyslipidemia [2].Adipocytokines are well-known to be involved in inflammatory reactions in several chronic inflammatory conditions [3]. Adipokines can modify lipid and glucose metabolism, blood pressure and atherosclerotic effects by affecting organs including brain, skeletal muscle, immune system and liver [4].Chemerin, an important adipocytokine, which was confirmed to control adipocyte differentiation, affects the appearance of adipocyte genes and acts as a proinflammatoryadipocytokine that stimulates the cellular production of inflammatory cytokines [5] and is significantly linked to white blood cell count, tumor necrosis factor-α, interleukin-6 and C-reactive protein [6]. It acts as a ligand for the G protein-coupled receptor CMKLR1 and share in adaptive and innate immunity. Chemerin receptor called chemokine-like receptor (ChemR23), has been recognized in monocytes/macrophages and NKs (natural killer cells) in humans and in mice [7]. Chemerin has a chemoattractant effect on macrophages, dendritic cells and natural killer cells [8].Chemerin can induce insulin resistance with proinflammatory characters strongly related to aspects of inflammation and metabolic syndrome. Chemerin is highly expressed in hepatocytes and white adipose tissue (WAT), however, it has low expression in brown adipose tissue, lungs, and kidneys [9].TSH induces secretion of adipokines from adipose tissue and preadipocytes by signaling to the TSH receptor (TSHR) protein [10]. Thyroid hormones are vital for conservation of total energy consumption and have an effective role in normal development, growth and reproduction. There is a compound interaction between thyroid hormones and adipocytokines [11]. This research was designed to evaluate the effect of thyroid dysfunction on plamsa levels of chemerin in rats and clarify possible relationship between thyroid hormones, metabolic changes and serum chemerin level.
2. Material and Methods
2.1. Animals
- A number of 45 healthy adult male albino rats aging 8-10 weeks and weighing 195-240 gram. All the animals were conserved in cages (five/cage) at room temperature on a 12 hours of light/ dark cycle. All procedures in this study were implemented according to strategies of the committee of ethics- Faculty of Medicine, Zagazig University.
2.2. Methods
- Two weeks before the experiment starts, rats were accommodated to laboratory conditions and received standard chow. Rats were classified randomly into:Group I (Euthroid Control Group): 15 rats served as controls and received standard chow without treatment [12].Group II (Hypothroid Group): 15 rats received propylthiouracil (PTU) (1mg/ml, diluted in drinking water for four weeks [13].Group III (Hyperthroid Group): 15 rats received received L-thyroxin at a daily dose of 2Pg/ml, diluted in drinking water for four weeks [13].
2.3. Estimation of Body Mass Index (BMI)
- BMI was estimated according to the following equation: body weight (gm) / length2 (cm2), this is an obesity indicator. The limit value of obesity is higher than 0.68 gm/cm2 [14].
2.4. Measurement of Food Intake
- Equal amounts of food (30 g/day/rat) were provided to every rat in a separate compartment in the cage and the amount consumed by each rat was assessed [15].
2.5. Sampling of Blood
- At the termination of the experiment after overnight fasting, the animals were sacrified with sodium pentobarbitone and their blood was taken for further measurement. Serum were obtained at room temperature by allowing clotting of the blood samples and centrifugtion at 7000 rpm. The samples were stored and kept at -20°C for estimation of T3, T4, TSH, lipid profileand chemerin.
2.6. Drugs and Chemicals
- 2.6.1. L-thyroxin: Sigma-Aldrich, USA.2.6.2. Propylthiouracil: Sigma-Aldrich, USA.2.6.3. Kits for chemerin level assessment: Using a commercial enzyme-linked immunosorbent assay kits, U. S. A. [16].2.6.4. Kits for T3, T4 and TSH levels estimation: Using ELISA kits, Siemens healthcare Diagnostics, Deerfield, IL.2.6.5. Kits for Total Serum cholesterol (TC) levels: Using the method described by Allain et al. [17].2.6.6. Kits for Serum triglycerides (TG) levels: Using the method described by Naito [18].2.6.7. Kits for Serum high density lipoproteins (HDL) levels: Using the method defined byWarnick et al. [19].2.6.8. Low density lipoprotein cholesterol: by using Friedewald et al. method [20]. LDL= TC-HDL-TG\5.
2.7. Statistical Analysis
- Presention of the results are done as mean ± standard error of the mean. We carried out statistical analysis using SPSS, version 20.0. P values was measured by unpaired, two-tailed Student’s t-test. P value <0.05 reflect statistical significance. Repeated assessments using analysis of variance (ANOVA) were done.
3. Results
3.1. Body Mass Index (BMI) and Food Intake
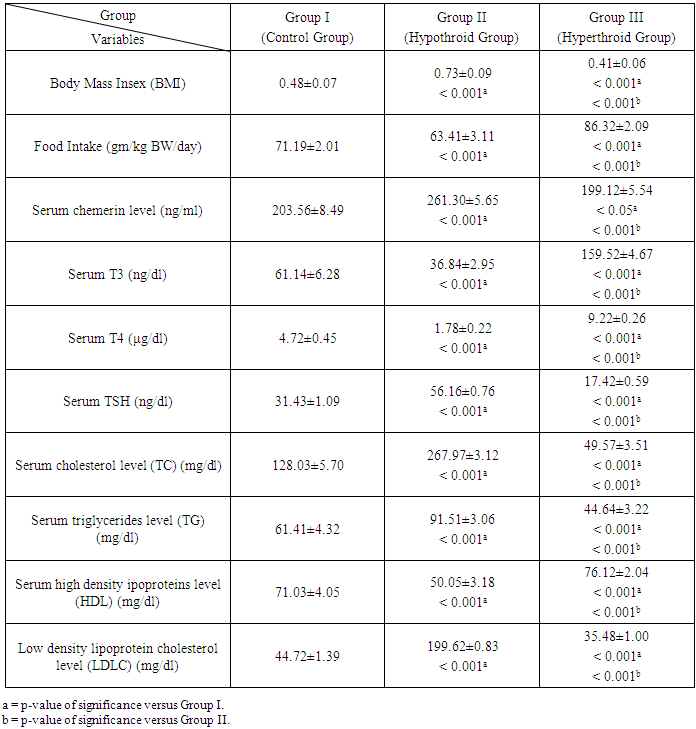
- As shown in Table 1, in hypothyroid rats, food intake was significantly decreased in with a significant increase in BMI. However, in hyperthyroid rats, we found a significant increase in food intake and a significant decrease in BMI.
3.2. Serum Chemerin Level
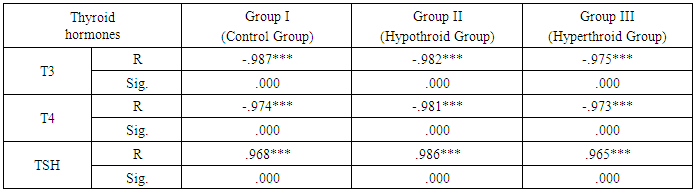
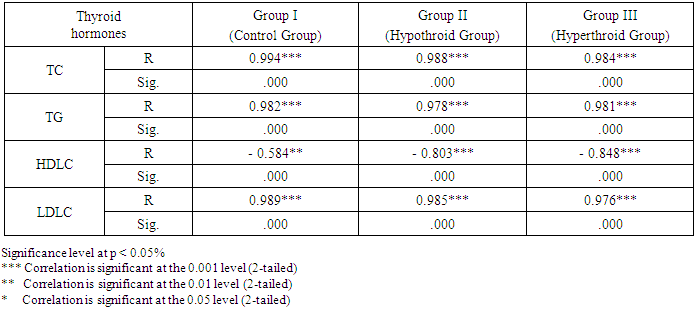
- As expressed in Table 1, the mean values of serum chemerinlevel of was found to be significantly increased (P<0.001) in group II (Hypothyroid Group) and significantly decreased (P<0.05) in group III (Hyperthyroid Group) on comparison with group I (Euthyroid Group). We found that the mean value of serum chemerinlevel was significantly increased (P<0.001) in group II (Hypothyroid Group) on comparison with group III (Hyperthyroid Group). Serum level of chemerin was found to have significant negative correlation with serum level of T3 and T4 (P< 0.001) and significant positive correlation with TSH level in groups I, II and III (P< 0.001). Serum level of chemerin was found to have significant positive correlation with serum levels of TC, TG and LDLC and significant negative correlation with HDLC level in groups I, II and II.
3.3. Serum T3, T4 and TSH Levels
- As shown in Table 1, there are significant decrease in the mean values (P<0.001) of serum levels of T3 and T4 and significant increase (P< 0.001) in serum levels of TSH in group II (Hypothyroid Group) when compared with that of group I (Euthyroid Group). In group III (Hyperthyroid Group), there are significant increase in the mean values (P< 0.001) of serum levels of T3, T4 and significant decrease (P< 0.001) in serum level of TSH when compared with both that of group I (Euthyroid Group) and group II (Hypothyroid Group).
3.4. Serum Cholesterol (TC), Triglycerides (TG), High Density Lipoproteins (HDL) and Low Density Lipoprotein Cholesterol (LDLC) Levels
- Table 1 shows that in group II (Hypothyroid Group), there are significant increase in the mean values of serum levels of TC, TG and LDLC (P< 0.001) with a significant decrease in serum level of HDL on comparison with that of group I (Euthyroid Group). In group III (Hyperthyroid Group), there are significant decrease in the mean values of serum levels of TC, TG and LDLC (P< 0.001) with significant increase in serum level of HDL on comparison with both that of group I (Euthyroid Group) and group II (Hypothyroid Group).
|
|
|
4. Discussion
- Chemerin is an adipocytokine acting as an endogenous ligand for receptor coupled to G protein and encoded by the gene GPR1 [21]. It has been shown to manage adipocyte differentiation, it has an essential role in glucose metabolism, insulin resistance and obesity [22]. It performs aproinflammatory action and is related to cellular expression of inflammatory cytokines [23]. Thyroid hormones dysfunction is accompanied by metabolic changes. Clinical researches have revealed that there is alterations in levels of some adipokines accompanying thyroid disorders [24]. However, the association between alterations in chemerin with changed TSH levels are debatable.This study was designed to correlate changes of serum level of chemerin in different thyroid gland states (hypothyroid and hyperthyroid) and investigate that chemerin could be used as a laboratory marker of thyroid hormone disorders.In this research, there was a significant decrease in T3, T4 and food intake with a significant increase in TSH and BMIin hypothyroid group. However, in hyperthyroid group, there was a significant increase in T3, T4 and food intake accompanied by a decrease in TSH and BMI when compared with control group. These findings are consistent with Amin et al. [25] who stated that thyroid disorders can ensure clinical significances on appetite and body weight. These effects were supposed to be due to the peripheral influences of thyroid hormones. However, lately, local thyroid hormone in the central nervous system is assumed to regulate appetitephysiologically. They reported that hyperphagia associated with hyperthyroidism occurs due to effect of thyroid hormones on CNS appetite circuits. Moreover, Giménez-Palop et al. [26] stated that in hyperthyroidism, severe loss of weight in spite of normal or augmented caloric consumption could be declared by low ghrelin levels in hyperthyroid patients. Alva-Sánchez et al. [27] stated that there is a decrease in the daily food intake and body weight in the rats receiving antithyroid treatment. In this study, we found that serum chemerin level was significantly increased in Group II and significantly decreased in group III on comparison with control group (group I). In addition, serum level of chemerin was found to have significant negative correlation with serum level of T3 and T4 and significant positive correlation with serum level of TSH in all study groups.These findings are consistent with Gong et al. [28]. They claimed that in rats with subclinical hypothyroidism (sHT), the levels of chemerin and TNF-α were significantly higher on comparison with control rats with a positive relationship with TSH. In contrast, Some clinical researches have revealed that chemerin and TNF-α levels were equivalent between sHT group and the control group, however, in hypothyroidism patients, their levels were increased significantly [29]. These results may be clarified by effect of increased levels of TSH on the adipokines expression and the progress of endothelial dysfunction. The expression of chemerin and TNF-α were significantly greater with the increased TSH in hypothyroidism patients. In contrast to our results, Li et al. [30] claimed that the decrease of density of bone minerals in patients with Graves Disease and hyperthyroidism is not only connected to the direct or indirect influence of extreme thyroid hormones on systemic and osteoblastic cells, but it is also allied to the negative regulation of bone metabolism due to the increased chemerin level.In this study, it was shown that in group II, the mean values of serum levels of TC, TG and LDLC were found to be significantly increased with significant decrease in serum level of HDL when compared with both that of group I (Euthyroid Group). In group III, the mean values of serum levels of TC, TG and LDLC were found to be significantly decreased with significant increase in serum level of HDL when compared with both that of group I (Euthyroid Group) and group II (Hypothyroid Group). Moreover, serum level of chemerin was found to have significant positive correlation with serum levels of TC, TG and LDLC and significant negative correlation with HDLC level in groups I, II and III.These findings are consistant with Chen et al. [31] who stated that hypothyroidism patients exhibited significant higher serum levels of TC, TG and LDLC. They explained that decrease in thyroid hormones levels weaken action of lipoprotein lipase (LPL) enzyme which remove triglycerides -rich lipoproteins [32, 33] leading to increased levels of triglycerides in the serum. Regulation of LDLC receptors by T3 occurs by direct binding to thyroid hormone responsive elements (TREs) and managing sterol regulatory element-binding protein. In hypothyroidism, lower thyroid hormones lead to decreased expression of LDLC receptors [34].
5. Conclusions
- This research demonstrates that serum chemerin level could be influenced by thyroid hormone disorders. Hypothyroidism elicited a significant increase in chemerin level, while there was a significant decrease in chemerin level in hyperthyroidism. Serum level of chemerin has significant positive correlation with serum level of T3 and T4 and significant negative correlation with serum level of TSH. Changes in chemerin production associated with thyroid dysfunction could be due to adaptive mechanisms to alteration in basal energy spending in thyroid disorders.