-
Paper Information
- Paper Submission
-
Journal Information
- About This Journal
- Editorial Board
- Current Issue
- Archive
- Author Guidelines
- Contact Us
Basic Sciences of Medicine
p-ISSN: 2167-7344 e-ISSN: 2167-7352
2014; 3(4): 69-84
doi:10.5923/j.medicine.20140304.02
Serum Resistin,Vaspin and Chemerin in Rats with Non Alcoholic Fatty Liver Disease:Correlation with Metabolic and Haemostatic Parameters
 Abstract
 Reference
 Full-Text PDF
 Full-text HTML
Ali Kh. Asalah, Mohamad A. Alsayed, Dalia I. Abd Al-Aleem, Nanees F. El Malkey
Department of Physiology, Faculty of Medicine, Zagazig University
Correspondence to: Dalia I. Abd Al-Aleem, Department of Physiology, Faculty of Medicine, Zagazig University.
| Email: |  |
Copyright © 2014 Scientific & Academic Publishing. All Rights Reserved.
Background: The patho-physiology that leads to non-alcoholic fatty liver disease (NAFLD) is not well understood. It is thought that adipokines affect lipid metabolism, inflammatory and fibrotic processes in developing NAFLD.Objective: To investigate the possible interplay between resistin, vaspin and chemerin and pathogenesis of high fat diet induced NAFLD and its associated coagulopathy in male albino rats.Material and methods: This study was conducted on 2 groups of male albino rats: Control group (I)which was divided into 3 equal subgroups (n=10), in which rats fed normal chow for 4, 12 and 24 weeks, respectively. HFD-fed group (II)which was divided into 3 equal subgroups (n=10) in which rats were fed high fat diet (HFD) (%58) for 4, 12 and 24 weeks, respectively. In all groups, BMI, abdominal circumference (AC), serum levels of resistin, vaspin, chemerin, glucose, insulin (with calculation of HOMA-IR), lipid profile, ALT, AST, CRP, plasma fibrinogen and D-dimer levels were measured and histopathological liver injury scoring was done.Results: HFD-feeding for 4w, 12w, 24w resulted in simple steatosis, non-alcoholic steatohepatitis (NASH) and cirrhosis, respectively, as evidenced by results of the liver histopathology and significantly elevated liver enzymes. Also, there was a significant progressive increase in BMI, AC, serum glucose, insulin, TC, TG, VLDL, LDL, CRP levels and HOMA-IR in HFD/NAFLD groups. Furthermore, there was a significant progressive increase in serum resistin, vaspin and chemerin levels in the same groups, with a significant positive correlation between serum resistin & chemerin, but not vaspin, and all the above mentioned parameters including liver injury scoring. Further, results indicated a hypercoaguable state in steatosis and NASH groups, and DIC in cirrhotic group. Whatever, there was a significant positive correlation between serum resistin & chemerin, but not vaspin, and plasma D-dimer levels in the three HFD/NAFLD groups. Conclusions: This study suggested that resistin and chemerin, but not vaspin, may play a role in the pathogenesis of NAFLD and development of its associated coagulopathy.
Keywords: NAFLD, Resistin, Vaspin, Chemerin, Insulin resistance, Coagulopathy
Cite this paper: Ali Kh. Asalah, Mohamad A. Alsayed, Dalia I. Abd Al-Aleem, Nanees F. El Malkey, Serum Resistin,Vaspin and Chemerin in Rats with Non Alcoholic Fatty Liver Disease:Correlation with Metabolic and Haemostatic Parameters, Basic Sciences of Medicine , Vol. 3 No. 4, 2014, pp. 69-84. doi: 10.5923/j.medicine.20140304.02.
Article Outline
1. Introduction
- Overweight and obesity progress to metabolic syndrome through pathophysiological mechanisms which are largely unclear [1].It has been hypothesized that the state of chronic low-grade inflammation associated with excess adipose tissue May explain the development of the obesity related pathologies, such as type II diabetes mellitus (DM II), cardiovascular disease and non-alcoholic fatty liver disease (NAFLD) [2].NAFLD, a spectrum of liver disorders ranging from simple steatosis to non-alcoholic steatohepatitis (NASH) and advanced hepatic fibrosis or even cirrhosis [3], is affecting a constantly increasing number of people all over the world [4]. It is also an independent risk factor for prothrombotic tendency, and increased risk of cardiovascular morbidity [5].Studies have demonstrated differences in NAFLD prevalence rates across race/ethnicity, gender and weight status [6]. Insulin resistance (IR) is universally acknowledged to play a key role in the pathogenesis of NAFLD [4]. In fact, IR is characterized by elevated expression and production of several cytokines [7].Resistin is a cysteine-rich polypeptide primarily produced by white adipose tissue in rodents and monocytes or macrophages in humans [8]. Resistin has been implicated in unfavorable metabolic, cardiovascular and inflammatory responses [9]. Several rodent models have shown that the major target organ of resistin is liver [10]. However, little is known about the role of resistin in chronic liver disease [11]. Vaspin is an adipocytokine that is supposed to have insulin sensitizing effects [12]. However, the real role of vaspin in glucose dysregulation and insulin resistance is not well understood [13, 14]. Interestingly, Kukla et al. [15] reported that in patients with NAFLD serum vaspin is positively associated with hepatocyte ballooning and aminotransferases levels. In contrast, Genc et al. [16] reported that vaspin levels are not altered in male subjects with NASH.Chemerin is one of the novel adipokines secreted by adipose tissue in an inactive form then activated through proteolytic cleavage by serine proteases of the coagulation, fibrinolytic and inflammatory cascades [17]. Rourke et al. [18] pointed out chemerin as a regulator of adipogenesis, glucose metabolism and inflammation as it plays an important role in macrophage infiltration into the adipose tissue. The implication of chemerin in metabolism and inflammation might provide a link between obesity and its related disorders, such as DM II, cardiovascular diseases [19] and NAFLD [20].Some investigators suggested that different adipokines may play a crucial role in the progression from fatty infiltration to inflammation and fibrosis of the liver [7, 21]. However, the relationship between these adipokines and their role in the pathogenesis of NAFLD remains to be investigated.Therefore, this study was designed to investigate the possible interplay between adipokines; resistin, vaspin & chemerin and pathogenesis of high fat diet induced NAFLD and its associated coagulopathy in adult male albino rats.
2. Material and Methods
- A total number of 60 healthy adult male wistar albino rats weighing 180-210 gm were obtained from the animal house of Faculty of Veterinary Medicine-Zagazig University. They were housed in an air-conditioned room with controlled lighting (12 hours light/12 hours dark cycle) and temperature (21-24°C) and received food and water ad libitum. After one week of acclimatization the animals were divided into 2 main groups: Control group (I) (n=30) which was divided into 3 equal subgroups (n=10); subgroup (Ia): In which rats fed normal chow for 4 weeks, subgroup (Ib): In which rats fed normal chow for 12 weeks, subgroup (Ic): In which rats fed normal chow for 24 weeks. HFD-fed group (II) (n = 30) which was divided into 3 equal subgroups (n=10); subgroup (IIa): In which rats fed HFD for 4 weeks for induction of steatosis, subgroup (IIb): In which rats fed HFD for 12 weeks for induction of NASH, subgroup (IIc): In which rats fed HFD for 24 weeks for induction of cirrhosis [22].Rats had free access to water and chow and kept at room temperature. Rats in control groups received standard chow (12.6 kJ/g) which was consisted of 18 % protein, 77% carbohydrate and 5% fat. While, rats in high fat-fed groups received high-fat (HF) chow which was consisted of 18% protein, 24% carbohydrate, and 58.0% fat (a total 23.4 kJ/g) [22], (Diets were obtained from faculty of agriculture, Zagazig University).All the experimental procedures were conducted in accordance with the guiding principles for the care and use of research animals and were approved by the Institutional Research Board of Faculty of Medicine, Zagazig UniversityAnthropometric measures:Measuring body weight: by using a digital balance (Germany), the animal was weighed day before the experiment, twice a week and at the last day. The results were written in a record for each labeled rat. Measuring rat length: Nose to anus length was measured at the start and the end of the experiment. The animal is allowed to move while an assistant was holding it from the tail to lengthen the body to ensure the real nose to anus length of the animal and avoid false measures. Metal ruler graduated in centimeters was used by holding zero end at the anus and record the reading that reached by the nose, then all measures were plotted for each labeled rat in its record [32].Measuring of abdominal circumference (AC): Rats were placed in ventral position and the waist circumference was assessed in the largest zone of the rat’s abdomen using a plastic non-extensible measuring tape [24].Calculating BMI index which equal body weight (gm) / length2 (cm2), this index can be used as an indicator of obesity where the cutoff value of obesity BMI is more than 0.68 gm/cm2 [23].Blood collection: After overnight fasting, animals were sacrificed at the end of experimental period under light ether anesthesia, and blood samples (6-8 ml/rat) were obtained by decapitation of all rats between 9-11 a.m. Blood was divided as following:• 2 ml of the blood was collected in a plastic centrifuge tube containing 3.2% sodium citrate solution (0.1 ml/0.9 ml blood). Plasma was separated by centrifugation of blood immediately at 1258 r.p.m for 10 min. and used for determination of prothrombin time (PT), activated partial thromboplastin time (aPTT), fibrinogen and D-dimer levels.• 3ml of the blood, each 1ml was placed in a separate test tube, for calculation of whole blood clotting time (WBCT).• The remaining amount of blood was collected in clean plastic centrifuge tubes and allowed to clot. Serum was separated by centrifugation of blood at 3000 r.p.m. for 15 minutes. The supernatant serum was pipetted off using fine tipped automatic pipettes and stored deep frozen at -20℃ until assayed. Biochemical Analysis: 1) Serum resistin levels: by using rat enzyme-linked immunoassay kits from Linco Research Inc., (USA), according to Steppan and Lazar, [25]. 2) Serum vaspin levels: by using rat enzyme-linked immunoassay kits from Wkea Med Supplies Corp., (USA), according to Hida et al. [12]. 3) Serum chemerin levels: by using rat enzyme-linked immunoassay kits from Uscn Life Science., (USA), according to Tan et al. [19].4) Serum glucose levels: by using glucose enzymatic (GOD-PAP)-liquizyme Kits (Biotechnology, Egypt), according to Tietz, [26].5) Serum insulin levels: by using rat insulin enzyme-linked immunosorbent assay kit, (Product Number: RAB0904, Sigma-Aldrich Chemie GmbH, U.S.A). according to Temple, [27].Calculation of homeostasis model assessment of insulin resistance (HOMA-IR): The following equation was used; [insulin (µU/mL) x glucose (mg/dl) /405] [28, 29].6) Serum total cholesterol (TC) levels according to Allain et al. [30] using rat cholesterol enzyme-linked immunosorbent assay kit, (Catalog Number: 2011-11-0198, Shanghai Sunred biological technology, China). 7) Serum triglycerides (TG) levels: according to Naito, [31] using rat triglycerides enzyme-linked immunosorbent assay kit (Catalog Number: 2011-11-0250, Shanghai Sunred biological technology, China). 8) Serum high density lipoproteins (HDL) levels: according to Warnick et al. [32] using rat HDL-cholesterol enzyme-linked immunosorbent assay kit, (Catalog Number: 2011-11-0255, Shanghai Sunred biological technology, China). 9) Serum low density lipoproteins (LDL) levels according to Friedwald et al. [33] LDL was calculated as follows: LDL=TC-HDL-TG\5 10) Serum very low density lipoproteins (VLDL) levels: according to Tietz, [34] VLDL was calculated as follows: VLDL= TG\5. 11) Serum alanine aminotransferase (ALT) and aspartate aminotransferase (AST) levels: by using rat ALT & AST enzyme-linked immunosorbent assay kit, (Catalog Number: 2011-11-0595, Shanghai Sunred biological technology, China) according to Rec, [35]12) Serum C-reactive protein (CRP): by using rat Immuno-enzymometric assay kits, (Monobind Inc Lake Forest, Ca 92630, USA), according to Kimberly et al. [36].Haemostatic parameters:1- Bleeding time (BT) according to Martin, [37]. 2- Whole blood clotting time (WBCT) according to Quick, [38]. 3- Prothrombin time (PT) using using coagulometer according to Arkin, [39]. 4- Activated partial thromboplastin time (aPTT) using coagulometer according to Ansell, [40]. 5- plasma fibrinogen levels using coagulometer according to Cooper and Douglas, [41]. 6- Plasma D-dimer levels by enzyme-linked immunosorbent assay kit, (GenWay Biotech, Inc, ca 40-88-234402, USA) according to Declerck et al. [42].Histopathological examination of liver:- All removed livers were fixed in 10% buffered formalin solution for duration of48-60 hours. After this, tissue samples were processed through ethyl alcohol and xylene series, and embedded in paraffine blocks. Liver specimens were sectioned (5µm thick), then stained with hematoxylin and eosin [43]. - An expert pathologist evaluated the stained samples in a blind fashion using Light microscope with camera attachment and scored them.The histological scoring of NAFLD followed the NAFLD Activity Score (NAS) proposed by The Pathological Committee of the NASH Clinical Research Network [44]. The score was composed of steatosis (0 = <5%, 1 = 5% − 33%, 2 = 34% −66%, 3 = >66%), lobular inflammation (0 = no foci, 1 = <2 foci per 200 × field, 2 = 2–4 foci per 200 × field, 3 = >4 foci per 200 × field), and ballooning (0 = none, 1 = rare or few, 2 =many or prominent). Fibrosis staging was recorded as following criteria: 0 = none, 1 = perisinusoidal or periportal fibrosis, 2 = perisinusoidal and portal/periportal fibrosis, 3 = bridging fibrosis, and 4 = cirrhosis. The score of (NAS ≥ 5 was defined as NASH, 2 < NAS <5 was defined as borderline and NAS ≤ 2 was defined as simple steatosis), cirrhosis was defined as grade 4 fibrosis plus other features of NAS [45].Statistical analysis:The data obtained in the present study were expressed as mean SD for quantitative variables and statistically analyzed by using SPSS program (version 18 for windows) (SPSS Inc. Chicago, IL, USA). One way Analysis Of Variance (ANOVA) was used to compare means of the groups followed by LSD test to compare statistical differences between groups. The correlations between parameters were analyzed using Pearson,s correlation. P values < 0.05 were considered to be significant.
3. Results
- This study revealed that HFD induced a significant and progressive increase in final body weight (P<0.001), BMI (P<0.001) and AC in groups IIa, IIb & IIc ((P<0.01, P<0.001, P<0.001, respectively) (table 1).
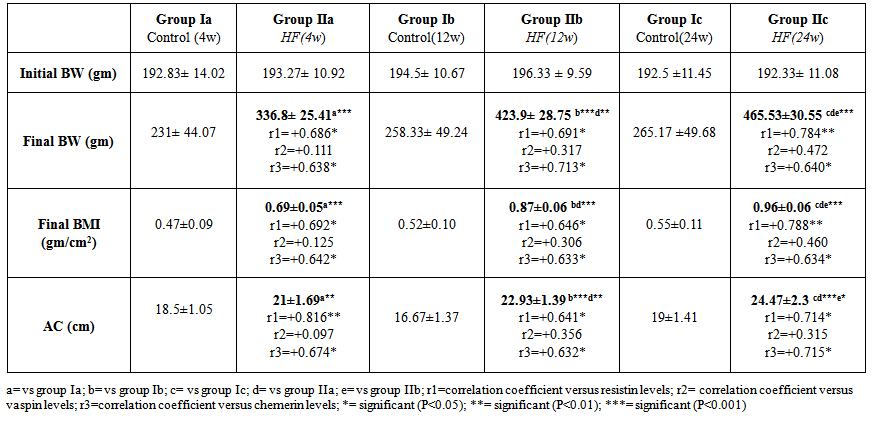 | Table 1. Anthropometric measures in all studied groups |
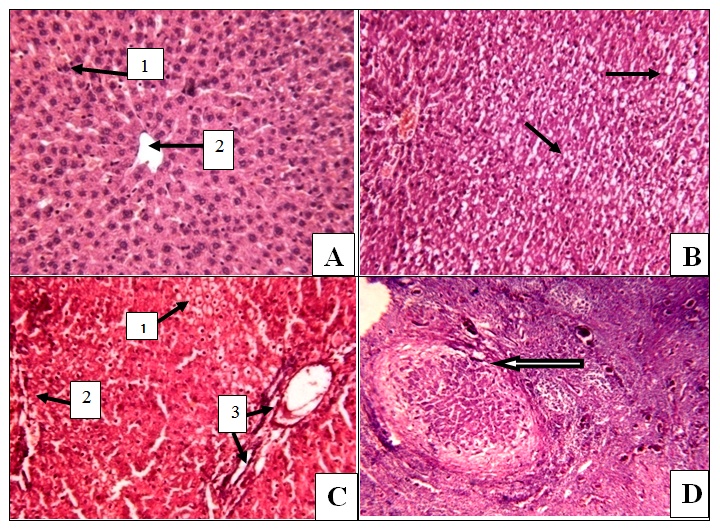 | Figure 1. Photomicroscopic pictures of isolated liver tissue stained with Haematoxylin & Eosin and viewed under high power magnification x200 showing: A) Normal liver tissue with normal architecture, (1) normal hepatocyte and (2) normal central vein in control group; B) Fat droplet deposition (the arrow ↑) extending in up to 66% indicating steatosis grade 2 in group (IIa); C) NASH with (1) fat deposition, (2) portal mononuclear cell deposition indicating inflammation and (3) portal fibrosis in group (IIb) ; D) loss of normal hepatic architecture with cirrhotic nodule surrounded by fiberous tissue (the arrow ↑) in group (IIc) |
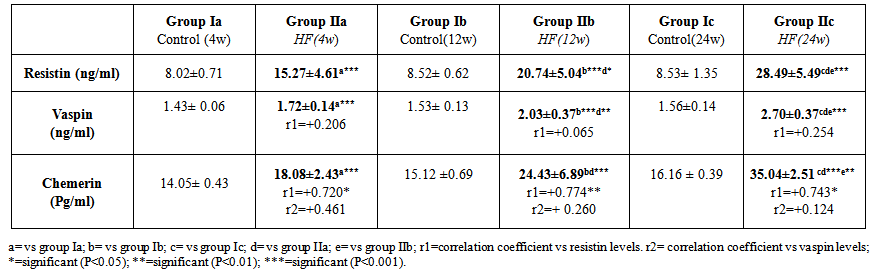 | Table 2. Serum levels of adipokines (resistin, vaspin and chemerin) in all studied groups |
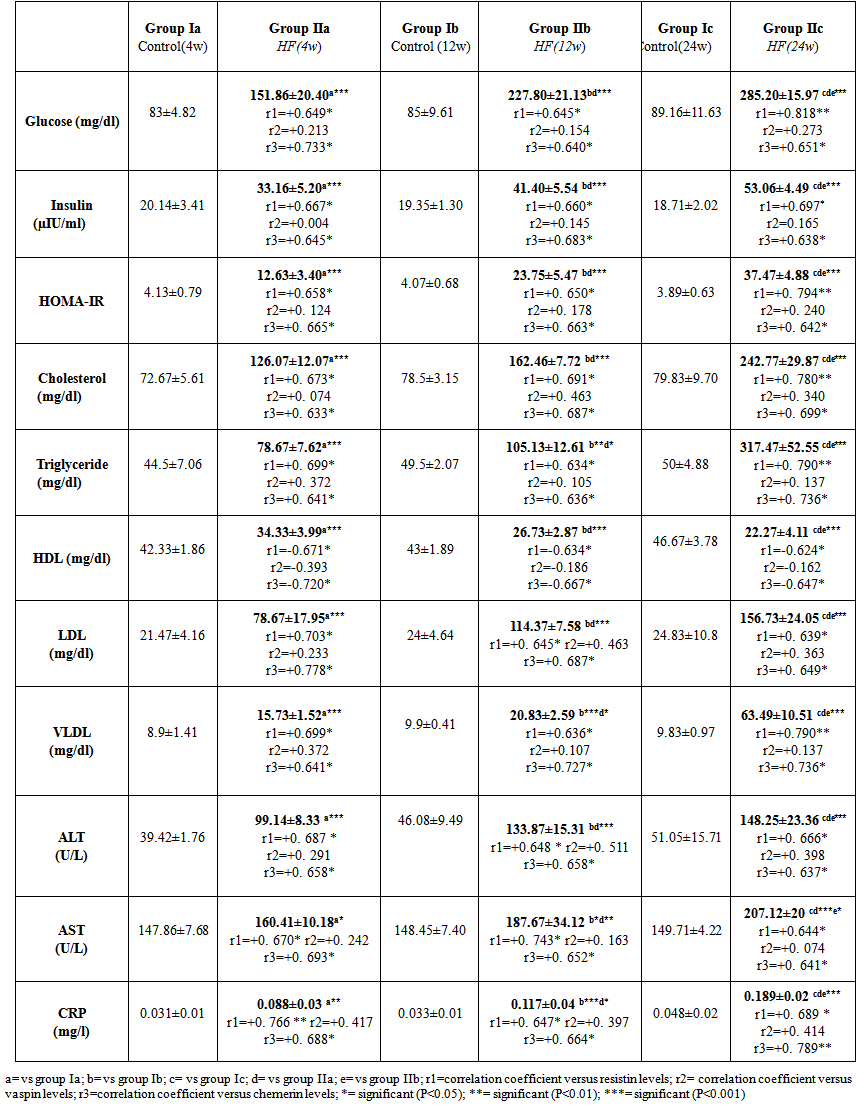 | Table 3. Serum biochemical parameters in all studied groups |
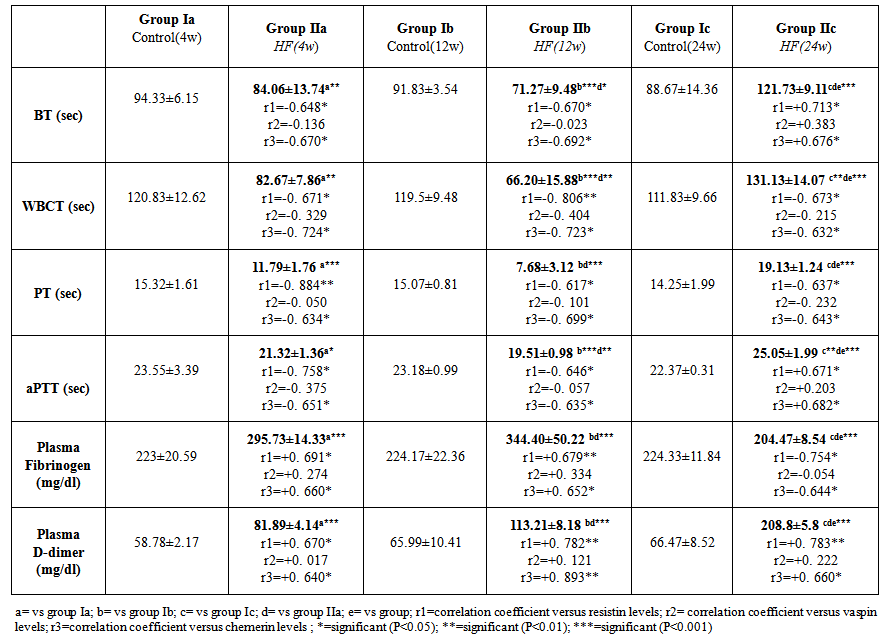 | Table 4. Haemostatic parameters of the studied groups |
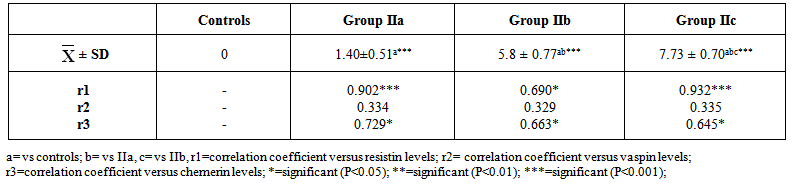 | Table 5. Histopathological scoring of liver injury induced by HFD |
4. Discussion
- The present study revealed that there was a significant progressive increase in final body weight, BMI, AC, serum levels of TC, TG, LDL, VLDL, glucose, insulin and CRP levels, in addition to HOMA-IR index in HFD-fed groups. Also, there was a significant decrease in HDL levels in the same groups. These results indicate that an obesity model induced by a HFD was encountered in this study. This model exhibited many features of the metabolic syndrome (metS) such as dyslipidemia, insulin resistance (IR) and DM II according to Timpson et al. [46] and You-Min et al. [47] classification. These findings are in line with those of other investigators [48, 49].In addition, the histopathological examination of the liver showed: (i) simple steatosis in rats fed HFD for 4w (group IIa) which was indicated by fatty infiltration with absence of necroinflammatory lesion, (ii) NASH in rats fed HFD for 12w (group IIb) which was indicated by foci of mixed inflammatory cell infiltration, (iii) cirrhosis in rats fed HFD for 24 w (group IIc) which was indicated by loss of normal hepatic architecture and the appearance of cirrhotic nodules, these histopathological changes were associated with a significant duration dependent increase in serum levels of ALT and AST.These results are in accordance with those of Svegliati-Baroni et al. [22] and Zhang et al. [50] who reported that, HFD successfully induced hepatic steatosis and steatohepatitis in rats. IR as evidenced by the significantly increased serum glucose and insulin levels in addition to increased HOMA-IR in the present work may contribute to development of NAFLD. Peripheral IR can induce hepatic steatosis, which in turn determines the occurrence of IR in the liver, characterized by reduced insulin-suppressing effect on hepatic glucose production that aggravates peripheral IR and contributes to hepatic lipogenesis [51]. In addition, IR inhibits β-oxidation of FFA thus further promoting hepatic lipid accumulation [52]. Moreover, IR impaires insulin suppressing effect on adipose tissue lipolysis resulting in an increased efflux of FFA from adipose tissue [53], which leads to steatosis as a consequence to the alterations in lipid metabolism [54].HFD can also promote a down regulation of hepatic LDL receptors, leading to a decrease in hepatic clearance of LDL with subsequent prolongation of VLDL and LDL plasma half-life and, therefore, have steatogenic effects [55, 56]. In addition, IR and hyperinsulinemia are also associated with the inflammatory and fibrotic reaction that complicates advanced stages of the disease [57]. Moreover, our results revealed a significant progressive increase in serum resistin levels in HFD-fed groups which was correlated positively and significantly with body weight, BMI, AC, serum glucose, insulin, cholesterol, TG, LDL, VLDL, CRP levels and HOMA-IR index, and negatively correlated with HDL levels in HFD-fed groups. However, no significant correlation was observed between resistin levels and the previously mentioned parameters in control groups. These results are supported by those of Stroubini et al. [58] who reported elevated resistin levels in many experimental models of obesity and decreased after weight loss, and by Azuma et al. [59] and Silha et al. [60], who demonstrated that the mean circulating resistin levels in obese subjects was increased about four folds compared with lean subjects. Furthermore, resistin concentrations were related to the total fat mass in patients with metS [61] and correlated positively with BMI and IR [62].Obesity-associated inflammation stimulates the adipocytes themselves to produce inflammatory mediators [63], which aggravate inflammation and thus, increases resistin secretion as one of those mediators, and vice versa. This vicious circle causes and maintains macrophages infiltration into adipose tissue [64]. In contrast, other studies revealed that resistin is down regulated in obese subjects and resistin had no correlation with insulin resistance [65, 66].In the present work, there was also a significant positive correlation between serum resistin level and serum ALT, AST and histopathologic scoring of liver injury in HFD-fed/NAFLD groups.These results are in accordance with that of Elsayed et al. [11] who showed that NAFLD patients had higher serum resistin compared to obese and controls. They stated that resistin may have a role in pathogenesis of NAFLD, as increased resistin levels in NAFLD could result in increased fatty acid synthesis, accumulation of triglycerides, and reduced fatty acid oxidation in the liver via IR and inhibiting adiponectin action [67].Moreover, resistin was recently shown to down regulate LDL receptors in primary hepatocytes, through an increase in cellular expression of the recently identified protease, proprotein convertase subtilisin/kexin type 9 (PCSK9), which enhances intracellular LDL receptors lysosomal degradation [68, 69].However, Shen et al. [70] demonstrated that serum resistin in NASH patients is similar with that in the subjects with simple steatosis, while resistin content in NASH liver is significantly higher than that in the liver of simple steatosis. They also reported that it is the resistin in the liver that may initiate the progression from simple steatosis to NASH which was correlated with inflammation and fibrosis and damage the liver tissue to release biomarkers of liver injury. Gambino et al [71] confirmed the significant direct association between CRP and resistin which might explain the inflammatory pathogenic role of resistin in aggravating liver histology as assessed by the NAFLD activity score.Moreover, in rodents, it was shown that resistin enhanced inflammatory cell recruitment and liver damage caused by Lipopolysaccharide (LPS), as resistin enhanced the expression of many of inflammatory genes induced by LPS and enhanced the increase in plasminogen activator inhibitor-1(PAI-1) expression caused by LPS as early as 1 h after injection which may contribute to the indirect increase in the other proinflammatory genes. Resistin also attenuated the increase in expression of the anti-inflammatory mediators as suppressor of cytokine signaling-1 (SOCS1) [72].In contradiction to our results Pagano et al. [66] found no correlation between resistin and CRP but they noted positive correlation between resistin and histological inflammatory score.On the other hand, Cho et al. [73] found that serum resistin levels were similar in normal liver, mild fatty liver and moderate to severe fatty liver. Regarding vaspin, our results showed that there was a significant progressive increase in its serum levels in HFD-fed groups. These results are in agreement with that of Fang-Fang et al. [74]. Moreover, the study of Abdel-lateif and El-Shaer [75] revealed that modest weight loss in obese subjects resulted in a significant decrease in serum vaspin concentrations. Those researchers suggested that the increase in vaspin may be a compensatory response to antagonize the action of other unknown proteases that are up-regulated in obesity and in states of IR; hence, this up-regulation may be a defensive mechanism against IR.In addition, Aktas et al. [21] reported that vaspin levels are significantly increased in patients with NAFLD, and alteration of serpins that affect its structure and/ or secretion disturbs its functional levels and results in several disease conditions including liver cirrhosis.Findings of the present study also revealed that there was a non significant correlation between serum vaspin level and body weight, BMI, AC, serum glucose, insulin, cholesterol, TG, LDL, VLDL, HDL levels and HOMA-IR index in the HFD-fed/NAFLD groups.In accordance, Saalbach et al. [76] and Goktas et al. [77] reported that there was no correlation between vaspin and BMI in diabetic patients.Regarding the relationship between circulating vaspin levels and lipid profile in the present study, our finding comes in agreement with the studies of Seeger et al. [13] and Atya et al. [78] that showed no correlation between vaspin and lipid profile in diabetic patients. However, positive correlation between vaspin levels and triglycerides levels in controls and obese subjects was found by Suleymanoglu et al. [79] and Inoue et al. [80]. In contrast, You-min et al. [47] and Giomisi et al, [81] showed a negative association between vaspin levels and lipid profile. Furthermore, in our study there was a non significant correlation between serum vaspin levels and serum ALT, AST, histopathological scoring of liver injury and CRP in HFD-fed/NAFLD groups.In accordance with our results, Ben-Dong et al. [82] reported that vaspin has no effect on inflammatory process in type II diabetic rats, as it cannot prevent TNF-alpha, monocyte chemotactic protein-1, tissue factor, and plasmogen activator inhibitor-1 -induced inflammatory injury. Inaddition, Gabriel et al. [83] noticed that serum vaspin level was negatively correlated with the degree of hepatocytes ballooning degeneration.In contrast, Aktas et al. [21] reported that serum vaspin levels represent an independent biochemical correlate of liver fibrosis scores. Moreover, Kukla et al. [15] have shown that serum vaspin levels were higher in NAFLD patients and correlated with hepatocyte ballooning degeneration which is a histopathological hallmark of liver cell injury in NAFLD. The discrepancy between our results and those of others may be due to differences in age, sex, species, sample size, nutritional status, degree of metabolic disturbances, other currently undefined factors that may affect vaspin or its substrate protease [84] or vaspin might be differentially regulated in humans and rodents as previously mentioned by Gulcelik et al. [84]. As regards serum chemerin, there was a significant progressive increase in serum chemerin levels in HFD-fed/ NAFLD groups. Our study also revealed that chemerin levels showed a significant positive correlation with body weight, BMI, AC, serum glucose, insulin, cholesterol, TG, LDL, VLDL, CRP and HOMA-IR index, and a significant negative correlation with HDL in HFD-fed/NAFLD groups. These results are in line with those of Parlee et al. [85] who concluded that chemerin is a marker of metS in which systemic concentration and adipose tissue expression are increased in obesity. In addition, Weigert et al. [86] reported that, Chemerin and its receptors are highly expressed in the liver, which strongly suggests that the liver is another important target for chemerin signaling. Our findings are supported also by those of Sell et al. [87] who demonstrated that chemerin impaired insulin signaling and glucose uptake in skeletal muscle cells via activation of mitogen-activated protein kinases (MAP), as potential mechanisms that might mediate the effect of chemerin on IR in skeletal muscle cells. In addition, there was also a significant positive correlation between serum chemerin level and serum ALT, AST, and histopathological scoring of liver injury in HFD-fed / NAFLD groupsOur results are supported by those of other investigators who concluded that, serum chemerin concentration is significantly higher in NAFLD and NASH patients compared with controls [15]. In addition, Zabel et al. [88] demonstrated that in cirrhosis there is elevated plasma chemerin liver. One of the potential roles of chemerin in the regulation of hepatic metabolism may be a direct effect on liver innate immune cells, including Kupffer cells and natural killer cells. So, in addition to its primary function in the modulation of inflammation and promoting adipocyte differentiation, may possess a biologic activity in the regulation of the pathologic progression in NAFLD [89]. The association of chemerin with the amount of macrophages in omental fat together with a relationship between chemerin and liver pathology speculated that chemerin could be a link between adipose tissue inflammation and liver pathology in obesity [17]. Additionaly, Parlee et al. [85] reported that TNF-α enhanced prochemerin synthesis and secretion from adipocytes.Chemerin concentration was similar in the portal and systemic circulation of patients with liver cirrhosis [90], and even elevated chemerin levels were found in the hepatic venous blood of cirrhotic patients. This may indicate that in cirrhosis, liver does not degrade chemerin derived from the portal vein. Further, hepatic release of chemerin is characteristic for cirrhotic livers [86].In contrast, Kukla et al. [91] showed that serum chemerin was negatively associated with necro-inflammatory grade in patients with chronic hepatitis C. Evidences indicate that metabolic disorders associated with obesity are initiated by the presence of a chronic “low-grade” state of inflammation which is aggravated by the recruitment of inflammatory cells, mainly macrophages in the adipose tissue [92] with subsequent release of inflammatory mediators that influence hepatic inflammation and the progression from steatosis to steatohepatitis [93].As macrophages are the main source of resistin [94] and plasma resistin levels are correlated with markers of inflammation [95], Mojiminiyi and Abdella [96] suggested a possible link between resistin and obesity and IR via pro-inflammatory pathways and its induction to CRP production [97]. Chemerin is highly expressed in macrophage [98] and was shown to have pro-inflammatory properties as it is strongly correlated with all markers of inflammation linked to obesity such as TNF-a, IL-6, CRP, leptin, and resistin [99, 89].The present study demonstrated a significant positive correlation between serum levels of resistin and chemerin in HFD-fed/ NAFLD groups. So as regards the pathogenesis of NAFLD, inflammation may be the link between resistin and chemerin as both hormones are released from inflammatory cells.Regarding the haemostatic parameters, the results of the current study revealed that while there was a significant decrease in BT, WBCT, PT, aPTT, there was a significant increase in plasma fibrinogen and D-dimer levels in the HFD-fed rats for 4 weeks (steatosis group, IIa) and 12 weeks (steatohepatitis group, IIb) when compared with the controls which indicates a state of hypercoagulability. These results are in line with those of Tripodi et al. [100] who reported that NAFLD is characterized by a procoagulant-imbalance which result from increased factor VIII and reduced protein C and might play a role in the risk of cardiovascular events and liver-fibrosis commonly observed in NAFLD.Moreover, platelet hyperactivity which is seen in individuals with the metS may be induced by the metabolic changes that accompany the metS, mainly IR, dyslipidaemia, oxidative stress, adipokines and inflammation [101]. Loss of platelet inhibition by insulin has been suggested to be a major determinant of platelet hyperactivity during obesity [102]. Also IR explains the impaired ability of: (i) prostacyclin to increase cAMP synthesis, (ii) cAMP to reduce platelet function and (iii) NO to increase cAMP in platelets from obese subjects [103].In addition, hypo-HDLaemia influences platelet aggregation, possibly because HDL opposes the activation properties of LDL on platelets [104]. However, the exact mechanisms of these effects are not clearly elucidated [105].Furthermore, adipokines directly alter platelet function. Meli et al. [106] reported that there was an increase in leptin level in HFD–fed animals. Leptin potentiates the normal response of platelets to ADP and thrombin [107] and up regulates the expression of tissue factor (TF), the primary in vivo initiator of the extrinsic coagulation cascade, leading to fibrin formation [108]. Dyslipidaemia occurring in metS may directly affect activation of coagulation factors. Excess VLDL supports activation of factor VII by the Xa/Va [109], Free fatty acids also inhibit the protein C system in endothelial cells which may be a mechanism for the prothrombotic state in metS [105], and HDL, the levels of which are diminished during the metS, attenuates the expression of TF and down regulates thrombin generation via the enhancement of the anticoagulant protein C pathway [110]. In parallel with inadequate vasodilatation, in obesity, endothelial cells take a proinflammatory phenotype with increased expression of vascular cell adhesion molecule-1 (VCAM-1), intercellular adhesion molecule (ICAM-1), E selectin, a release of microparticles [111]. However, one of the outstanding features of the present study in HFD-fed group for 24 weeks (cirrhotic group, IIc), there was a significant increase in BT, WBCT, PT, aPTT, and plasma D-dimer level accompanied by a significant decrease in plasma fibrinogen level when compared to the control group (group Ic). It was shown that an imbalance of pro- versus anti-coagulants could be detected in plasma from patients with cirrhosis [112]. With the severity of cirrhosis FVIII increases while, protein C decreases [113], together with the endothelial damaging effect of the endotoxins and the resultant contact activation of the intrinsic coagulation cascade , this points to an evidence for disseminated intravascular coagulation (DIC) which is an acquired hypercoagulable state [114] producing both thrombosis and hemorrhage [115].Our results are in agreement with those of Levi et al. [115] who demonstrated that the diagnosis of DIC is confirmed by a variety of laboratory studies that should demonstrate evidence of both increased thrombin generation (eg, decreased fibrinogen, prolonged PT and aPTT) as well as increased fibrinolysis (eg, elevated FDPs and D-dimer) and the degree of abnormality in these findings may correlate with the extensiveness of liver involvement.However, the tendency of patients with liver disease to bleed cannot be explained solely by alterations in hemostasis. A partial explanation of hemorrhagic events in patients with decompensated liver disease is provided by haemodynamic alterations such as portal hypertension, endothelial dysfunction, kidney dysfunction, and production of substances similar to heparin released by bacterial infections [116, 117].Moreover, in contrast to the significant negative correlation between serum chemerin and resistin levels and BT, WBCT, PT and aPTT and the significant positive correlation between their levels and plasma fibrinogen and D-dimer levels in HFD fed groups for 4 weeks (steatosis group, IIa) and 12 weeks (steatohepatitis group, IIb), HFD feeding for 24w (cirrhotic group, IIc) produced a significant positive correlation between serum resistin and chemerin levels and BT, WBCT, PT, aPTT and a plasma D-dimer level and a significant negative correlation between their levels and plasma fibrinogen levels. However, no significant correlation found between the above mentioned parameters and serum vaspin levels was detected in the same groups.These results are in accordance with those of Hoseen et al. [118] and Bobbert et al. [119] who stated that hyperresistinemia may represent a novel link between metabolic signals, atherosclerosis and hypercoagulability in type II DM, moreover, they reported that resistin leads to a procoagulant state by inducing TF expression and the activity of factor Xa.Resistin has been shown to selectively impair the effect of insulin on endothelial nitric oxide synthetase (eNOS) enzymatic activity and indicate a mechanism through which resistin can reduce insulin-evoked vasorelaxation [120], as resistin induces serine protease (Akt)-dependent endothelial NO dysfunction through the inhibition of insulin receptor substrate-1 (IRS-1) signaling pathway [121]. Moreover, in HFD-fed rats, resistin levels correlated negatively with vascular NO levels even after correction of insulin levels, which suggests a direct inhibitory role of resistin on NO secretion [122]. In addition, Li et al. [122] reported a significant positive correlation between resistin levels and endothelin levels in HFD-fed rats. Furthermore, Qi et al. [123] reported that, resistin was correlated positively with PAI-1 levels in women with metS. In fact, the increased levels of PAI-1 found in obesity may predispose to micro- and macro-vascular, arterial and venous thrombosis [124]. As regards the relationship between chemerin levels and haemostatic parameters, our results are in agreement with those of Morgan and Edrees, [125] who demonstrated positive correlation between chemerin levels and the atherogenic lipid profile and IR which supports the relation between it and the increased incidence of thrombo-embolic complication reported with obesity.Moreover, Landgraf et al. [126] indicated a significant associations of chemerin with the measures of inflammation such as CRP and white blood cell count, as well as with the markers of endothelial activation as ICAM-1 and E-selectin. So, they concluded that chemerin may act as a molecular link between increasing fat mass and an early atherogenic risk profile in obese subjects. Another study that investigated the role of chemerin as a novel link between metabolic signals and atherosclerosis has been revealed that serum chemerin levels were significantly higher in the coronary artery disease (CAD) patients than in the non-CAD group. Moreover, serum chemerin levels were significantly increased with the increasing number of diseased vessels [127].
5. Conclusions
- The present study showed that while resistin and chemerin levels were significantly increased in serum of NAFLD rats and correlated with markers of metabolic syndrome, and histopathological score of liver injury, serum vaspin was significantly increased but showed no significant correlation with those parameters. In addition, hyperresistinamia and hyperchemerinamia encountered in this study may represent a novel link between metabolic signals and hypercoagulability in NAFLD that may be responsible for the increased risk of thrombosis and liver fibrosis. Further studies will be necessary: (i) for a better understanding of the precise cellular and molecular mechanisms by which resistin and chemerin contribute to NAFLD development and progression.(ii) to elucidate whether resistin, vaspin & chemerin are causes or consequences of this disease.
ACKNOWLEDGMENTS
- To Professor/Kamal EL-Kashish, Pathology department, Faculty of Medicine, Zagazig University for performing liver histopathological study.