-
Paper Information
- Paper Submission
-
Journal Information
- About This Journal
- Editorial Board
- Current Issue
- Archive
- Author Guidelines
- Contact Us
Basic Sciences of Medicine
p-ISSN: 2167-7344 e-ISSN: 2167-7352
2012; 1(5): 46-53
doi:10.5923/j.medicine.20120105.05

Osteoprotegerin as a Bone Marker of Osteoporosis and Their Relation with Obesity and Leptin
 Abstract
 Reference
 Full-Text PDF
 Full-text HTML
Eman M. I. Youssef1, Gehan H. Ewieda1, Haneya A. A. Ali2, Amany M. Tawfik2, Amgad A. Ezzat3, 4, Nashwa El-Khouly5, Emad E. Radwan6
1Department of Medical Biochemistry, Faculty of Medicine (for girls), Al-Azhar University, Cairo, Egypt
2Department of Microbiology & Immunology, Faculty of Medicine (for girls), Al-Azhar University, Cairo, Egypt
3Department of Microbiology & Immunology, Faculty of Medicine, Al-Azhar University, Assuit, Egypt
4Department of Microbiology & Immunology, Faculty of Medicine, Tabuk University, KSA
5Department of Internal Medicine, Faculty of Medicine (for girls), Al-Azhar University, Cairo, Egypt
6Department of Obstetrics and Gynecology, Suez Canal University Hospitals, Egypt
Correspondence to: Eman M. I. Youssef, Department of Medical Biochemistry, Faculty of Medicine (for girls), Al-Azhar University, Cairo, Egypt.
| Email: |  |
Copyright © 2012 Scientific & Academic Publishing. All Rights Reserved.
This work is licensed under the Creative Commons Attribution International License (CC BY).
http://creativecommons.org/licenses/by/4.0/

Osteoporosis (OP) is a growing chronic health problem and leads to loss of bone mass over a long period of time. The osteoporotic risk for women increases soon after menopause. Osteoprotegerin (OPG) is a potent inhibitor of osteoclasts and plays an important role in bone metabolism. Obesity is a protective factor for OP, as bone mineral density (BMD) increases with weight. Leptin (LEP) is one of the circulating peptides secreted by adipose tissue and contributes to mediate the effects of fat mass on the bone. In order to diagnose the post-menopausal osteoporotic women we evaluated the diagnostic significance of circulating levels of OPG and determine if OPG correlated with BMD in addition to assess their relationships among obesity and the serum LEP levels. The study population included ninety post-menopausal women. They were divided into two groups: Group I (n = 48) postmenopausal obese females with body mass index (BMI) >30 kg/m2 and group II, forty two age-matched postmenopausal women, non-obese with BMI 20–25 kg/cm2 served as controls. The bone mass can be assessed by measuring BMD using dual-energy X-ray absorptiometry (DEXA). Serum OPG and LEP concentrations were assessed by ELISA. The obese group had higher BMD mean T scores at two sites of the body than the non-obese group (P≤0.001). The obese females also showed statistically highly significant increase in serum LEP levels (P≤0.001), in addition to lower levels of OPG and ALP (P≤0.001). When viewing all subjects of the study, the correlations of BMD mean T scores were still apparent either negatively with OPG and ALP (P≤0.001), or positively with LEP (P≤0.001). In the assessment of post-menopausal osteoporotic women, we found that the serum OPG could serve as a valuable tool for clinician in prediction of mean T score and the most diagnostic bone marker to discriminate females with reduced BMD from normal subjects.
Keywords: Osteoporosis (OP), Post-Menopause, Osteoprotegerin (OPG), Leptin(LEP), Alkaline phosphatase (ALP), Bone mineral density (BMD), Body mass index (BMI), Dual-Energy X-Ray absorptiometry (DEXA)
Cite this paper: Eman M. I. Youssef, Gehan H. Ewieda, Haneya A. A. Ali, Amany M. Tawfik, Amgad A. Ezzat, Nashwa El-Khouly, Emad E. Radwan, Osteoprotegerin as a Bone Marker of Osteoporosis and Their Relation with Obesity and Leptin, Basic Sciences of Medicine , Vol. 1 No. 5, 2012, pp. 46-53. doi: 10.5923/j.medicine.20120105.05.
Article Outline
1. Introduction
- Osteoporosis (OP) is a disease of muscle skeleton system and the major public health problem in senile people and older women, which affects millions of people around the world and its frequency increases by age [1, 2]. Egyptian women showed that they have lower bone mineral density(BMD) compared to their western counterparts [3]. As for the cellular level, bone tissue in adults undergoes a continuous process of remodeling by which old bone is removed by bone-resorbing cells (Osteoclasts) and is replaced by the new bone synthesized by bone forming cells (Osteoblasts) [4]. The bone remodeling cycle is completed in a period of 3–6 months. Bone mass is subjected to relative small variations between puberty and menopause due to the balance between osteoblasts and osteoclasts activity [5]. When resorption is greater than formation, bone mass / density reduced and micro-architectural deterioration of bone tissue, leading to OP, which increases in bone fragility and susceptibility to fracture [2, 6]. OP is a multi-factorial disease with potential contributions from genetic, endocrine functional, exercise related and nutritional factors [7]. The most commonly used tool to diagnose OP and predict fracture risk is the assessment of BMD in different locations according to the WHO criteria, i.e. a T-score below -2.5 SD and/or a prevalent fragility fracture and a large proportion of fractures occur at T-scores above -2.5 SD [4, 8].Osteoprotegerin (OPG) or osteoclastogenesis inhibitory factor (OCIF) is a secretory glycoprotein. OPG consists of 401 amino acid residues; it has a molecular weight of 60 kDa as a monomer and 120 kDa as a disulfide-linked dimer and is produced in different tissues, e.g. bone, skin, liver, stomach, intestine and lung [9, 10]. It produced by the osteoblast, which is respond to pro-resorptive stimuli increasing receptor activator of nuclear factor kappa B (κβ) ligand (RANKL) production, which promotes osteoclastogenesis [11, 12]. OPG is involved in osteoclastogenesis regulation with inhibiting bone osteoclastic activity, proliferation and inducing osteoclasts apoptosis. It acts as a soluble factor in the regulation of bone mass and bone remodeling [13]. In postmenopausal women, estrogens increase OPG production by the osteoblast; however, bone remodeling and OPG are increased in postmenopausal women with OP.OPG seems to play a role as a possible marker for diagnosing and monitoring post-menopausal OP [14, 15]. Obesity is a growing problem worldwide and associates several metabolic complications but appears to act as a protection factor against OP due to increased BMD, elevated leptin (LEP) concentrations, except in rare situations in those with LEP gene mutation , and decreased risk for osteoporotic fractures seen in obese subjects [16]. The adipocyte plays an important role in regulating bone metabolism by releasing estrogens, and the adipokines, like LEP, which is a hormonal polypeptide released by adipocytes and a product of the obesity gene(Ob-gene) that is strongly correlated with fat mass [17]. It regulates appetite and energy expenditure [18]. LEP acts on bone by two different mechanisms. The first is the indirect; LEP secreted from fat cells and then is carried by the receptors of vascular endothelial cells across the blood-brain-barrier where it activates receptors in the hypothalamus. These signals then stimulate expression of HOBIF (hypothalamic osteoblast inhibitory factor) which when released, lowers the matrix-making ability of osteoblasts. The second direct mechanism of LEP action is by directly stimulate bone growth acting as a local parathormone (PTH) -like stimulator of osteoblast activity, as well as an inhibitor of osteoclast generation [19-21].
2. Subjects and Methods
2.1. Subjects
- The study was performed on a total number of ninety postmenopausal women who were chosen from the outpatientclinic of Obstetrics and Gynecology Department of Suez Canal University Hospitals and of Internal Medicine Department of Al-Zaharaa University Hospital, Cairo, Egypt, between September 2010 and July 2011. They were all at least 1-3 years postmenopausal. They were divided into two groups, group I included 48 obese postmenopausal women (BMI>30 kg/ m2) and group II included forty-two non-obese females with BMI 20–25 kg/cm2 as controls. Both groups were matched as regards age, sex and duration since menopause. Their ages ranged between 47- 69 years with a mean of 59.31±8.50 years. All these women gave priorverbal informed consent. Exclusion criteria: The women were screened to exclude chronic disease (as renal, hepatic and cardiac diseases), disease of parathyroid, thyroid, diabetes mellitus, active infection, rheumatoid arthritis, mal-absorption syndrome and history of previous pathological fractures and traumatic fractures within one year. Women were also excluded if they had prior treatment or were receiving medications known to interfere with bone metabolism such as anticonvulsants, corticosteroids, calcitonin, heparin, oral contraceptive pills, calcium, or vitamin D.
2.2. Methods
- All women were subjected to: Detailed medical history, menstrual history including age, duration since menopause, history of fertility, and exposure to sun, dietary habits, exercise level, history of previous fracture and family history of metabolic bone diseases and full clinical examination. Anthropometric measurements: Including height, weight and body mass index (BMI). BMI was calculated as follows: weight/ height2 in kg/m2. Radiological investigations (BMD Measurements): BMD was measured by dual energy x-ray absorptiometry (DEXA) scan for all subjects in the study. A cutoff value of -1 for the T score of both back lumbar spine (LS) and femoral neck bones (FN) was taken to differentiate between subjects with normal BMD and those with reduced BMD. So the subjects were further divided into: Normal BMD group (I) included subjects with T score higher than -1 at both sites (LS and FN). Reduced BMD group (II) included subjects with T score less than -1 at either or both sites (Either osteopenia with T score between -1 and -2.5, or osteoporosis with T score less than -2.5). Laboratory investigations: Blood samples for assaying of serum calcium, phosphate and ALP. The reference range of serum calcium was 8.0-11.0 mg/dl and the reference range of serum phosphorus was 2.7- 4.5 mg/dl. Serum concentrations of OPG and LEP of all individuals were measured by ELISA. Specimen collection: Early morning 7 ml venous blood sample was collected at 9-10 am in plain tubes from all subjects after an overnight fast (12-16 hr) in vacutainer tubes. Clotted samples were centrifuged at 3000 rpm for 5 minutes. After centrifugation, serum was separated and divided into 3 aliqutes, one of them was immediately used for the determination of serum calcium, phosphorus and ALP. The others were stored at -70°C until analysis of serum OPG and LEP.
2.3. Measurement of Human Serum LEP Level by ELISA Method
- Serum LEP level was measured by a commercially available LEP-ELISA kit (Catalog No.: EIA-2395), supplied by DRG International, Inc., USA. The procedure was performed according to the manufacturer’s instructions. It is a solid phase enzyme-linked immunosorbent assay (ELISA) based on the sandwich principle. The microtiter wells are coated with a monoclonal antibody directed towards a unique antigenic site on a LEP molecule. An aliquot of specimen sample containing endogenous LEP is incubated in the coated well with a specific biotinylated monoclonal anti-LEP-antibody. A sandwich complex is formed. After incubation the unbound material is washed off and a steptavidin peroxidase enzyme complex is added for detection of the bound LEP.
2.4. Measurement of Human Serum OPG Levelby ELISA Method
- OPG was estimated by using the RD194003200 human-OPG-ELISA kit produced by BioVendor, LLC 1459 Sand Hill Road Suite 229 Candler, NC 28715, USA, according to the manufacturer’s instructions. The standard or sample is incubated with a mouse monoclonal anti-human-OPG-antibody coated in microtiter wells. After one-hour incubation and a washing, biotin-labeled polyclonal anti-human-OPG-antibody is added and incubated with captured OPG. After a thorough wash, streptavidin-horseradish peroxidase conjugate is added. After half-hour incubation and the last washing step, the remaining conjugate is allowed to react with the substrate H2O2-tetramethylbenzidine. The reaction is stopped by addition of acidic solution and absorbance of the resulting yellow product is measured at 450 nm. A standard curve is constructed by plotting absorbance values.
2.5. Statistical Analysis
- Data were analyzed using SPSS version 20. Mean and standard deviation (SD) were used to describe numerical data. Comparison between means of the two groups was performed using Student’s t-test for normally distributed data or the Mann-Whitney U test for non- parametric distribution. Spearman correlation co-efficient test was used to rank variables versus each other positively or inversely. The receiver operating characteristic curve (ROC) was used to assess the diagnostic value of OPG and to identify the best cut-off values with its sensitivity and specificity. Clinical variable correlation was evaluated by linear regression analysis. A p-value < 0.05 was considered statistically significant, p < 0.001 was considered highly significant or p > 0.05 was considered non-significant.
3. Results
- General characteristics of the studied population and results of measurements are shown in table 1. The mean T scores (LS and FN) of obese females were significantly higher than that of the non-obese females (P ≤ 0.001). Obese females also showed a highly significantly increase of mean serum LEP compared to other group (P ≤ 0.001). Mean serum OPG was significantly lower in obese group than in non-obese group (P ≤ 0.001). The results of ALP were expressed as medians and percentiles and the Mann-Whitney U test was used for their comparison between two groups. In non-obese subjects, there was significant increase in the median of ALP value (P ≤ 0.05). Serum calcium mean was higher in obese females compared to non-obese females, while phosphorus was lower. However, both of them were non-significant.
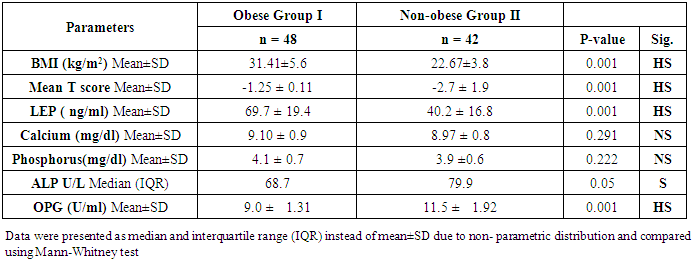 | Table (1). Characteristics of the post-menopausal women, comparison between two studied groups as regard clinical, laboratory and radiological investigations |
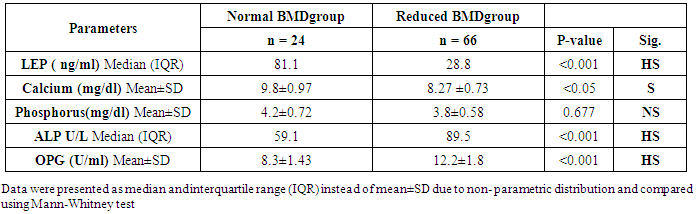 | Table (2). Comparison of studied parameters in normal and reduced BMD groups |
|
|

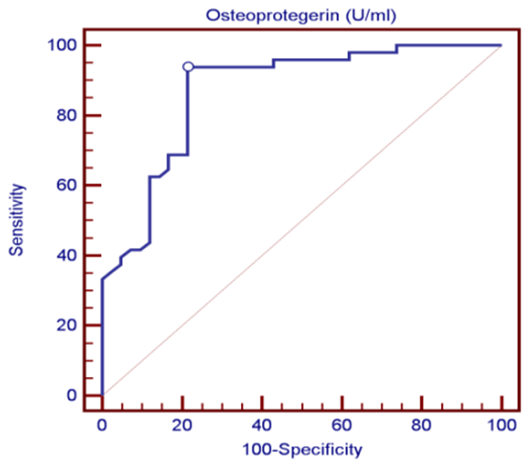 | Figure (1). ROC curve analysis in the diagnosis of osteoporosis, OPG could be useful in the diagnosis of OP because the AUC was 0.87 |
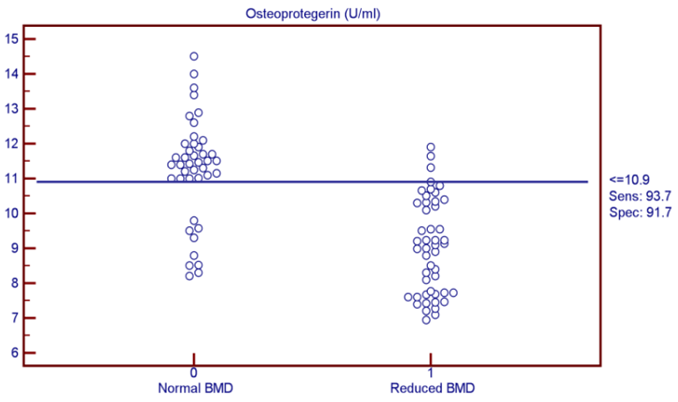 | Figure (2). OPG was found to be the most discriminating factor between normal and reduced BMD subjects from the analysis of ROC curve |
|
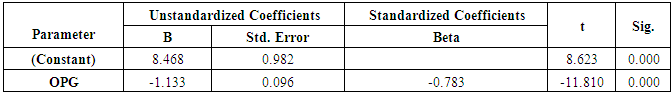
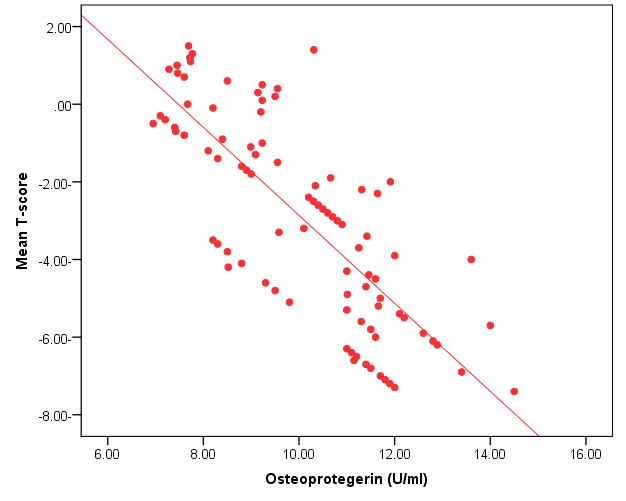 | Figure (3). Linear regression curve showing highly statistically significant negative association between OPG and mean T-score |
4. Discussion
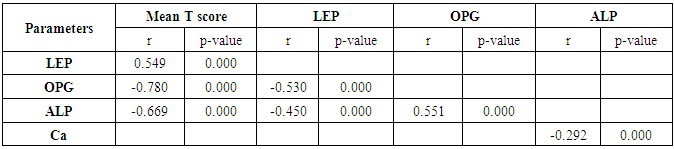
- The objectives of this study were to assess whether the levels of OPG can be useful as a diagnostic biomarker in osteoporotic post-menopausal women in addition to investigate their correlations among obesity, LEP and BMD. In the view of current data, mean T-scores of BMD of lumbar spine and femoral neck were significantly higher in obese females than non- obese ones, which is in coordination with what was previously mentioned about the protective effect of obesity against OP. As obesity is usually associated with increased serum LEP concentrations and showed highly significant increase in obese females (P ≤ 0.001) compared to non-obese subjects. Furthermore, OPG levels were significantly higher in non-obese females (P ≤ 0.001) than in obese ones. Currently, when females were divided into normal and reduced BMD groups, there was a statistically significant decrease of LEP levels in reduced BMD patient group (P≤0.001) compared to normal BMD control group; this means that the LEP may be involved in bone protection against OP. Besides, we found out that the levels of OPG and ALP were statistically highly significant increases in reduced BMD compared with normal BMD groups (P≤0.001) among our postmenopausal. The Pearson correlation test on all subjects indicated a highly significantly direct correlation between serum LEP level and mean T-score BMD at two sites (LS and FN) of the body. However, a significant inverse relationship was found between circulating LEP and OPG levels. Also, a highly significant indirect correlation between serum OPG and mean T-score BMD at both sites were identified in postmenopausal women as well as ALP levels were significantly negative correlations to mean T-score BMD and the serum LEP concentrations in postmenopausal women, while ALP was positively significant correlation with OPG. These correlations extended through the whole population of the study whether they were obese or not and when dividing females into groups with normal and reduced BMDs.Findings of Jen et al. [22] concluded that LEP may be a predictor for BMD in all females were postmenopausal and the non-obese females were certainly more prone to have low BMD. Similar results were concluded by Odabasi et al. [23]; LEP was correlated with BMD in patients with OP but not in healthy controls. This was obvious in the study done by Yilmazi et al. [24]. They reported that LEP was a good predictor of BMD, in postmenopausal white women. Rroux et al. [25] and Zhonga et al. [26] confirmed the same results, who observed significant positive correlations between serum LEP levels and BMD values in postmenopausal women with significantly lower levels of LEP in women with vertebral fractures. On the other hand, a study of Japanese women concluded that LEP was not an important factor in bone metabolism. Other study done by Ruhl et al. [27], they reported that there was no direct relation between serum LEP and BMD. Also, Shaarawy et al. [28] found no correlation between LEP levels and BMD in postmenopausal osteoporotic women. Jen et al. [22] reported that LEP has no effect on bone and the relationship between LEP and BMD become apparent only when the risk of OP is high.The results of OPG in the present work were in coordination with the findings observed by Stejskal et al. [29]. They stated that there was a negative linear correlation between OPG and BMD of the body, and persons with normal BMD had medians less than those with OP. This was also supported by the work of Rogers et al. [30], who stated that a significant negative correlation was observed between OPG and BMD at total body, total hip, and femoral neck. In a prospective study, Dobing et al. [31] gave Bisphosphonates to previously untreated postmenopausal osteoporotic women. They suggested that OPG may be used as an indicator of response to treatment. In a study by Yano et al. [32] concluded that the OPG serum levels were negatively correlated with BMD at various sites (lumbar spine, femoral neck and total body) and positively correlated with biochemical markers of bone turnover. Arrighi et al. [33] and Browner et al. [34] confirmed the negative correlation of OPG serum concentrations and BMD in postmenopausal women. Also in agreement with our results, Wen-Tien et al. [35] found that the study was conducted on 28 postmenopausal hemodialysis (HD) patients in addition to 28 age-matched postmenopausal women with normal renal function as controls. BMD was measured by DEXA in both hips. Low BMD was defined as femoral neck T-score <-2.5. Serum OPG levels were measured using ELISA kit. They concluded that an increased serum OPG level was significantly correlated with low BMD in postmenopausal HD patients.On the contrary, Khosla et al. [36] and Kudlacek et al. [37] found no association between OPG and BMD. Similar results were observed by Ulivieri et al. [38] in only 25 osteoporotic patients and were all with T score <-2.5 SD in all the explored skeletal sites and did not find any correlation between OPG and BMD. In another study, Fahrleitner-Pammer et al. [39] noted that a strong independent positive association between OPG and BMD was found in cardiac transplant patients. In a similar work done by Ueland et al. [40], who found that the level of OPG, did not correlate with BMD, even if bone density was markedly reduced in all the considered skeletal sites of their patients.In summary, this study has proved that the mean T scores (LS and FN) of obese females were significantly higher than that of the non-obese females (P ≤ 0.001). Obese females also showed a highly significantly increase of mean serum LEP compared to other group (P ≤ 0.001). Mean serum OPG was significantly lower in obese group than in non-obese group (P ≤ 0.001). In non-obese subjects, there was significant increase in the median of ALP value (P ≤ 0.05). According to the results of BMD measurement by DEXA, LEP values were significantly higher in normal BMD group compared to reduced BMD group (P ≤ 0.001). LEP can act on bone remodeling in postmenopausal women, by it was positively correlated with mean T-score BMD at two sites (LS and FN) of the body. But, LEP did not consider appropriate for the diagnosis of OP. Serum OPG as a biochemical bone marker was statistically significant increase in reduced BMD with an increased rate of bone loss in elderly women and also the correlations of OPG were apparent either negatively with BMD or positively with ALP. Accordingly the analysis of ROC curve, OPG was found to be the most diagnostic bone marker to discriminate females with reduced BMD from normal subjects. As regards high validity and overall accuracy, AUC was 0.871, at cut off value ≤10.9 U/ml; serum OPG showed 93.75% sensitivity and 91.7% specificity. Finally, an interesting finding in our study was the linear regression, showed that there was a highly statistically significant negative association between OPG and mean T-score which means that can predict mean T-score from OPG. So OPG can be considered the most suitable predictor of mean T score among osteoporotic postmenopausal women.From the clinical point of view, the serum OPG could serve as a valuable tool for prognosis, early detection, diagnosis and follow up for patients with OP, especially with the long duration needed for DEXA to detect any changes in BMD and adequate to monitor the response to treatment. Compared to DEXA, assay for OPG is safe, easily performed and less expensive than bone mass measurements. Lastly, the present study is somewhat limited in statistical data due to the small sample size. Further analyses with greater number of patients are recommended to gain greater insight into potential usefulness of therapeutic function of OPG together with its diagnostic effect in patients with OP. The use of LEP in future researches to find out its potential target for therapeutic role on BMD and for prevention of OP.