Syahril Taufik1, Budi Tjahjono2
1Department of Civil Engineering, Lambung Mangkurat University, Banjarmasin, Indonesia
2Department of Civil Engineering, Darwan Ali University, Seruyan, Indonesia
Correspondence to: Syahril Taufik, Department of Civil Engineering, Lambung Mangkurat University, Banjarmasin, Indonesia.
| Email: |  |
Copyright © 2019 The Author(s). Published by Scientific & Academic Publishing.
This work is licensed under the Creative Commons Attribution International License (CC BY).
http://creativecommons.org/licenses/by/4.0/

Abstract
This paper discusses about 3D ANSYS FE modeling of the failure behavior of encased composite steel-concrete element. The capacity of axial load, deformation, stress, strain, fracture patterns and ductility is determined by what occurs on a single composite column with wide flange and hollow section of steel confinement. The results shows that the composite column can be analyzed using ANSYS software with modified model. The behavior of composite columns can be determined by the analysis of calculation and FEM that columns with tensile collapsed condition has a lower flexural capacity and collapse behavior is more ductile than that of the column with compressive collapse and balanced condition. According to Indonesian Structural Steel Code, manual calculation analysis is more suitable to represent the composite column behavior of collapsed condition. Based on the results of the analysis, it shows that the higher column capacity reduced ability ultimate axial load for the higher it is profile steel grade result improve ultimate load resistance, while influence encased steel to ultimate axial load for all model is not significant. The pattern of stress-strain distribution during yielding spreads throughout the column area, but when it reaches the ultimate distribution it is concentrated in the pedestal area. The first crack dominantly occurs in the support area and generally occurs in the concrete blanket layer, when it reaches the ultimate crack condition has already occurred evenly across the column area.
Keywords:
Composite Column, Encased, Confined, FEM, ANSYS
Cite this paper: Syahril Taufik, Budi Tjahjono, 3D ANSYS Modeling Behaviour of Encased Steel Composite Column with Wide Flange and Hollow Section, International Journal of Mechanics and Applications, Vol. 9 No. 1, 2019, pp. 10-18. doi: 10.5923/j.mechanics.20190901.02.
1. Introduction
Composite column will give economic advantages and will be able to resist large load capacity with a smaller cross section compared to using conventional reinforced concrete columns. Other privilege is better resistant to fire and corrosion compared to ordinary steel column and also the effect of strength towards holding buckling [1].One of the factors to increase column ductility which uses concrete material is by attaching steel in the middle of the column, such as reinforced steel or profile steel, so that the column will be able to resist the tensile load. It is expected that the congenial combination between concrete capable of receiving pressure load and steel with its high tensile strength will balance the combination of brittle concrete properties and elastic steel properties. Steel-concrete composite column is more optimal to be used on planned building structure because the dimension is smaller, therefore it can reduce material cost [2].ANSYS Finite Element modelling is one of the numerical methods that are widely applied in composite structures based on three dimensional nonlinear behavior of materials, to simulate and predict the behavior of reinforced concrete and composite structure elements by tip displacement control instead of load step method [3, 4].There are many methods for modeling the behavior of steel and concrete structures through analytical and numerical approaches with three dimensional non-linear models as determined stress contour, crack pattern, deformation and load capacity [5-9]. Analyzing the modeling is done by using element method by computed 3-D ANSYS application, to obtain a valid analysis result from the use of application by firstly doing modeling analysis from the experimental testing result that has been done before in the laboratories. This validated analysis result is considered as a comparison material and parameter in analyzing the modeling in this research [10].Therefore, in this research, the authors analyzed the behavior of composite concrete columns by installing several profile steel models given static load column centric direction, which the behavior is analyzing the spreading distribution and stress concentration (von Mises stress), the crack pattern that occurs to concrete material, also analyzing the ultimate axial load capacity ability given static load column centric direction, as well as analyzing the ductility behavior from column structure when receiving ultimate load.
2. Methodology
A force and moment that works towards a point from cross section produces stress distribution that works on the cross section. Generally, stress is divided to normal stress and shear stress. Normal stress is caused by force that works on normal axis whereas if the force that works causes length increment then it is called pull force, however if the force that works causes member length decrement then it is called push force. Shear stress is caused by force that works on tangential cross section.A force that works on an object, will change the form and size of the object. In pull force, object will lengthen and the area of the cross section will shrink, meanwhile the force on the object will shorten and the cross area will grow with the result that the total volume will stay the same. Strain describes deformation that occurs on length and corner between two points. Normal strain is the length increment of unit length and shear strain is the corner change between two lines that was first perpendicular before deformation. The ability of structure or component to resist inelastic response, including the biggest deflection and absorbs energy is called ductility. Ductility is the ability of a structure to sustain big elastic deformation repeatedly and cyclic cause of lateral load which causes the first meltdown, whilst resisting enough strength and stiff, so that the structure will still hold, even though the condition is on the verge of collapse. Ductility on building structure is the ratio between building structure maximum deformation as the effect of influence of lateral load plans when reaching the verge of collapse condition with structure deviation during the first yielding [11].According to previous work [6], to achieve ductile condition, a structure should be able to bear load and able to sustain great deform so that it approaches maximum load service capacity. This is to prevent sudden collapse (brittle failure) to prevent casualties because there is an early warning of a total structural collapse.Nonlinear Finite Element Method using ANSYS application has been popular for the past decade to analyse reinforced concrete structure. This method results many kinds of useful information from a computer program. The information includes deformation stress, strain normal distribution and shear stress in concrete material, crack pattern in several stages, loading and strength in longitudinal and transverse steel and so on.ANSYS computer program is used to analyze many structure model including reinforced concrete column model. Modeling analysis using Element Method up to 3-D by using ANSYS computer program is commonly used in education and research to analyze structures. This research is using Finite Element Analysis Method with the ANSYS software.
2.1. System Approach
This research is conducted by doing 3D numerical modelling of composite column modeling using finite element analysis under nodal tip displacement step. The analysis will result of nodal force, elements displacements, deflection, and stress contour diagram. Besides that, it will also result a crack pattern to predict the ability of the composite column when encountering ultimate pressure load and the behavior of composite model used on the column crack with normal strength concrete model variation.
2.2. Model Design
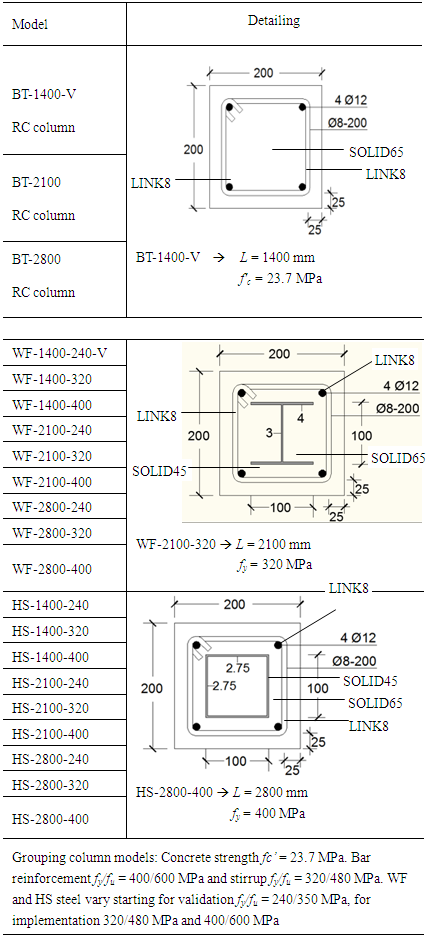
In this research, analysis is done by modeling reinforced concrete column using Element analysis up to 3-D with the application of ANSYS. Element analysis up to 3-D using Graphical User Interface (GUI) which is doing 3-D modeling following the real form in the field in laboratory research. The form of the model is reinforced concrete column using normal strength concrete material, which is installed in the main reinforcement and stirrup reinforcement using material reinforcing steel.Concrete, reinforced steel and encased steel model are defined as the following material types: Type - 1, Concrete model by SOLID65 element.Type - 2, Encased steel model by SOLID185 element (only for composite concrete column, not for reinforced concrete column )Type - 3, Steel reinforcementd model by choose LINK8 elementType - 4, Stirrup reinforced steel model by LINK8 elementType - 5, Pedestal and loading plate model for column placement support by SOLID45 elementIn this research, the size of the column dimension model that is used is set 200x200x1400 mm using the validated column dimension that has been analysed in the laboratory so that the dimension column for this research and validation size has no difference. The column dimension in this research is set the same size in order to minimalize the effect of factors that can make the result of this research can be biased if the dimensions are used differently, therefore the dimension that has the same size will prevent mistakes in this analysis caused by dimension factors, thereby also for the size of the reinforcement diameter both main reinforcement and stirrup reinforcement is also using validates column dimension size which is 4 pieces of Ø12 mm main bar reinforcement. For stirrup reinforcement in the support and mid span area is Ø8 mm with 200 mm spacing. There is a total of 21 models that have been analysed in this research using ANSYS application, which consists of 2 validation models and 19 research models which are decided by the variation of steel strength and the variation in the height of the composite column. To simplify the analysis enforcement, it is to be done classifying the model based on 3 variations of column model, which is given in Table 1. Encased composite column models are used with Wide Flange (WF) and Square Hollow Section (HS).Table 1. Detailing of RC column and encased compsoite column model for ANSYS numerical modelling
 |
| |
|
2.3. Concrete Model
Element types SOLID65 is used for concrete model, defined as eight nodes and isotropic material that has the ability to show concrete deflection, crack and collapse. SOLID65 element can work along with other materials, such as reinforced steel. Input data element types SOLID65, concrete compressive strength should be tested first, Modulus concrete elasticity, Poisson ratio for concrete used 0.20.
2.4. Steel Column Model
Element SOLID185 is selected for encased steel column model. This element is a 3D element defined with eight point with material properties orthotropic. Element has the ability for plasticity, crawl, bend, stiffness, stress, deflection and strain. The data for support model material uses linier isotropic by inputting elasticity modulus data and poison’s ratio.
2.5. Reinforcement Model
Steel reinforcement models use element LINK8 defined as 2 nodes material isotropic. The data for reinforcing steel material model uses non-linier element rate independent multi-linear isotropic hardening and von-Mises yield criterion and young modulus value, poisson ratio and stress-strain steel curve value according to reinforced concrete structure calculation procedures of SNI 03-2847-2013.
2.6. Support Model
SOLID45 is used for beam support models. This element is a 3D element defined with eight point with material properties orthotropic. Element has the ability for plasticity, crawl, bend, stiffness, stress, deflection and strain. The data for support model material uses linier isotropic by inputting elasticity modulus data and poison’s ratio.
2.7. Model Analysis by Mathematical Approach
Model analysis uses approach model by mathematical calculation result data of deflection-curvature-ductility, load- deformation from analyzed column model. | (1) |
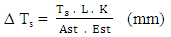
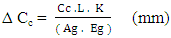
where: Pn(max) = axial load nominal capacity (kN); f’c = concrete compressive strength (MPa); fy = steel yield stress (MPa); Ast = steel area (mm2) Axial deformation, ΔTs = ΔCc, is obtained from the following calculation: | (2) |
 | (3) |
 | (4) |
 | (5) |
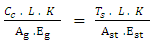
where: Cc = load capacity of concrete (kN); Ts = load capacity of steel (kN); Eg = equivalent elasticity modulus of composite (MPa); Est = elasticity modulus of steel (MPa).According to steel structure design calculation of Indonesia construction code (SNI-1729-2015), obtained the maximum load capacity  of composite column according to the following equations [11]:
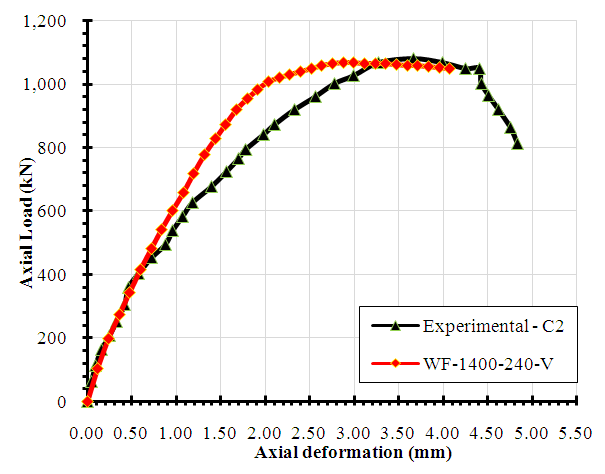
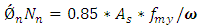 | (6) |
 | (7) |
where: As is steel section area (mm2); fmy is yield stress of composite (MPa); ω is buckling factor; K is effective length factor; L is column length (mm); rm is composite radius of gyration; and Em is equivalent modulus of elasticity (MPa).Axial deformation curvature, φΔ is obtained from the following equation: | (8) |
where: Δu = ultimate axial displacement (mm); Δy = axial discpalcement under yield condition (mm).
3. Discussion
3.1. Validation and Verification of Past Research
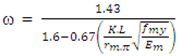
As for the experimental analysis result that has been held in the laboratory, will be validation reference for ANSYS modelling of the reinforced concrete column experimental research result and encased composite that has been done by previous researchers [10]. As the standard reference result process, validation analysis process that can be accepted is in graphical load (kN) against axial deformation (mm). The graphic is to determine the exact coordinate, which can be seen in the following Figure 1 and 2.The axial deformation value of the experimental results of Model C1 dan C2 are 2.84 mm and 4.70 mm compared to the results obtained by the ANSYS Application of 3.11 mm and 4.20 mm with a difference of 9.5%. Whereas for the ultimate axial load value of the experimental results in the laboratory obtained 809 kN and 1056.4 kN compared to the results obtained by ANSYS ultimate axial load of 852 kN and 1066.8 kN with a difference of 5.3% and 1.0%.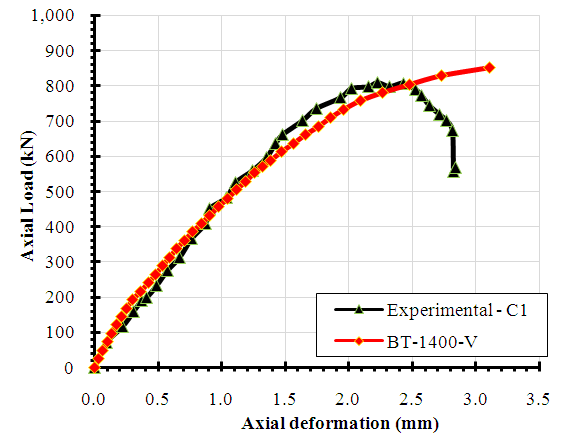 | Figure 1. Curve of Axial Loads (kN) vs. Axial Deformation (mm) results of ANSYS and Experimental C1 [9] |
 | Figure 2. Curve of axial loads (kN) vs axial deformation (mm) results of ANSYS and Experimental C2 [9] |
3.2. Load - deformation
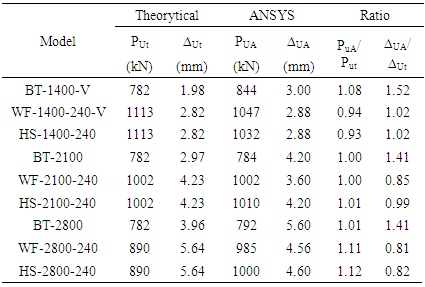
Validation of reinforcement concrete column model capacity with comparison of ANSYS modelling against simplified analytical approach, as depicted in Tabel 2 below. Developed models of confined column by encased composite column has been applied with WF and HS section to compare with RC column. Various height of column has been developed to determine the effect of load capacity against its column deformation. The ratio of load-displacement under theorytical approach and ANSYS modelling are also presented.Table 2. Ultimate axial load and deformation under theoritical vs ANSYS
 |
| |
|
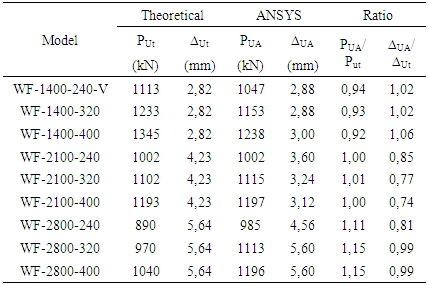
It can be seen that the ratio of theorytical against ANSYS model are reasonable, except for unstocky column, rather too conservative. The effect of confinement on WF encased composite column with various length and steel yield strength, obtained ultimate axial load and deformation, as shown in Table 3.Table 3. Ultimate axial load and deformation of WF encased column
 |
| |
|
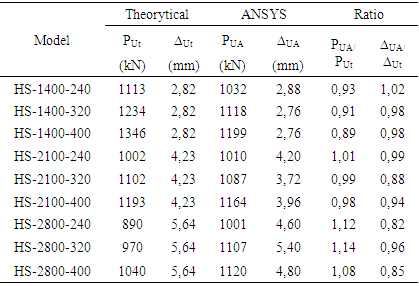
The effect of confinement on HS encased composite column with various length and steel yield strength, obtained ultimate axial load and deformation as shown in Table 4. Table 4. Ultimate axial load and deformation of HS encased column
 |
| |
|
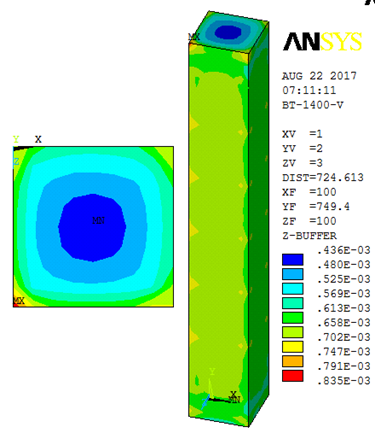
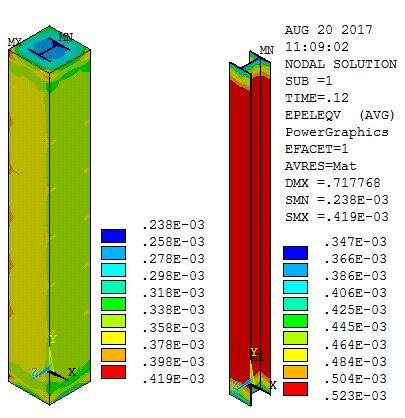
Stress and strain distribution contour of BT-1400-V, validation model, under yielding condition, as shown in Figure 3 and 4.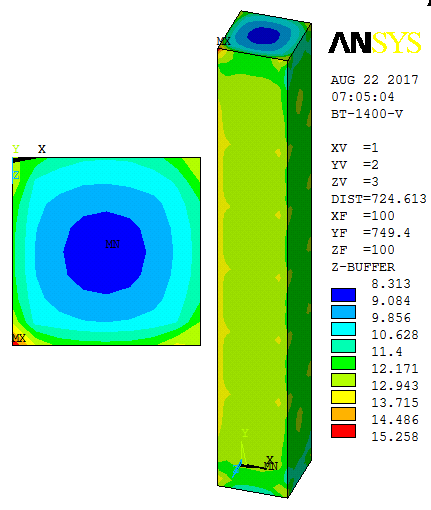 | Figure 3. Yielding stress contour of BT-1400-V |
 | Figure 4. Yielding strain contour of BT-1400-V |
Stress and strain distribution contour of BT-1400-V, validation model, under ultimate condition, as shown in Figure 5 and 6.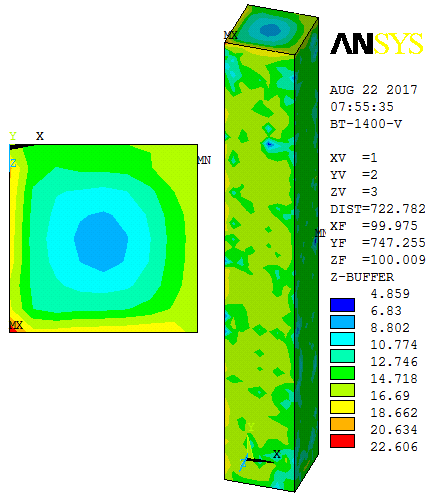 | Figure 5. Ultimate stress contour of BT-1400-V |
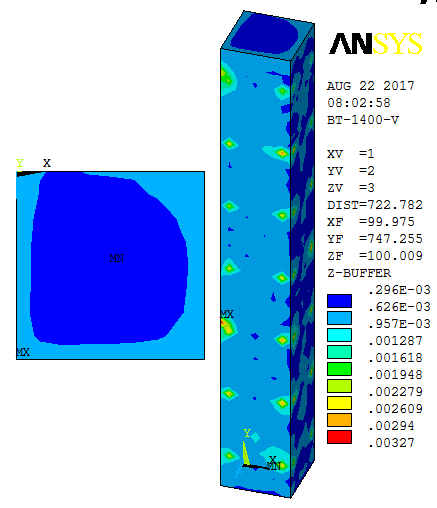 | Figure 6. Ultimate strain contour of BT-1400-V |
Yield stress of BT-1440-V has reached 15.258 MPa and 0.0835% yield strain occurs when load step 4 with axial load of 578.86 kN. When yielding stress condition and strain is evenly distributed in column cover that tend to be symmetrical in the upper side column, the ultimate stress is obtained of 22.606 MPa and ultimate strain of 0.327% with ultimate axial load of 844.28 kN. Stress and strain enters the core of the column that tend to be unsymmetrical evenly distributed from the top to the bottom, maximumly to the centre.Stress and strain distribution contour of WF-1400-V, validation model, under yielding condition, as shown in Figure 7 and 8. Whereas, stress and strain distribution contour of WF-1400-V, validation model under ultimate condition, as shown in Figure 9 and 10.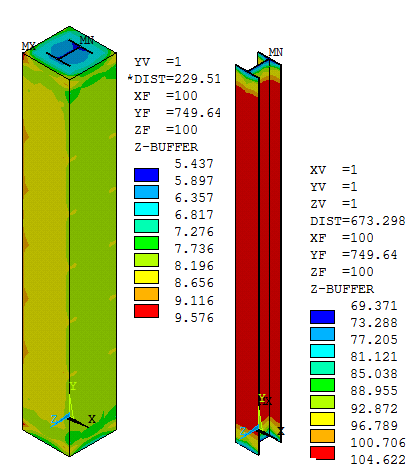 | Figure 7. Yielding stress contour of WF-1400-V |
 | Figure 8. Yielding strain contour of WF-1400-V |
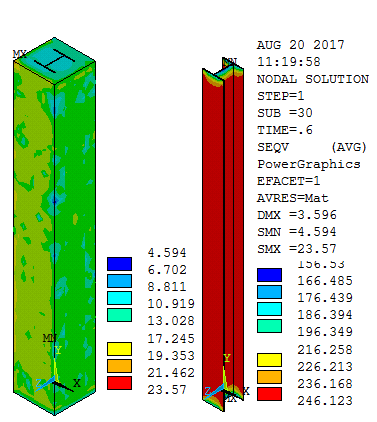 | Figure 9. Ultimate stress contour of WF-1400-V |
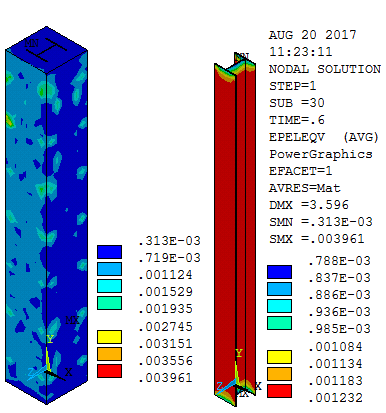 | Figure 10. Ultimate strain contour of WF-1400-V |
When concrete is yielding, the yield stress reaches 9.576 MPa, 104.622 MPa on the steel and 0.0419% concrete strain, 0.0523% steel strain occurs when load step 5 with axial load of 410.93 kN, stress and strain are evenly distributed in column cover that’s less concentrated to the upper side column, concentrated to WF profile steel in the column top and bottom edge. The stress when ultimate is 23.57 MPa, 246.123 MPa steel and concrete strain 0.3961%, 0.1232% steel with 1047.64 kN ultimate axial load. Stress and strain enters the core of the column that tend to be unsymmetrical evenly distributed from the top to the bottom, for WF profile steel maximumly in the column bottom and top edge.Crack pattern of BT-1400-V, WF-2100 and HS-2800, under condition of first crack and ultimate crack, as shown in the Figure 11.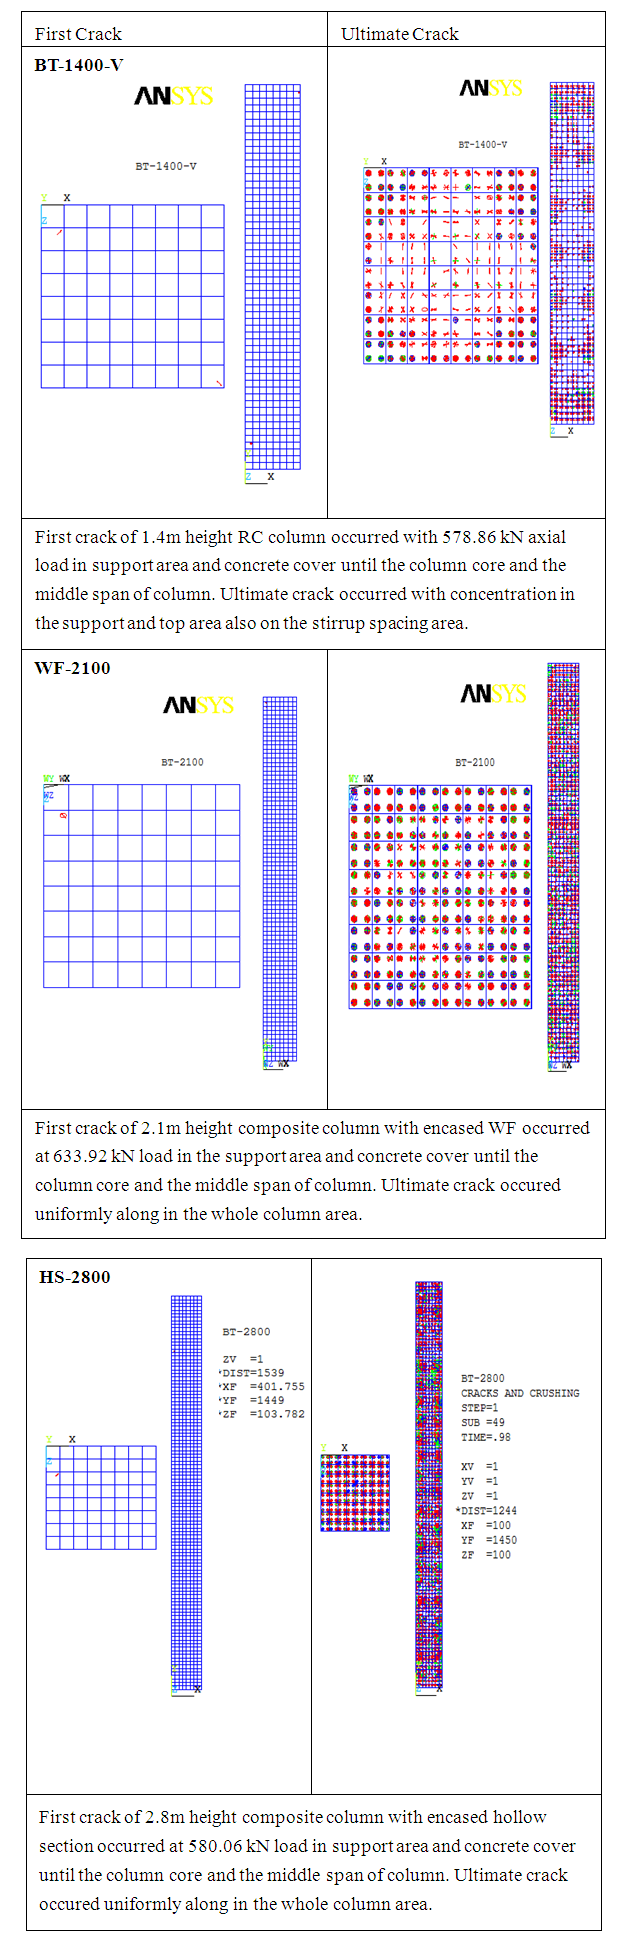 | Figure 11. Crack pattern of RC column |
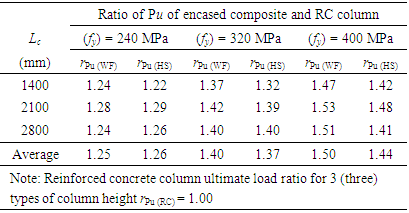
The bar diagram of ultimate load for all models; RC column, WF encased column, HS encased column, are depicted in Figure 12. The ratios of encased column ultimate load againt RC column ultimate load are presented in Table 5. The axial ductility of each models is graph presented, as shown in Figure 13.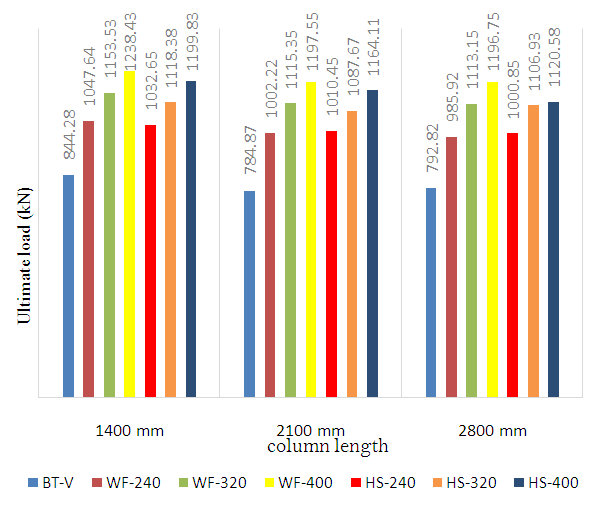 | Figure 12. The bar diagram of column ultimate load for all models |
Table 5. Ratio of ultimate load of encased composite vs its RC column
 |
| |
|
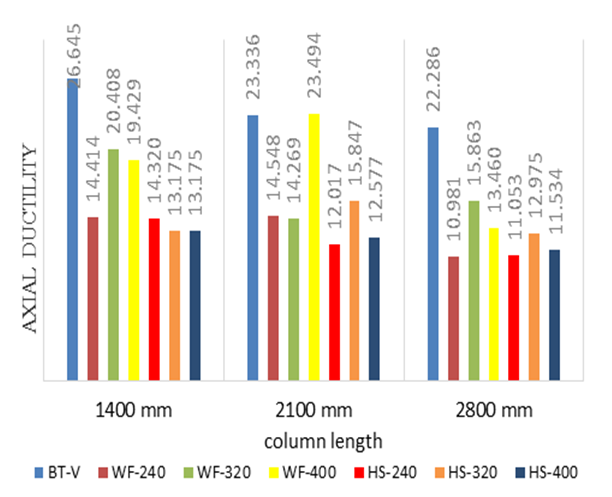 | Figure 13. The bar diagram of column axial ductility for all models |
4. Conclusions
Based on model analysis using analytical calculation and ANSYS Finite Element Analysis (FEA) method of reinforced concrete column model and encased composite column using WF steel and HS steel, it can be concluded as follows: 1. For encased composite column, with the increment of WF and HS steel strength will increase the ultimate load significantly.2. The effect of WF steel replaced by HS steel has not changed significantly towards the ability to resist the ultimate load.3. Stress-strain that occurs on first crack is distributed evenly in all column from support area to field area. However, when it reaches its ultimate condition, stress-strain pattern is concentrated on the support area.4. The first crack dominated occurred to the concrete cover layer and generally started in the support area, while the first crack occurred in the column core. With the increment of axial load, the crack starts to get bigger heading towards the column field area and entering column core layer. When it reaches ultimate axial load, most of the concrete material cracks, and even the crack can be seen in all the column area from support area to field area, also occurred to the concrete cover later and column core. Crack on the column core can be minimalized with encased composite column.5. With profile steel as the composite concrete column component resulting axial ductility value which is smaller compared to the reinforced concrete column. The bigger the column then the axial ductility on the composite concrete column and reinforced concrete column gets lower due to over reinforced collapse mechanism.6. For enhancing the load resistance, mild carbon steel hollow section applied for encased composite column, but for higher strength of encased steel by using wide flange section.7. Encased composite column modeling provides design engineers with a more flexible and intuitive option for designing structures, that are heavily influenced by steel-concrete ratio. It is advisable to determine optimized ultimate load capacity by considering the strength and volumetric of steel-concrete.
ACKNOWLEDGMENTS
The financial and academic supports of the research grant from Lambung Mangkurat University is gratefully appreciated.
References
| [1] | Soebur Rahman Md, Mahbuba Begum dan Raquib Ahsan, Behavior and Strength of Fully Encased Composite Columns, HCSD-2015, Department of Civil Engineering, DUET-Gazipur, Bangladesh. |
| [2] | Al-Maqassary A. Design Analysis of Steel-Concrete Composite Column with Load And Resistance Factor Design Method, Jp Teknik Sipil dd 2013. |
| [3] | Tjitradi, Darmansyah et.al., 3D ANSYS Numerical Modeling of Reinforced Concrete Beam Behavior under Different Collapsed Mechanisms International Journal of Mechanics and Applications 2017, Vol. 7(1): pp. 14-23 DOI: 10.5923/j.mechanics.20170701.02. |
| [4] | Taufik, Syahril et.al., Behavior of Filled and Encased Composite Column Using 3D Numerical Modelling ANSYS. International Journal of Composite Materials 2018, Vol. 8(1): pp. 18-23 DOI: 10.5923/j.cmaterials. 20180801.03. |
| [5] | Parmo, 2014. Strength and ductility of rectangular stocky RC column deformation under cyclic load, Journal of Engineering Sciences Vol.10. No.2. |
| [6] | Park, R. 1988. State of the Art Report Ductility Evaluation from Laboratory and Analytical Testing, Proceeding of 9th World Conference on Earthquake Engineering, August 2-9, Tokyo-Kyoto, Japan. |
| [7] | Stolarki, T., Nakasone, Y. dan Yoshimoto, S. 2006. Engineering Analysis with ANSYS Software. Elsevier Butterworth. |
| [8] | Park, T. dan Priestle. 1993. Theoretical Stress-Strein Model for Confined Concrete, Journal Structural Engineering-ASCE Vol.114. No.8 pp.180425. |
| [9] | Sagar Patil dan Suresh Parekar, Review Paper of Analysis of Encased Composite Column Under Various Loading Conditions, International Journal for Research in Mechanical & Civil Engineering, ME Structures, AISSMS COE, Pune University, 2016. |
| [10] | Soliman K.Z, Arafa A.I, dan Tamer M. Elrakib, 2012, Review of design codes of concrete encased steel short columns under axial compression, HBRC Journal (2012) No. 9, pp 134-143, Housing and Building National Research Center, September 2012. |
| [11] | Indonesia Standard Code Committe - ISCC (2015). Indonesia Normalized Standard for Steel Construction Code SNI-1729-2015, Civil Works Publisher. |

 Abstract
 Reference
 Full-Text PDF
 Full-text HTML