Agus Sugianto1, Syahril Taufik2
1Department of Civil Engineering, Balikpapan University, Balikpapan, Indonesia
2Department of Civil Engineering, Lambung Mangkurat University, Banjarmasin, Indonesia
Correspondence to: Syahril Taufik, Department of Civil Engineering, Lambung Mangkurat University, Banjarmasin, Indonesia.
| Email: |  |
Copyright © 2019 The Author(s). Published by Scientific & Academic Publishing.
This work is licensed under the Creative Commons Attribution International License (CC BY).
http://creativecommons.org/licenses/by/4.0/

Abstract
Strut-and-tie models (STMs), model fighters and binder are derived from the truss analogy models. STMs are often used to analyze and model a reinforced concrete deep beam structure for internal force distribution from the point load to the supports that carries bending, shearing and torque forces in disturbed regions (D-regions). D-region analysis on structural elements can be more easily done where the stress situation occurs idealized as the strut of the concrete, the tie of steel and the nodal area, the action of the strut and tie causes an increase in the strength of the high-reinforced concrete beam structure. Numerical modelling was conducted on the deep beam by compressive loading simulation until its collapse. ANSYS 3D half-span symmetrical Strut-and Tie model deep beams modeling have been done to determine deflection, cracking and destruction of ultimate load, model variation of two diagonal reinforcements, diagonal symmetrical truss reinforcement and diagonal frame truss reinforcement. The variation shape of STMs have been conducted to determine the ultimate bending capacity, load-deformation, ductility, stress behavior, strain, and fracture pattern. The result of numerical modelling shows the signifanct variation of STMs deep beam behaviour.
Keywords:
ANSYS, Strut-and-tie model, Inclination angle, Deep beam, Crack pattern, Ductility
Cite this paper: Agus Sugianto, Syahril Taufik, Numerical Modelling Behaviour of Reinforced Concrete Deep Beam with Strut-and-Tie Model, International Journal of Mechanics and Applications, Vol. 9 No. 1, 2019, pp. 1-9. doi: 10.5923/j.mechanics.20190901.01.
1. Introduction
Strut-and-tie model (STMs) are often used for internal force distribution from the point load to the supports. The basic principal of this model is based on simple ease model with emphasizing load distribution and can be applied to building, bridge, and other structures. STMs is suitable to analyze reinforced concrete structure model that bears bending force, shearing force and torque. The foundation of the method was laid by Ritter in 1899 and was later developed by Morsch in 1902. The detailing of structural concrete using strut and tie models have been introduced [1]. Proposed strut-and-tie model based on the softened STMs, for determining the shear strength of discontinuity regions failing in diagonal compressions are well determined. Minimum transverse reinforcement for bottle – shaped strut has been determined with effective shear strength [2]. Efficiency factor models are evaluated of used in Strut-and-Tie model of non-flexural members on the terms of crack patterns in diagonal compression region [3]. Shear strength prediction for deep bbeam is affected the failure of deep beams by the diagonal strut failure with the effect of beam depth, ties reinforcement and shear reinforcement configuration [4].A different STMs that proposed method employs constitutive laws for cracked reinforced concrete, considers strain compatibility is well proposed [5]. The other new proposed method based on STMs to determine the shear capacity of simply supported RC deep beams and an efficiency factor for concrete has been determined with considered effect of web reinforcements [6]. There are many methods for modeling the behavior of concrete structures through analytical and numerical approaches with three dimensional non-linear models. Shear strength model and design formula of reinforced concrete deep beams has been weel determined by the effect of strut and tie models [7]. Estimation of the localized compressive failure zone of concrete by AE method is well determined for modelling of RC failure zone behaviour [8]. Shear strength of reinforced concrete beams under uniformly distributed loads in accordance with the strength design method is well determined with the approach method of reinforcement detailing [9-11]. Experimental study of reinforced concrete deep beam under development approach of strut-and-tie model has been conducted. Different models of deep beam results in specified characteristic of structural behaviour with the ultimate bending capacity, load-deformation, ductility, shear capacity, and fracture pattern. Effects of strut-and-tie enhances the capacity and shear resistance significantly [12].Finite Element Method (FEA) is one of the numerical methods that are widely applied in concrete structures based on nonlinear behavior of materials, to simulate and predict the behavior of reinforced concrete elements, such as ANSYS Three dimensional ANSYS numerical modeling of reinforced concrete beam behavior under different collapsed mechanisms has been proposed with the variation of crack pattern and stress concentration [13].Strut-and-tie modeling are heavily influenced by shear, as 3D truss modelling of RC deep beam with varied diagonal reinforcement is more applicable. Numerical modelling is conducted on the RC deep beam by compressive loading simulation until its collapse. ANSYS 3D half-span symmetrical Strut-and Tie model deep beams modelling have been done to determine deflection, cracking, stress contour and destruction of ultimate load, model variation of two diagonal reinforcements, diagonal symmetrical truss reinforcement and diagonal frame truss reinforcement.
2. Methodology
2.1. System Approach
This research is conducted by doing 3D numerical modelling of RC deep beam modelling using finite element analysis. The tip displacement control is applied to the model instead of load step. The analysis will result nodal forces, displacement, elements forces and moments, deflection, and stress contour diagram. Beside that, it will also result a crack pattern to predict the ability of the deep beam when encountering ultimate centered load and the behavior of Strut-and-Tie model usage on the deep beam crack with beam normal concrete model variation.
2.2. Model Design
Deep beam model design was made in 3D using computed ANSYS in accordance to the real dimension. This model is expected to have the ability to show deflection, crack and collapse caused by the behavior of STMs usage on ultimate load and beam load variation. RC deep beam models can be depicted on the Figure 1.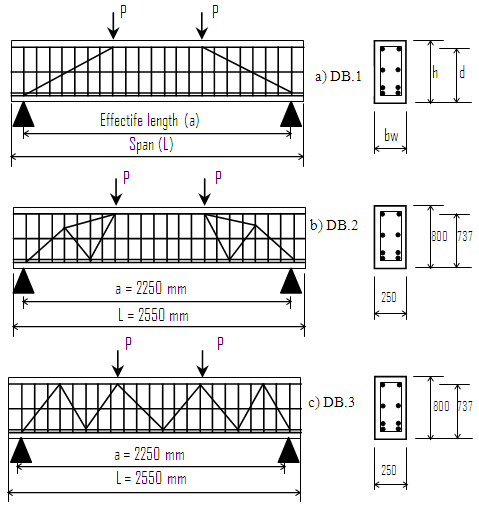 | Figure 1. Strut-and-Tie Model – RC Deep Beam a) Type 1 : Simple diagonal bar, DB.1, b) Type 2 : Symmetrical diagonal truss, DB.2, c) Type 3 : Diagonal space truss, DB.3 |
2.3. Concrete Model
Concrete model using element types SOLID65, is defined to eight nodes and are isotropic material that has the ability to show concrete deflection, crack and collapse. Element SOLID65 can work along with other materials, such as reinforced steel. Input data element types SOLID65, concrete compressive strength should be tested first, Modulus concrete elasticity, Poisson ratio for concrete used 0.20. Stress contour and crack pattern of concrete model can be obtained in 3D form to determine the deformation and collapse behaviour.
2.4. Concrete Strength
The value of stress-strain is set on multi-linier kinematic hardening plasticity. The behaviour of elastic isotropic occurs before concrete first crack or in the position about to collapse. Collapse parameter on concrete surface in ANSYS is modeled by non-linier non metal plasticity concrete material model, Stress-strain curve for normal concrete using reinforced steel structure calculation procedures of Indonesia Steel Code for buildings [14].
2.5. Steel Reinforcement Model
Steel reinforcement model using element type LINK8 is defined as 2 nodes material isotropic. The data for reinforcing steel material model uses non-linier element rate independent multi-linear isotropic hardening and von-Mises yield criterion and Young’s modulus value, poisson ratio and stress-strain steel curve value.
2.6. Support Model
Beam support and loading plate is modelled using SOLID45. This element is a 3D element defined with eight point with material properties orthotropic. Element has the ability for plasticity, crawl, bend, stiffness, stress, deflection and strain. The material data uses linier isotropic by inputting elasticity modulus data and poison’s ratio.
2.7. Model Analysis Using Mathematical Approach
Model analysis using approach model by mathematical calculation will result data of moment-curvature-ductility, load- deformation from analyzed beam model. The equations for calculating the specified parameters of conventional beam are as follows: | (1) |
 | (2) |
 | (3) |
𝑗𝑑 = 0.2(𝑙 + 2ℎ) for 1≤ l/h < 2 and 𝑗𝑑 = 0.6 𝑙 for l/h < 1where: 𝑀𝑛 = nominal moment (kN.m); 𝐴𝑠 = reinforcement area (mm2); 𝑓𝑦 = steel yield stress (MPa); Mu = ultimate moment (kN.m); 𝑓’𝑐 = concrete strength (MPa); jd = arm of moment (mm); b = beam width (mm); d = effective beam depth (mm); bw = effective beam width (mm); l = beam length (mm); ln = effective beam length (mm)  | (4) |
 | (5) |
 | (6) |
where: Vu = ultimate design shear (kN); ∅ = reduction factor (0.85); Vc = nominal shear resistance (kN) The equations for calculating the specified parameters of strut-and-tie model, as follows: | (7) |
 | (8) |
 | (9) |
 | (10) |
 | (11) |
where: Fnt = tie nominal strength (kN); Fnn = anchorage tie nominal strength (kN); Ast = area of tie reinforcement (mm2); wt = βn = 1.0 or 0.8; wt = effective tie width (mm); we = effective width (mm); Mnt = nominal moment of tie (mm2)  | (12) |
where: μM = ductility of moment curvature; φu = ultimate moment curvature; φy = yield moment curvature
3. Discussion
3.1. Validation and Verification of Past Research
Validation and verification of this research and past researches are aimed for comparison and to see whether research using ANSYS program modeling is suitable and close to the laboratory test, which Strut-and-Tie model was experimentally tested [12]. This research refers to ACI 318 M-2002 [10] also Indonesia concrete code SNI 03-2847 [11] by modeling as shown in Figure 2.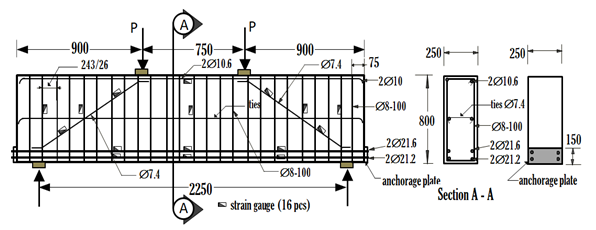 | Figure 2. RC Deep Beam - Type 1 |
RC deep beam with STMs in ANSYS modelling under meshed element has been developed under half span symmetrical beam, symmetrical boundary condition (CBC), as depicted in Figure 3. Fined meshed is applied to the shear concentration region to show detailed behaviour of cracking and collapse mechanism.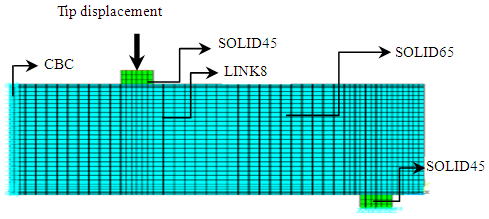 | Figure 3. ANSYS Beam model |
3.2. Moment Curvature
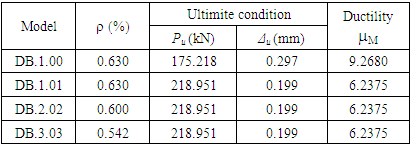
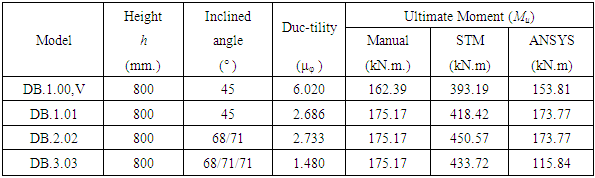
Moment and curvature calculation that occurs on beam model using modified stress-strain block for confined condition normal concrete on many other conditions, which are initial crack condition and ultimate condition. The calculation of curvature ductility, ultimate moment, load and shear by Kent and Park method as depicted in Table 2.From Table 1. DB.1.01 beam model; ultimate moment value towards strut-and-tie model variation, value consecutively increase. Curvature ductility value also increase as the increment of deep beam. For 800 mm depth beam, optimum curvature ductility is 6.237 on model type 2, which is DB.2.02 with Mu = 450.5688 kN.m.Table 1. Ultimate load, reinforcing ratio and beam curvature ductility on ultimate half-span overview condition
 |
| |
|
Table 2. Manual calculation result of ultimate moment, load, and shear
 |
| |
|
3.3. Deformation-Load Beam Model
From ultimate bending moment value obtained, the maximum load and vertical deformation occurred on the mid span beam model, as depicted in Table 1. DB.1.01 model; DB.2.02; DB.3.03; reinforcing ratio value on deep beam of 0.0063, value consecutively decrement on reinforcement ratio of 1.000; 0.952; 0.904 for 800 mm depth deep beam, curvature ductility value of 6.2375.
3.4. Model Analysis Using ANSYS
The beam model that is to be analyzed by element model using computed program ANSYS, on Figure 4.a,b,c, Figure 5.a,b,c and Figure 6.a,b,c. is longitudinal cross section at half span and perspective 3D view with meshing volumes.On Figure 4.a it is shown longitudinal section and perspective cross section and 3D view of reinforcement with meshing volumes, Figure 4.b it is shown beam longitudinal section which figures the reinforcing view, Figure 4.c is shown beam perspective that figures the reinforcing view in detail including diagonal strut-and-tie reinforcement. Longitudinal ties are applied at middle height to enhance beam stability and diagonal ties are applied to cover shear strength.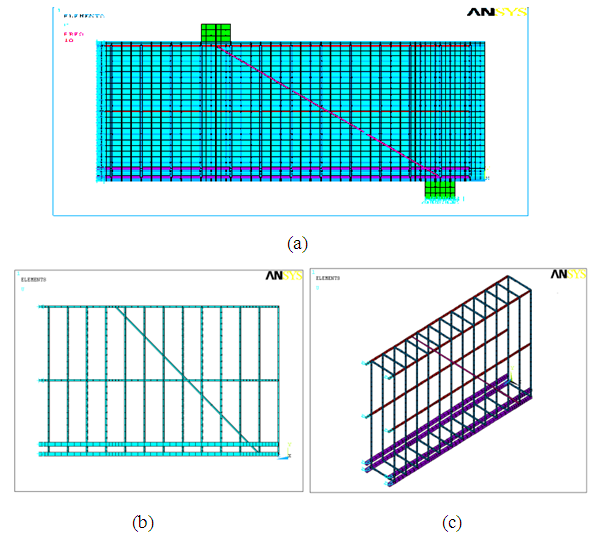 | Figure 4. Longitudinal section and 3D view of DB.1.01, with meshing |
On Figure 5.a is shown beam longitudinal section and reinforcement in 3D view with meshing volume. Figure 5.b is shown beam longitudinal section which figures the reinforcing detailing. Figure 5.c is shown beam perspective cross section that figures the reinforcing view in detail. Longitudinal ties are applied at middle height to enhance beam stability and double diagonal ties are applied to cover shear strength.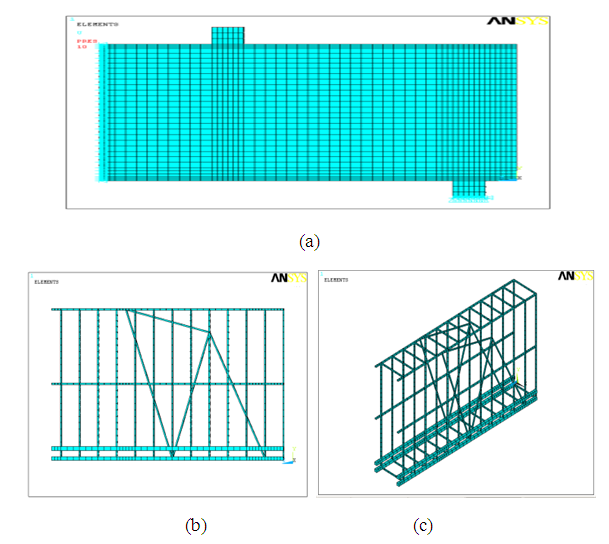 | Figure 5. Longitudinal section and 3D view of DB.2.02, with meshing |
Figure 6a is shown beam a half span longitudinal section with meshing volume. Figure 6.b is shown beam longitudinal section which figures the reinforcing spot. While, Figure 6.c is shown beam longitudinal section that figures the reinforcing 3D view in detail. Longitudinal ties are applied at middle height to enhance beam stability and double diagonal truss ties are applied to cover problem and enhance shear strength.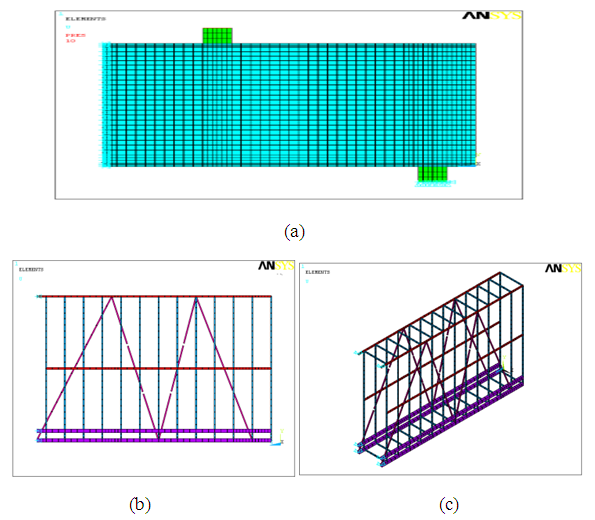 | Figure 6. Longitudinal section and 3D view of DB.3.03, with meshing |
3.5. Moment-Curvature Beam Model
The value of moment and curvature occurred to beam model based on analysis result is presented, as shown in Table 3. The curvature ductility is depicted in Table 4. Table 3. Moment and curvature on first crack, yiled and ultimate - ANSYS
 |
| |
|
Table 4. Ultimate moment and curvature ductility - ANSYS
 |
| |
|
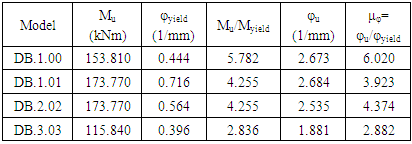
From Table 4 above, it is shown that beam model DB.1.01, validation, first crack occurred at 3.750 kN.m with crack curvature 0.062 1/mm, while second crack occurred at 26.600 kN.m with crack curvature 0,444 1/mm. third crack occurred on 153.810 kN.m with crack curvature 2.6731/mm.On beam model DB.2.02, first crack occurred on 3.750 kN.m with crack curvature 0.064 1/mm Second crack occurred on 40.8400 kN.m with crack curvature 0.0579 1/mm. third crack occurred on 173.770 kN.m with crack curvature 2.535 1/mm.From Table 5 above, it is shown that beam model DB.1.00 validation, ultimate moment occurred on third crack of 153.801 kNm with ultimate moment divided by yield moment as 5.782, with ultimate curvature φu of 2.673 1/mm. Ultimate curvature divided yield curvature 6.020 1/mm. ductility curvature 6.020.On beam model DB.1.01, ultimate moment occurred on third crack 173.770 kNm with ultimate moment divided by yield moment 4.255, with ultimate curvature 2.644 1/mm. Ultimate curvature divided yield curvature 3.923 1/mm. ductility curvature 3.924.On beam model DB.2.02, ultimate moment occurred on third crack 173.770 kNm with ultimate moment divided by yield moment 4.255, with ultimate curvature 2.535 1/mm. Ultimate curvature divided yield curvature 4.374 1/mm. ductility curvature 4.375.On beam model DB.3.03, ultimate moment occurred on third crack 115.840 kNm with ultimate moment divided by melt moment 2.836 with ultimate curvature 1.881 1/mm. Ultimate curvature divided melt curvature 2.882 1/mm. ductility curvature 2.881.Based on to curvature ductility terms, that is for gravity load μ ≥ 4 and earthquake load μ ≥ (13 to 16). Beam model DB.1.00, validation and DB.2.02 meets the characteristics of gravity load, model DB.1.01, DB.3.03, does not meet the characteristics. As for the seismic load, the entire model does not meet the characteristics, therefore, all given models are not suitable as RC beam under seismic load.In Figure 7, the moment and curvature value of the beam model on model DB.1.01, validation analysis; DB.1.01, validation ANSYS DB.1.01, validation with strut-and-tie; moment value against height of beam, have respective ratios of 1.000; 1.132; 1.404 of 137.758 ;153.810; 165.310 kN.m.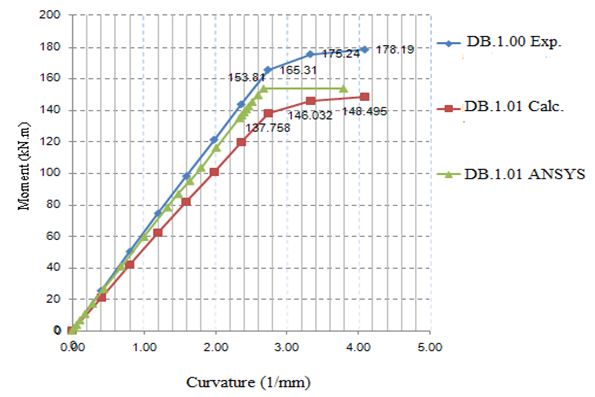 | Figure 7. Moment - Curvature Curve; DB.1.00,v, DB.1.01, calculation, and DB.1.01 ANSYS |
In Figure 8, the moment and curvature value of model DB.1.01, DB.2.02, and DB.3.03 moment value against height of beam, have respective ratios of 1.000; 1.000; 0.660 of 173.77; 173.77; 115.84 kN.m. to model DB.1.01.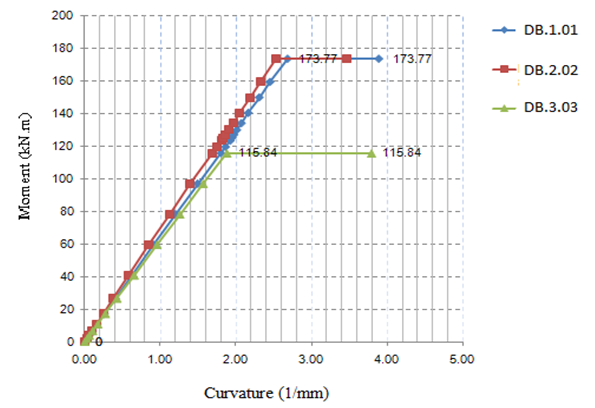 | Figure 8. Moment - Curvature Curve; Beam DB.1.01, DB.2.02, and DB.3.03 using strut-and-tie model, ANSYS analysis |
The analysis above results in a proposed formula to determine the amount of curvature ductility for the model. The regression curve equation for a quadratic polynomial curve fitting for stress value to the DB.02 model is: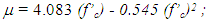 where: R2 = 0,985 with the value from polynomial function; f’c = concrete compressive strength (MPa); μ is the curvature value and R is the regression value (nearly 1).
3.6. Load-Deformation Beam
The vertical deformation due to point load occurred on beam model analysis result using ANSYS under yield stress, as shown in Figure 9.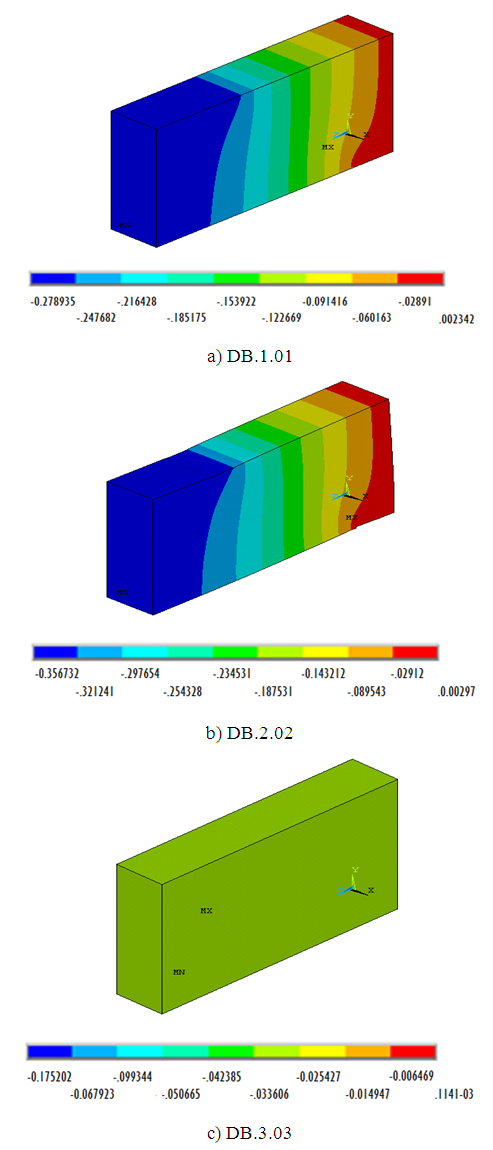 | Figure 9. Deformation contour of DB.1.01, DB.2.02, and DB.3.03 |
Figure 9. presents deformation contour on beam model DB.1.01, DB.2.02 and DB.3.03 with concentrated stress deformation occurred on support under pressure load of 10 kN/mm2. Dark blue colour shows the stress occurring, the more it goes near red colour as the stress increase until maximum stress. The amount of load and deformation occurred is presented on the following curve as depicted in Figure 10.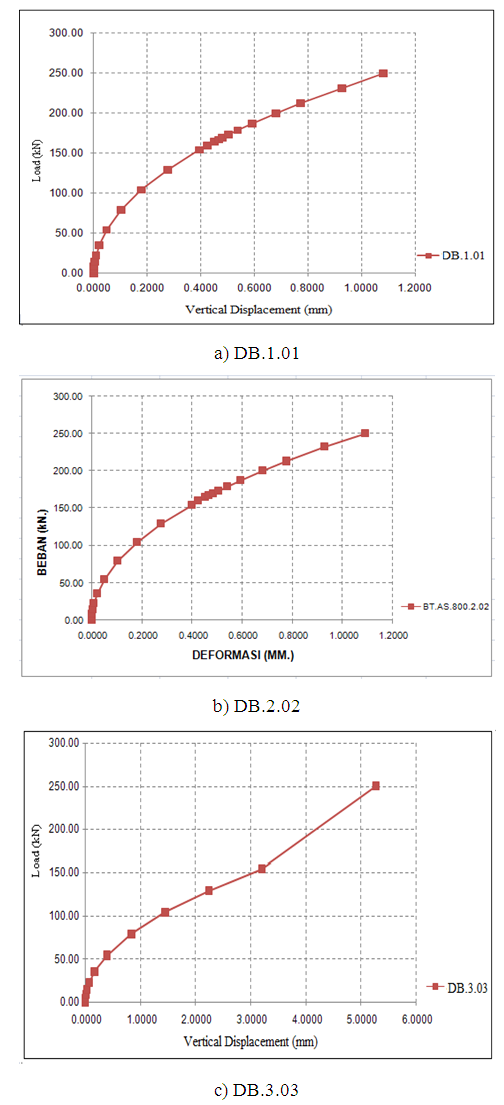 | Figure 10. Load vs vertical displacement ANSYS models |
Figure 10.a is a curve of moment and deformation relation occurred on beam model DB.1.01 load and deformation value for model DB.1.01, Pu = 231.69 kN; deformation = 0.9256 mm. Figure 9.b is a curve of moment and deformation relation occurred on beam model DB.2.02 load and deformation value for model DB.2.02, Pu = 231.69 kN; deformation = 0.9288 mm. Figure 9.c is a curve of moment and deformation relation occurred on beam model DB.3.03 load and deformation value for model DB.3.03, Pu =154.45 kN; vertical displacement = 3.2032 mm.
3.7. Stress and Crack Pattern
Stress pattern on ANSYS beam model analysis result due to the applied load occurred, as shown in Figure 10.In Figure 11 presents the von Misses stress contour of beam model DB.1.01, DB.2.02 and DB.3.03 whereas stress concentration occurred on support and loading plate block by ultimate compressive load of 10 kN. On beam model coloured dark blue shows the stress occurred at value of 0.001474 MPa, and the maximum stress of 15.096 MPa occured in the area of beam support due to shear stress concentration. | Figure 11. Stress pattern of deformed deep beam |
3.8. Crack Pattern
Crack pattern on beam model analysis result using ANSYS based on the load occurred, as shown in Figure 12.Figure 12. (a) all crack on beam model DB.1.01, stress concentration occurred on support and load divided block from pressure load of 10 kN. Seen dominant crack pattern occurred on half-span under beam neutral line. Figure 12 (b) all crack on beam model DB.2.02, stress concentration occurred on support and load divided block from pressure load of 10 kN, seen dominant crack pattern occurred on half-span under beam neutral line.Figure 12 (c) all crack on beam model DB.3.03 stress concentration occurred on support and load divided block from pressure load of 10 kN/mm2. 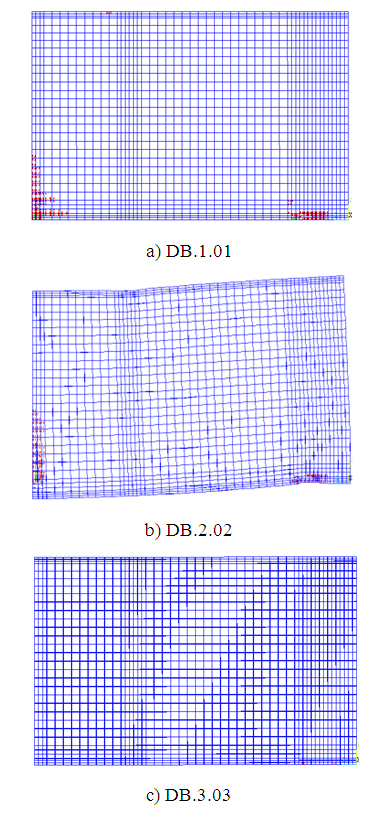 | Figure 12. Crack pattern on STMs deep beam |
3.9. Comparative Analytical Result vs ANSYS
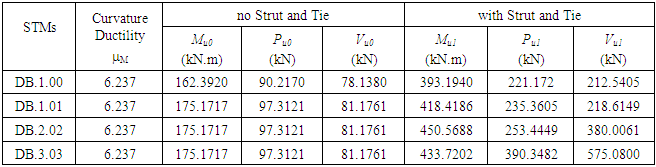
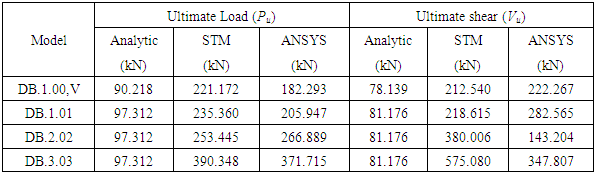
The increment of compressive concrete strength (f’c) will occur the increment value of ductility, moment capacity (Mu), ultimate load (Pu), shear capacity (Vu) on model with reinforcing strut-and-tie, according to manual calculation, STMs effect and ANSYS analysis, as shown on Table 5 and 6.Based on the result from Table 6 dan 7 shown, the resume are as follows:1. On each compressive concrete strength increment, will occur the increment of moment capacity value (Mu), ultimate point load (Pu), shear capacity (Vu) on reinforcing strut-and-tie model2. On ANSYS 800 mm depth beam model, diagonal strut angle 45°, between type 1 and 2 has the same value for ultimate moment, but for type 3 occurred ultimate moment decreased by 33.33% compared to type 1 and type 2. For the centered ultimate point load, occurred the increment on type 2 and 3 respectively 29.59% and 80.49% to type 1. As for the shear load, occurred the decrement on type 2 by 49.31% to type 1 but occurred increment on type 3 by 23.09% to type 1.Table 5. Table of recapitulation calculation result of ductility and ultimate moment capacity (Mu)
 |
| |
|
Table 6. Ultimate load capacity (Pu), ultimate shear capacity (Vu) by analytical and ANSYS analysis
 |
| |
|
4. Conclusions
Based on 3D ANSYS numerical modelling analysis, the conclusions are:1. Beam with 800 mm depth, diagonal strut angle 45°, type 1 and 2 does not increase ultimate moment (Mu), as on type occurred decrement value on ultimate moment by 33.33% to type 1 and 2. Ultimate centered load (Pu) occurred increment on type 2 and 3 by respectively 29.59% and 80.49% to type 1. Ultimate shear (Vu) occurred decrement on type 2 by 49.31% to type 1, however occurred increment on type 3 by 23.09% to type 1.2. Beam with 800 mm depth, curvature ductility on model 2 increased by 11.49% to model 1, however on model 3 will decrease by 26.58% to model 1. Deformation that occurred on beam depth of 800 mm is around 0.928 mm up to 3.203 mm. Stress contour on all models show the behavior is aligned with strut diagonal and is formed bottle shape 3. Crack concentration occurred on support area and mid-span with beam depth of 800 mm. for diagonal strut angle < 68º Mu the optimum one is strut and tie beam type 2 (reinforcing symmetrycally diagonal), for ultimate point load, the optimum one is strut-and-tie beam of type 3, for ultimate shear the optimum one is strut-and-tie beam type 3 (diagonal space truss). 4. For diagonal strut angle > 68° the optimal Mu on strut-and-tie of reinforcing symmetrycally diagonal), for the optimum ultimate point load is strut-and-tie model beam type 1, for the optimum ultimate shear is strut-and-tie model of diagonal space truss.5. The comparison of curvature ductility value of strut-and-tie model on angle < 45° will decrease by 27.11%, curvature ductility value with angle > 45° will decrease by 55.67%, however for two angle model (68°/71°) will decrease by 58.62% and for three angle model (68°/71°/71°) and (68°/78°/78°) will decrease by 55.67%.6. It is recomended to apply deep beam with type 3 Strut-and-Tie diagonal struss, as the optimum load and ultimate shear achieved to cover the problem of shear crack collapsed mechanism around the loading plate and support due to high shear stress concentration.
ACKNOWLEDGEMENTS
The financial and academic supports of the research grant from Lambung Mangkurat University is gratefully appreciated.
References
| [1] | Schlaich, Jorg., Schafer, Kurt (1991), Design and Detailing of Structural Concrete Using Strut and Tie Models, The Structural Engineering. |
| [2] | Brown, M., and Bayrak, O. (2007), Minimum transverse reinforcement for bottle – shaped strut, ACI Structural Journal, Vol.103, No.6, 813-821. |
| [3] | Foster, S.J., and Malik, A.R., (2002), Evaluation of Efficiency Factor Models used in Strut-and-Tie Modeling of Non-flexural Members, ASCE Journal of Structural Engineering, Vol. 128, No. 5, 569-577. |
| [4] | Hwang, S., Lu, W., and Lee, H. (2000), Shear Strength Prediction for Deep Beams, ACI Structural Journal, Vol. 97, No. 3, 367-376. |
| [5] | Park, J.W. and Kuchma, D. (2007), “Strut-and-Tie Model Analysis for Strength Prediction of Deep Beams”, ACI Structural Journal, Vol.105, No. 6, 657-666. |
| [6] | Arabzadeh, A., Rahaie, A. R., Aghayari, R. (2009), “A Simple Strut-and-Tie Model for Prediction of Ultimate Shear Strength of RC Deep Beams”, International Journal of Civil Engineering, Vol. 7, No. 3, 141-153. |
| [7] | Russo, Gaetano., Raffaele Venir, and Margherita Pauletta. (2005), Reinforced Concrete Deep Beams Shear Strength Model and Design Formula. ACI Structural Journal, V.102, No.3, May-June 2005. |
| [8] | Watanabe, Ken., Mitsuyasu Iwanami, Hiroshi Yokota, and Junichiro Niwa, (2002), Estimation of The Localized Compressive Failure Zone of Concrete by AE Method. Proceeding of the 1st fib Congress, Osaka, Session 13, October 2002, pp.117-124. |
| [9] | Zararis, Prodomoros D., Ioannis P. Zararis. (2008), Shear Strength of Reinforced Concrete Beams under Uniformly Distributed Loads. ACI Structural Journal, November - Desember 2008. |
| [10] | American Concrete Institute (1997), ACI Design Handbook, Designed of Structural Reinforced Concrete Elements in Accordance with the Strength Design Method of ACI 318-95. |
| [11] | Indonesia Standard Code Committe - ISCC (2015), Indonesia Normalized Standard for Structural Concrete Construction Code SNI-2847-2015, Civil Works Publisher. |
| [12] | Hardjasaputra, Harianto and Wiryanto Dewobroto (2005), Experimental of Structural Reinforced Concrete Deep Beam for Strut-and-Tie Model Development. (http://sipil-uph.tripod.com/research.htm, accessed on 29 November 2018). |
| [13] | Darmansyah Tjitradi, Eliatun Eliatun and Syahril Taufik (2017), 3D ANSYS Numerical Modeling of Reinforced Concrete Beam Behavior under Different Collapsed Mechanisms, International Journal of Mechanics and Applications, Volume 7(1): pp. 14-23 DOI: 10.5923/j.mechanics.20170701.02. |
| [14] | Indonesia Standard Code Committe - ISCC (2015), Indonesia Normalized Standard for Structural Steel Construction Code SNI-1729-2015, Civil Works Publisher. |

 Abstract
 Reference
 Full-Text PDF
 Full-text HTML