R. Rhanim1, H. Rhanim2, A. Nassim1
1Laboratoire Instrumentation de Mesure et de Contrôle IMC, Physics Department, Chouaïb Doukkali University, d’EL Jadida, Maroc
2Laboratoire de Mécanique et Energétique LME, Physics Department, Chouaïb Doukkal University, d’EL Jadida, Maroc
Correspondence to: R. Rhanim, Laboratoire Instrumentation de Mesure et de Contrôle IMC, Physics Department, Chouaïb Doukkali University, d’EL Jadida, Maroc.
| Email: |  |
Copyright © 2016 Scientific & Academic Publishing. All Rights Reserved.
This work is licensed under the Creative Commons Attribution International License (CC BY).
http://creativecommons.org/licenses/by/4.0/

Abstract
The appearance of cracks in macrostructures creates heterogeneity which manifests itself by a change of the state of stress and strain in the structure. Subjected to stresses, the structures are the seat of a crack growth; this propagation follows a life cycle starting from the initiation phase to the phase where unstable fracture may occur at any moment. In order to understand the mechanism of structural damage by cracking, a study based on the evaluation of the stress distribution in artificially damaged structures is conducted and an assessment of the level of damage is defined by calculating the static damage. This work was also interested to the evaluation of the stress intensity factor theoretically and numerically by energy approach. In the light of the results obtained in this study we were able to assess the effect of the single and the double notch on the mechanical behavior of structures subjected to tension. We also pointed out the criticality of the simple notch compared to the double notch.
Keywords:
Crack, Life cycle, Damage, Energy approach, Traction, Stress intensity factor
Cite this paper: R. Rhanim, H. Rhanim, A. Nassim, Study of the Stress Intensity Factor in Artificially Damaged Structures, International Journal of Mechanics and Applications, Vol. 6 No. 4, 2016, pp. 63-70. doi: 10.5923/j.mechanics.20160604.01.
1. Introduction
A component is said damaged when a defect is primed. The defects are classified into two types, the volume defects and planar defects. These are often presented as a notch with different radius notch [1]. Generally, the presence of these notches or defects induces a perturbation in the structures. These disturbances are manifested by high stress concentrations in the vicinity of the notch front. Therefore the analysis of the stress distribution in the vicinities of defects is a key driver to understand the crack behavior and then to the mechanical behavior of the damaged structure.One knows that there are three failure modes that depend on the load type [2]:Mode I: the opening mode where displacements of the crack lips are perpendicular to the direction of propagation.Mode II: shear mode in the plane where the displacements of crack lips are parallel to the direction of propagation.Mode III: anti-plane shear mode, corresponds to a transverse sliding of crackSeveral researchers have presented methods for evaluation of stress intensity factors for different types of specimens. For many configurations a analytical and numerical methods was used [3-7].P. Livieri proposes a simplified procedure for the evaluation of the stress intensity factors of cracks by means of an equivalent hole. The procedure is performed to give an engineering response both for numerical or experimental investigations [8].In S. Reddy study, a combination of crack-stop hole and carbon fiber reinforced polymer (CFRP) overlays under static loads are studied numerically using finite element analysis [9]. Three-dimensional effects near crack front were subject of many analytical, numerical and experimental studies. Different experimental techniques for determining stress intensity factor fully rely on the measurements taken outside the region affected by the three-dimensional effects [10]. This study aims to present a practical method to calculate stress intensity factors using different theories of the mechanics of brittle fracture to determine the mode I brittle fracture risk.
2. Experiment
2.1. Study Models
To study the effect of defects on the mechanical behavior of structures, Two types of ABS specimen; simply notched beam and double notched beam were used. Tests on rectangular beams with sizes of notch from 3 to 32 mm were conducted. Then, a tensile testing was applied on three specimens for each notch size with speed 1 mm/min.
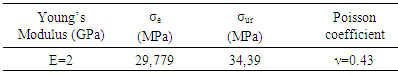
2.2. Mechanical Characteristics
For a good characterization of the studied material, the dumbbell shape specimen according to IEC6800-1-1 norms was used (Figure 3).The mechanical characteristics obtained are shown in the table below:Table 1. Mechanical characteristics of the studied material
 |
| |
|
2.3. Tensile Tests
Tensile tests were conducted on samples defined in Figures 1 and 2, in Public Studies and Trials laboratory (LPEE). The results of these static tests are shown in the figures below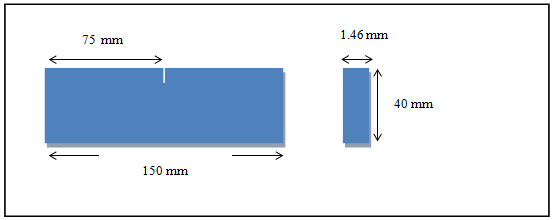 | Figure 1. ABS beam simply notched |
 | Figure 2. ABS beam doubly notched |
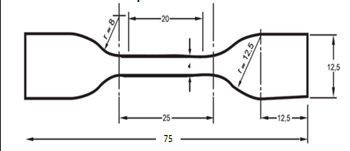 | Figure 3. Dumbbell specimen Dimensions |
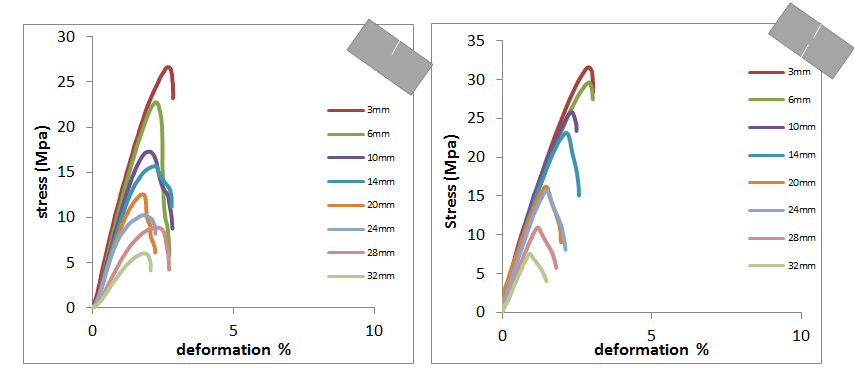 | Figure 4. Tensile curves of the applied stress according to deformation for beam simple and double notch |
3. Results and Analysis
3.1. Evaluation of the Damage in Simply and Doubly Notched Beam
3.1.1. Static Damage Calculation
The structure state is related to the damage degree. The latter is directly related to the physical properties hence the importance of adopting a model of the damage depending on the stress state in the studied structure. And therefore the expression of the static damage model formulated by [6]: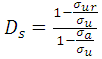 | (1) |
And the life fraction is defined as: | (2) |
With:a: crack length;w: beam width ;σur: residual ultimate stress;σu: ultimate stress of virgin material;σa: strain just before fracture.The figure 5 illustrates the behavior of the damage between the beam not damaged in its virgin state that corresponding to no damage and the totally damaged beam whose damage is egal to 1.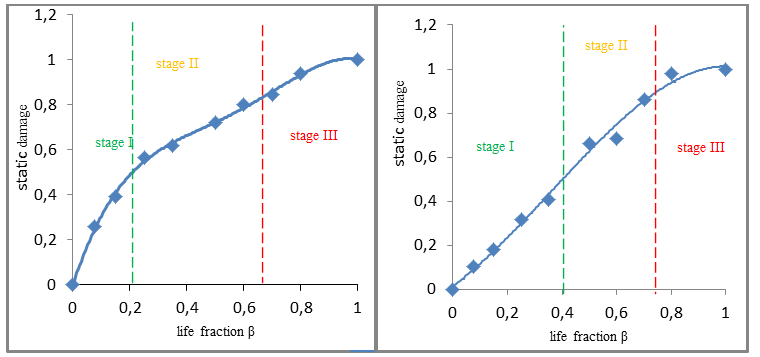 | Figure 5. Evolution of static damage depending on the life fraction for simple and double notch |
It is found from this result that the damage is even higher than the fraction of life is high and approaches to 1 indicating a total failure of the material or otherwise its break and this for two cases simple and double notch.It follows that the damage reflects the fragility of the material more so than increasing of damage level is associated with the degradation of the physical capacity of the material to break.
3.1.2. Reliability Study of Beam with Single and Double Notch
It is noted that the static reliability curves maintain the same pace for both types of default. At the beginning of the life cycle reliability is 100%, which corresponds to zero damage. Graduallyas the damage increases the reliability decreases.The intersection between reliability curve and damage curve informs us the initiation of life fraction that announces the start of the seed stage.
3.1.3. Comparative Study of Damage Level of Beam Simply and Doubly Notched
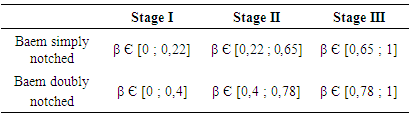
From the results shown in the figure above (fig.6) and collected in Table 2, one notes that:- The damage curve of beam simply notched is located above the doubly notched during the first two stages, that it reflect the speed evolution of damage level of simply notched compared to doubly notched. From the critical life fraction βc that announces the beginning of stage III the two curves merge, It is the unstable phase.The damage becomes uncontrollable; the specimen may at any time express a fatal rupture.- The initial life fraction is βi SENT=0,22 for beam simply notched while for beam doubly notched is βi DENT=0,4;- the stage I which represents the elastic damage area and that is the safe area where one can control the default; is reduced for simple notch , so the stage considered the most stable phase is the most important in the case of the double notch Table 2. Summary of different stages of damage of beam simply and doubly notched
 |
| |
|
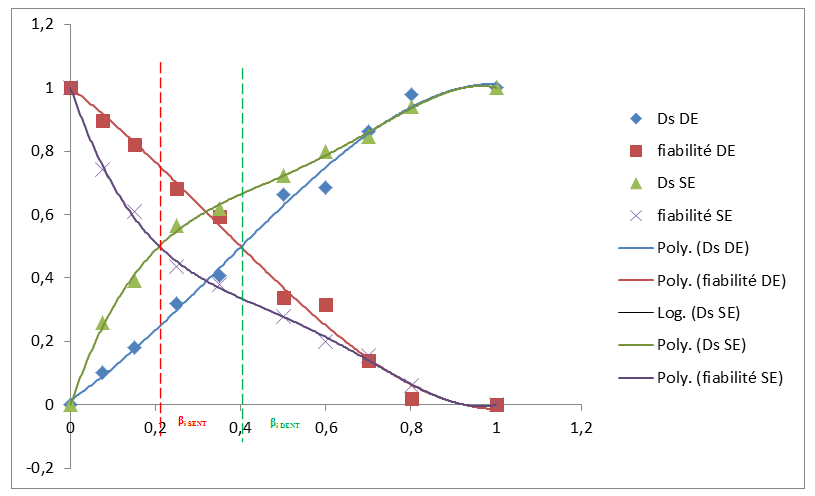 | Figure 6. Curves of static damage –Reliability of beam simply and doubly notched |
Facing these findings, one can say that the beam simply notched is most fragile and that the default which has the highest criticality is simple notch which it comes mainly to the stress distribution in test pieces where there is a high concentration of stresses at the simple notch whereas for the double notch this concentration is distributed. Therefore, and in our case the most tolerable defect is the double notch because it presents a more interesting life.
3.2. Calculation of the Stress Concentration Coefficient
Indeed, in the absence of defaults, the stress distribution is uniform in structures. The perturbation of the part geometry is at the origin of stress concentration phenomenon. To illustrate this problem we will expose the case of our studied beam with discontinuities in the form of single and double notch.To assess the density of this phenomenon, a theoretical calculation of the stress concentration factor for both cases was conducted:• Beam simply notchedFor tension case and for simple geometry having a default in the form of single notch the mathematical formula of the stress concentration factor is given by Peterson formula [7]: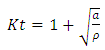 | (3) |
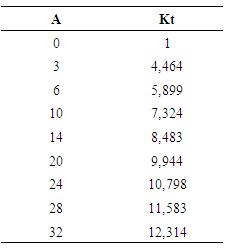
From equation (3) and every calculation made (Tab.3) it was possible to trace evolution curve of the stress concentration coefficient cf. fig.7:Table 3. Stress concentration factor value of beam simply notched
 |
| |
|
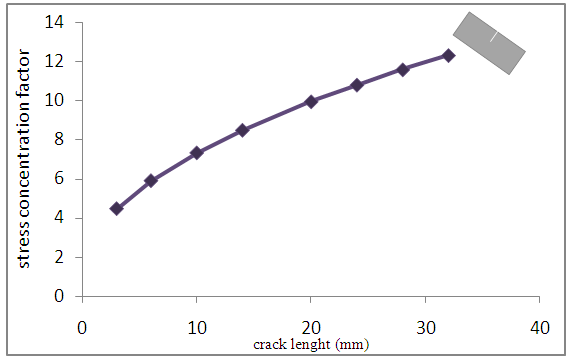 | Figure 7. Evolution of stress concentration factor of beam simply notched |
It is noted that the stress concentration factor progressively changed with size notch since it is a value of 4,4 of 3 mm crack size and increases up to 12 for 32 mm crack size. This stress concentration factor values reflect the stress concentration degree at the discontinuity and therefore assesses the degree of criticality of the simple notch.This allows to say that default « single notch » present a level of significant damage this justifies the results of damage study.• Beam doubly notchedFor double notched the theoretical formula of stress concentration factor according to Neuberse provides follows [8]: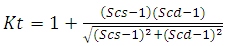 | (4) |
With: 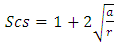 | (5) |
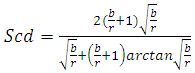 | (6) |
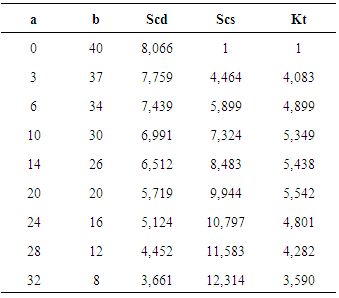
After all calculation made one find the results in the table below:Table 4. Stress concentration factor summary of double notch
 |
| |
|
It is noted that the evolution of the stress concentration factor increases with the crack size to a size of 24 mm where there is a decreasing of the curve Figure 8.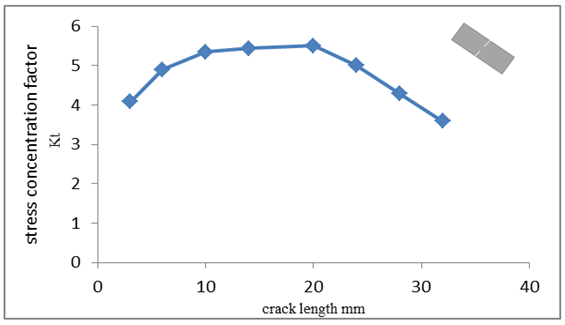 | Figure 8. Evolution curve of stress concentration factor of double notch |
This drop coincides with the unstable area of the damage where it can no longer control the structure behavior and therefore the formulas are no longer valid.Comparing stress concentration factor results of the both studied cases: the simple and double notch, it is clearly that the simple notch present important stress concentration factor which reflecting the existence of high stress concentration area at the simple notch which justifies its criticality degree relative to double notch.
3.3. Stress Intensity Factor
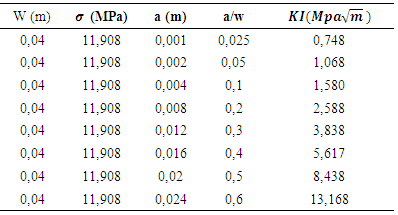
The stress intensity factor characterizes the structure state in the vicinity of the notch defining the intensity of the stress field at the tip of the notch. It depends on the stress distribution and the notch geometry. In this part the SIF simply notched and doubly notched structure was calculed using analytical formulas [9], [10].• Beam simply notchedThe stress intensity factor of beam simply notched is calculated with following formula: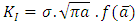 | (7) |
With:
 After all calculation made one find the following results:
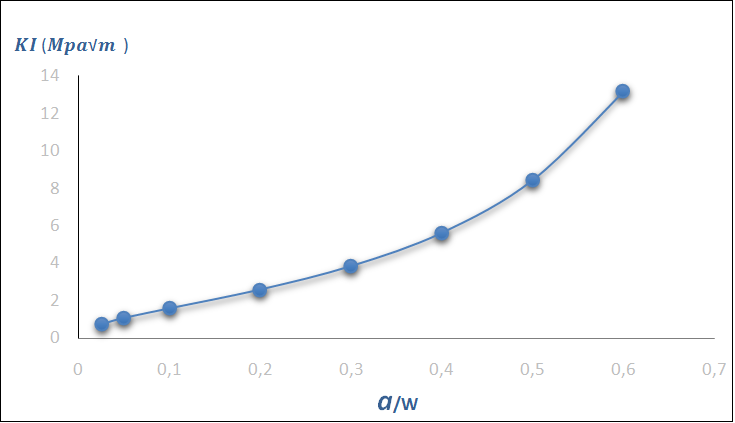 | Figure 9. Stress intensity factor evolution of beam simply notched |
The figure 9 above shows the evolution of the stress intensity factor in mode I according to crack size, it is observed that the stress intensity factor increases exponentially with the advancing of default, it marks a sharp increase when the life fraction exceeds 0.6, after this life fraction there is the damage unstable region, failure can occur at any time and consequently the formulas are no longer applicable in this area where high values of the SIF.To validate this theoretical calculation a numerical finite element of SIF by J-integral approach was used. The results are presented in graph figure 10.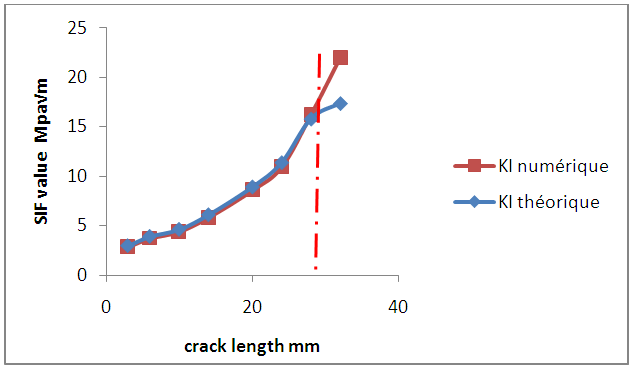 | Figure 10. Numerical and theoretical curves of the SIF |
It is clear that the curve that represents the numeric SIF develops exponentially with crack size and follows the theoretical curve to a crack size of 30 mm, which coincides with the unstable region of the damage.Table 5. SIF calculation of beam simply notched
 |
| |
|
• Beam doubly notched:The approach adopted in the calculation of the stress intensity factor at the beam having a double notch is given by the following expression: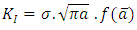 | (8) |
With:
 After all calculation made we find the results in table 6 below
Table 6. SIF calculation of beam doubly notched
 |
| |
|
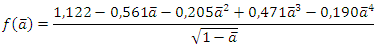
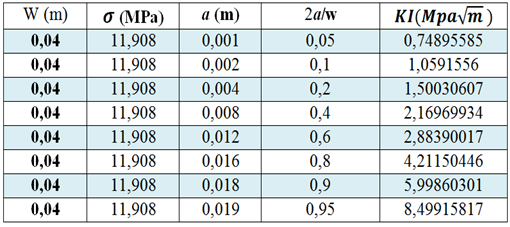
The figure 11 shows the SIF variation in mode I according life fraction, it is observed that the SIF increases exponentially and it becomes important when life fraction exceeds 0.8 which coincides with the unstable area where one cannot judgmental because the formulas are no longer applicable in this area and the values are no longer reliable. | Figure 11. Stress intensity factor evolution according to 2a/w |
From the results obtained by the two graphs of the stress intensity factor, one observes that it increases exponentially with notch size advancing.Is also noticed that the SIF of simple notched case is larger than double notch case this is mainly due to stress distribution where one have previously noted that greater stress concentration at the simple notch.
4. Conclusions
This manuscript provides a spotlight on the mechanical behavior in mode I artificially damaged structures by means of the simple and the double notch solicited by uniaxial tension.The study is presented in three parts; the first was devoted to the study of static damage of both cases studied. This work led to:v Distinguish three stages of damage of beam simply and doubly notched; they are the initiation stages, the controllable propagation and then the unstable stage where the structure failure can occur at any time.v Identify initial and critical life fraction of both studied casesThus the results obtained in this part allowed judging on the criticality of default type, in our case simple notch is more harmful than double notch. The second part analyzes the beam stress distribution by theoretical calculation of stress intensity factor for every default size which allowed deducing that the simply notched structure present important concentration factor and consequently a high concentration reflecting a high level of criticality.The third part evaluates the stress intensity factor of both cases by analytical approach which was validated by a numerical finite element study. The results of this part come consolidate those other parties that one scored a bigger SIF at the single notch.
References
| [1] | Tada, H., Paris, P.C., Irwin, G.R., The stress analysis of cracks Handbook, second Ed. Paris production. (1985). |
| [2] | Murakami, Y., Stress Intensity factor Handbook. Oxford: Pergamon Press. (1987). |
| [3] | McNeil, S.R., Peters, W.H., Sutton, M.A. (1987). Estimation of stress intensity factor by digital image correlation, Engineering Fracture Mechanics, 28(1) 101-112. |
| [4] | Alliche A. Damage model for fatigue loading of concrete. Int. Journal of fatigue, (26), 915-921. (2004). |
| [5] | Boresi, A.P, Schmidt, R. J.. Advanced Mechanics of Materials, Sixth Edition (2002). |
| [6] | J-U. Jeong, J-B. Choi, N-S. Huh,Y-J. Kim Stress Intensity Factor and Elastic Crack Opening Displacement Solutions of Complex Cracks in Pipe Using Elastic Finite-Element Analyses, J. Pressure Vessel Technol 138(1), (2015). |
| [7] | M. Chauhan, D. S. Sharma, J. M. Dave Stress intensity factor for hypocycloidal hole in finite plate, Theoretical and Applied Fracture Mechanics Vol. 82, April 2016, Pages 59–68. |
| [8] | P. Livieri, Stress intensity factors from stress analysis of an equivalent hole, Theoretical and Applied Fracture Mechanics Vol. 84, August 2016, Pages 119–128. |
| [9] | S. Reddy, V. Jaswanthai, M. Madhavan, V. Kumar Notch stress intensity factor for center cracked plates with crack stop hole strengthened using CFRP: A numerical study. Thin-Walled Structures Vol. 98, Part B, January 2016, Pages 252–262. |
| [10] | Z. He, A. Kotousov, A. Fanciulli, F. Berto, G. Nguyen, On the evaluation of stress intensity factor from displacement field affected by 3D corner singularity, International Journal of Solids and Structures Vol. 78–79, 1 January 2016, pp. 131–137. |
| [11] | François, D., Pineau, A., Zaoui, A.(2009).Viscoplasticité, endommagement mécanique de la rupture et mécanique du contact. Ed. Hermes-Lavoisier Paris. |
| [12] | Lemaire, M. (Fiabilité des structures: couplage mécano-fiabiliste statique. Ed. Hermes-Lavoisier Paris, 2005). |
| [13] | Procaccia, H., Morilhat, P.. Fiabilité des structures des installations industrielles, édition Eryolles (1996). |
| [14] | Recho, N.. Rupture par fissurations des structures. Ed. Hermes, Paris, (1995). |
| [15] | Shah, R.C., Kobayashi, A.S. Stress Intensity Factor for an Elliptical Crack Under Arbitrary Normal Loading, Journal of Engineering Fracture Mechanics, 3(1), 71–96 (1971). |

 Abstract
 Reference
 Full-Text PDF
 Full-text HTML