-
Paper Information
- Previous Paper
- Paper Submission
-
Journal Information
- About This Journal
- Editorial Board
- Current Issue
- Archive
- Author Guidelines
- Contact Us
International Journal of Mechanics and Applications
p-ISSN: 2165-9281 e-ISSN: 2165-9303
2013; 3(4): 98-104
doi:10.5923/j.mechanics.20130304.06
Computational Study of a Vertical Axis Water Turbine Placed in a Hydrodynamic Test Bench
 Abstract
 Reference
 Full-Text PDF
 Full-text HTML
Zied Driss, Mohamed Ali Jemni, Amin Chelly, Mohamed Salah Abid
National Engineering School of Sfax (ENIS), Laboratory of Electro-Mechanic Systems (LASEM), University of Sfax, B.P. 1173, km 3.5 Road Soukra, 3038, Sfax, Tunisia
Correspondence to: Zied Driss, National Engineering School of Sfax (ENIS), Laboratory of Electro-Mechanic Systems (LASEM), University of Sfax, B.P. 1173, km 3.5 Road Soukra, 3038, Sfax, Tunisia.
| Email: |  |
Copyright © 2012 Scientific & Academic Publishing. All Rights Reserved.
Numerical investigation was carried out to study the hydrodynamic structure flow around a vertical axis water turbine. The used test section is on Plexiglas to facilitate visualization of phenomena that occur around the prototype. It is chosen equal to 40 cm x 40 cm with a length equal to 3 m. The software SolidWorks Flow Simulation has been used to present the local characteristics in different longitudinal section planes of the considered control volume. The numerical model is based on the resolution of the Navier-Stokes equations in conjunction with the standard k-ε turbulence model. These equations were solved by a finite volume discretization method.
Keywords: Water Turbine, Hydrodynamic Structure, Modeling, Control Volume
Cite this paper: Zied Driss, Mohamed Ali Jemni, Amin Chelly, Mohamed Salah Abid, Computational Study of a Vertical Axis Water Turbine Placed in a Hydrodynamic Test Bench, International Journal of Mechanics and Applications, Vol. 3 No. 4, 2013, pp. 98-104. doi: 10.5923/j.mechanics.20130304.06.
Article Outline
1. Introduction
- The use of renewable energies is obviously not new. But, with the advent of industrial revolution, they were marginalized in favor of other energy sources that were thought most promising[1-2]. In recent decades, however, air pollution, global warming and the risks of nuclear power have raised awareness of the need for organization of society that respects the environment in which we live[3-4]. Hydroelectricity, as a technology, started in the last decade of the 19th century, and pre-dates by many years the increasing public awareness of environmental issues[5]. The researches in hydrodynamics are directed towards local knowledge of hydrodynamic phenomena around turbines. In fact, knowledge of local hydrodynamic structures allows analysing the performance of water turbines for the development of optimum operating conditions and the improvement of the quality of the flow in different compartments. Face of this information request, the numerical simulations implements modeling techniques to calculate the various parameters of the flow in any configuration. For example, Pinon et al.[6] presented numerical computations of three bladed horizontal axis marine current turbines in a uniform free upstream current. The unsteady evolution of the turbine wake is taken into account by some three-dimensional software, developed to assess the disturbances generated in the sea. An unsteady Lagrangian method is considered for these computations using Vortex Method. The vortex flow is discretised with particles carrying vorticity, which are advected in a Lagrangian frame. The paper presented results on both power and thrust coefficient predictions and wake characterisation, up to ten diameters downstream of the turbine. Moreover, two different marine current turbines configurations are considered: one is taken from literature and the second one is an open-modified version of turbine inspired from previous works. Koo et al.[7] presented the simulation results of the plunging wave-breaking generated by impulsive flow over a submerged bump fixed in a shallow water flume using the exact experimental initial and boundary conditions. The overall plunging wave breaking process is described with major wave breaking events identified: jet plunge, oblique splash and vertical jet. These major events repeat up to four times before entering the chaotic breaking phase. The simulations qualitatively predict all four time phases, all four plunging events and their sub-events. The wave profile and location at the maximum height is very close to the experiment results. The flume flow and velocity demonstrate the same flow trend as the experiments but with reduced velocity magnitudes. The simulations show similar bottom pressure to the experiments but with large oscillations, and the post-breaking water elevations are larger as compared to the experimental results. Kang et al.[8] simulated turbulent flow past an axial-flow marine hydrokinetic (MHK) turbine mounted on the bed of a rectangular open channel by adapting a computational framework developed for carrying out high-resolution large-eddy simulation (LES) in arbitrarily complex domains involving moving or stationary boundaries. The complex turbine geometry, including the rotor and all stationary components, is handled by employing the curvilinear immersed boundary (CURVIB) method. Velocity boundary conditions near all solid surfaces are reconstructed using a wall model based on solving the simplified boundary layer equations. To demonstrate the capabilities of the model, the flow past a Gen4 axial flow MHK turbine has been simulated. Jianhong et al.[9] studied three-dimensional physical model of single-stage turbine and guided it into the pre-process software. After meshing the turbine flow channel, simulating the mud flow characteristics in turbine with CFD, and calculating the pressure drawdown at the inlet/outlet and the pressure distributions in single-stage turbine. Such results indicated that the pressure drawdown of single-stage turbine is influenced by the mud discharge capacity, drilling fluid density and viscosity. The pressure drop increases with the augment of mud discharge, which is approximately linear. There are significantly positive correlations between the pressure drawdown and the increase of mud density. The research provided reliable guidance in turbine flow channel design and the drilling technological parameters optimizing. Saeed et al.[10] presented the results of large scale modelling of the water flow and the analysis flow-induced stresses in a Francis turbine runner. The modelling undergoes two stages. The first stage deals with the water flow that has been investigated by using Computational Fluid Dynamics (CFD) in order to identify the loads acting on the turbine blades. At the second stage, the finite element analysis of stresses has been performed based on the pressure distributions calculated from CFD modelling. The operational data recorded at Unit 2 of the Derbendikan power station have been used as input in the modelling. The results of calculations have revealed that the zones of high stress are situated at the trailing edge of the turbine runner, which explains observed fatigue cracks in these areas. Sambe et al.[11] studied solitary wave breaking over a sloping bottom covered with macro-roughness elements. Wave breaking is simulated by solving Euler equations with a two phase incompressible flow model. The hyperbolic system of the conservation laws is solved with a finite volume discretization on an unstructured grid. An artificial compressibility approach allows the use of a fully explicit scheme for an efficient parallel implementation. The numerical model is based on a low Mach number preconditioning and a second order Riemann solver. Several test cases are performed to analyze the role played by macro-roughness on the breaking dynamics. The influence of the macro-roughness elements on the solitary long wave breaking is shown to depend on two dimensionless ratios. Three-dimensional wave breaking simulations are presented, showing the robustness of the method for modeling complex wave-structure interactions.In this paper, numerical simulation provided by the software "SolidWorks Flow Simulation" was investigated around a vertical axis water turbine. Particularly, we are interested in characterizing the hydrodynamic structure of the turbulent flow in different planes of the considered control volume.
2. Geometrical System
- The system under investigation is defined by a test section equipped by a vertical axis water turbine (Figure 1b). The decisive factor for each component of the hydraulic test bench is the dimension of the test section that is determined by the object that will be tested. The test section is on Plexiglas to facilitate visualization of phenomena that occur around the prototype. According to the terms of reference section of the vein is chosen equal to 40 cm x 40 cm for our needs. The length of the test section is equal to 3 m. It is equipped at the top with an opening for inserting the water turbine (Figure 1a).
 | Figure 1(a). Vertical axis water turbine |
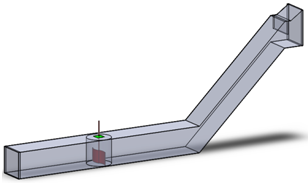 | Figure 1(b). Test section of the hydrodynamic test bench |
3. Numerical Model
- The numerical model is based on the resolution of the Navier-Stokes equations in conjunction with the standard k-ε turbulence model. These equations were solved by a finite volume discretization method. The software "SolidWorks Flow Simulation" has been used[12-14].
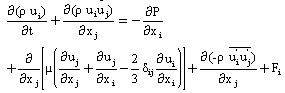
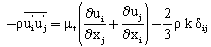
3.1. Mathematical Formulation
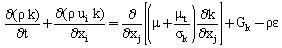
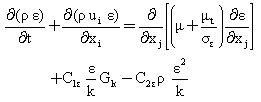
- This paragraph deals with the mathematical equations which are based on this modeling. The mathematical formulation based on the equations binding the various flow parameters. The equations governing the flow with the necessary simplifications are obtained from the continuity equation, the equation of momentum, the transport equation of turbulent kinetic energy k and the transport equation of dissipation rate of turbulent kinetic energy ε[15-16].For the incompressible fluid, the continuity equation is written as follow:
 | (1) |
 | (2) |
 | (3) |
 | (4) |
 | (5) |
 | (6) |
|
3.2. Boundary Conditions and Meshing
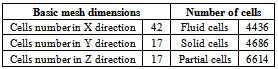
- The boundary conditions are presented in figure 2. In the present study, the inlet velocity is equal to V=4.45 m.s-1 and the outlet pressure is equal to P=101325 Pa. The compartment in the vicinity of the turbine presents a rotation area defined by Ω=5 rad.s-1. Figure 3 and table 2 illustrate all information about meshing.
|
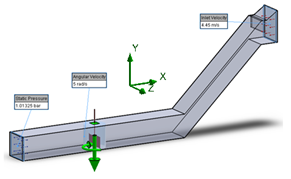 | Figure 2. Boundary conditions |
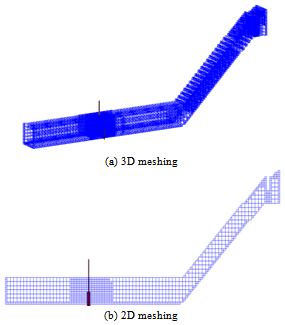 | Figure 3. Meshing |
4. Results and Discussions
4.1. Velocity Vectors
- Figure 4 shows the distribution of velocity vectors in the test section. The considered planes are defined by z=0 and y=0. According to these results, it’s clear that the velocity vectors reach its maximum values on the collector after the door. Around the water turbine, a rotating movement of the fluid has been observed. The recirculation zone of the fluid remains away from the turbine. Therefore, energy is transmitted to the turbine movement.
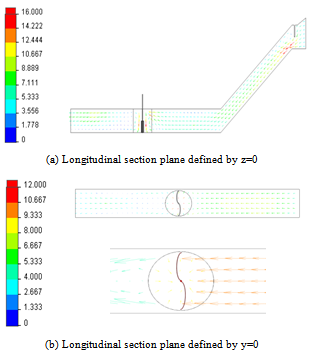 | Figure 4. Distribution of the velocity vectors |
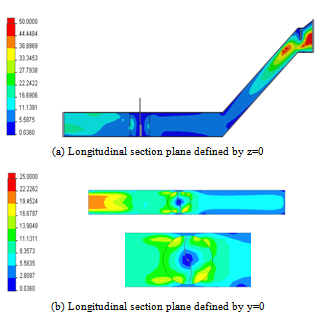
4.2. Average Velocity
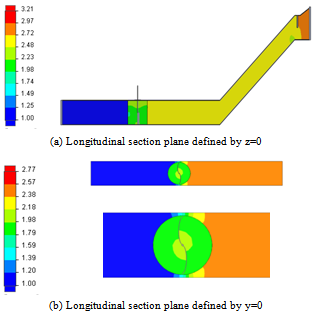
- Figure 5 shows the distribution of the average velocity throughout the test section equipped by the water turbine. In the collector, the maximal value is always located in the vicinity of the down wall and before the door. The phenomenon of symmetry in the rotating part is apparent in these results. Also, it has been noted that the velocity at the pallet sides is very high and reaches V=16 m.s-1. On the turbine downstream, the velocity is very low.
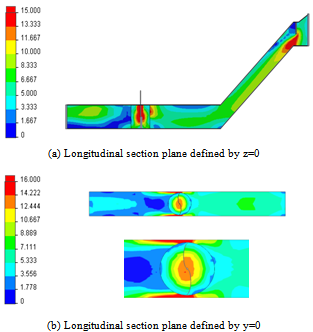 | Figure 5. Distribution of the average velocity |
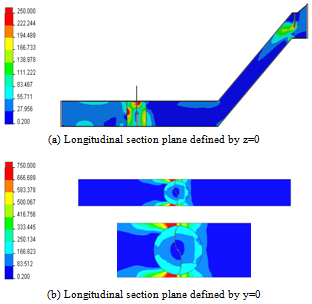
4.3. Static Pressure
 | Figure 6. Distribution of the Static pressure |
4.4. Dynamic Pressure
- Figure 7 illustrates the distribution of the dynamic pressure in the test section equipped by the water turbine. According to these results, it has been noted that the dynamic pressure depends essentially on the fluid speed. The maximum value is obtained in the vicinity of the door and the rotating part. The symmetry phenomenon is well described in these results. The compressed areas are located in the rotating zone and near the door.
 | Figure 7. Distribution of the dynamic pressure |
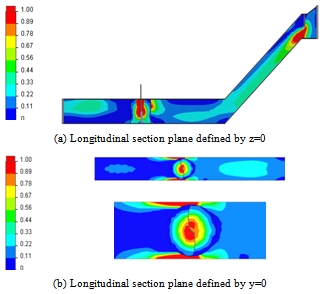
4.5. Turbulent Kinetic Energy
- Figure 8 shows the distribution of the turbulent kinetic energy over the entire test section equipped by the water turbine. According to these results, it has been noted that the turbulent kinetic energy is always important in the collector chamber in the vicinity of the door. Indeed, the turbulent kinetic energy is very weak in the turbine compartment. In the turbine downstream, the turbulent kinetic energy increases. This fact is confirmed in the longitudinal section plane defined by y=0.
 | Figure 8. Distribution of the turbulent kinetic energy |
4.6. Turbulent Dissipation Rate
- Figure 9 shows the distribution of the dissipation rate of the turbulent kinetic energy in the test section equipped by the water turbine. According to these results, it has been noted that the dissipation rate is located in the vicinity of the door and near the pallets in the rotating zone. This fact is due to the transformation of the turbulent kinetic energy into heat.
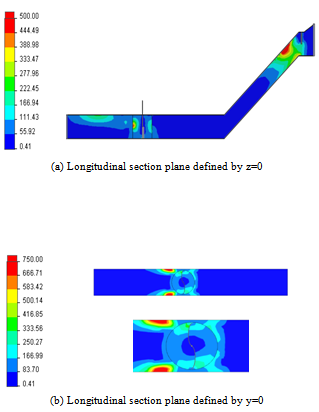 | Figure 9. Distribution of the turbulent dissipation rate |
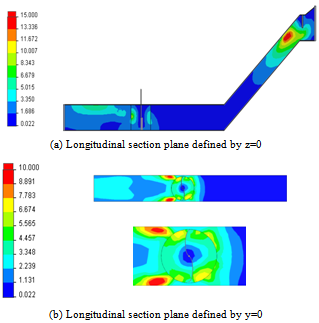
4.7. Turbulent Viscosity
- Figure 10 shows the distribution of the turbulent viscosity throughout the test section equipped by the water turbine. According to these results, it has been noted that the turbulent viscosity is very important in the collector compartment and in the turbine downstream. This fact is confirmed in the longitudinal section plane defined by y=0.
 | Figure 10. Distribution of the turbulent viscosity |
4.8. Vorticity
- Figure 11 shows the distribution of the vorticity in the test section equipped by the water turbine. According to these results, the symmetry of the vorticity zone appears around the axis of the turbine in both longitudinal sections defined by z=0 and y=0. In the collector compartment, the vorticity zone appears in the vicinity of the door.
 | Figure 11. Distribution of the vorticity |
5. Conclusions
- In this paper, a computational fluid dynamic investigation was developed to present the hydrodynamic characteristics around a vertical axis water turbine. Particularly, the distribution of the velocity fields, the pressure and the turbulent characteristics was presented in different longitudinal planes of the test section. According to these results, it has been noted that the water turbine has a direct effect on the flow characteristics. In the future, we propose to develop an experimental investigation to study the global characteristics of the water turbine and to validate the numerical results developed by the Computational Fluid Dynamic simulations.
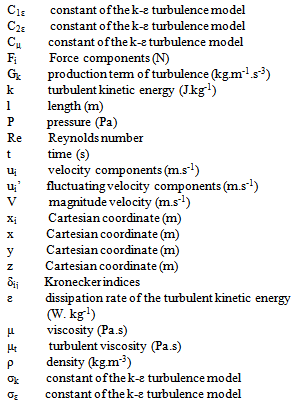
NOMENCLATURE