-
Paper Information
- Next Paper
- Previous Paper
- Paper Submission
-
Journal Information
- About This Journal
- Editorial Board
- Current Issue
- Archive
- Author Guidelines
- Contact Us
International Journal of Mechanics and Applications
p-ISSN: 2165-9281 e-ISSN: 2165-9303
2012; 2(5): 81-87
doi: 10.5923/j.mechanics.20120205.05
A Combination of a 3 Step Temporal Phase Algorithm and a High Speed Interferometer System for Dynamic Profile Measurements
 Abstract
 Reference
 Full-Text PDF
 Full-Text HTML
David Asael Gutiérrez Hernández , Carlos Pérez López , Fernando Mendoza Santoyo
Centro de Investigaciones en Óptica. Lomas del Bosque 115. Col. Lomas del Campestre. C.P. 31715. León, Guanajuato. México
Correspondence to: David Asael Gutiérrez Hernández , Centro de Investigaciones en Óptica. Lomas del Bosque 115. Col. Lomas del Campestre. C.P. 31715. León, Guanajuato. México.
| Email: |  |
Copyright © 2012 Scientific & Academic Publishing. All Rights Reserved.
This work presents the application of a temporal phase algorithm on a high speed optical interferometry vibration study. The object is a rectangular plate clamped on its four sides. The dynamic event of a complete cycle of vibration is registered by means of a high speed electronic speckle pattern interferometry system (HS ESPI). The HS ESPI system contains a CMOS camera set at 4000 frames per second leaving the shutter widely open all the time. A group of intensity patterns of interference are recorded, different sets of fringe patterns along the cycle of vibration come from the subtraction of the intensity patterns of interference and are processed by a three-frame temporal phase measurement method to recover the phase of deformation of the plate. The result is reported and is also compared with the mechanical phase described on the theory.
Keywords: ESPI, High Speed Interferometry, Vibrations
Article Outline
1. Introduction
- Optical techniques for vibrations measurements have had a very important role in industrial evolution. The introduction of high speed cameras to very well known systems like electronic speckle interferometry and digital holography gives a big opportunity to study dynamic events with much more precision. High speed optical interferometry is a powerful optical tool for measuring the phase difference between two events of an object under some mechanical change[1, 2]. There are some industrial and biomedical applications that use optical interferometry measurements for vibration analysis, also for testing mechanical objects, and recently for measuring of non solid objects (elastics)[3]. Temporal phase measurement techniques have been used to detect the phase for the study of the complete deformation evolution in static and dynamic events. The optical set ups used in these techniques employed tilted mirrors or piezoelectric components to retrieve the optical phase of the reference beam. In this work we present the use of a known temporal phase measurement algorithm for temporal asynchronous demodulation applied to a sequence of High-Speed Electronic Speckle Pattern Interferometry (HS-ESPI) interferograms from an optical set up that does not have tilting mirrors or piezoelectric component, in this case, the optical phase is obtained because the retrieved optical phase comes from the object beam which is under continuous movement due to an external excitation. The interferograms’ sequence comprises a whole cycle of the harmonic event taken from a clamped rectangular metal plate excited at the first resonant frequency. In order to obtain the phase from these interferograms’ sequence, the algorithm only needs 3 interferograms taken during various cycles. The High-Speed system works at 4000 fps (frames per second) using a CMOS camera and a continuous wave (cw) Verdi laser at 532 nm. Simulated phase data is compared to experimental results and plotted to show errors in the proposed method. To determine phase, electronic and analytic techniques are used.. Some of these algorithms have worked with a set of three, four or five recorded fringe patterns using a phase shift of 90°, but also, there are algorithms that are independent of the amount of phase shift[4-12]. Recent works have reported new methods and algorithms that go from the study of a single, two or more steps to get a phase recovery; nevertheless, they have to cover some requirements to be applied in order to work properly[13-18]. The application of these algorithms requires of a phase change in the reference beam. In this work, the change of phase comes directly from the excited object. The three-frame technique by Wyant et al, established in 1984[6], is applied to a selected group of fringe patterns coming from a HS-ESPI system, where a continuous wave laser illumination and a high speed camera are used.
2. Experimental Setup and Object Description
- Figure 1 shows an out-of-plane sensitive HS ESPI. The beam coming from a cw laser with 6-Watts maximum and 532 nm, is divided into an object beam and a reference beam, IO and IR respectively, by a beam splitter. The object beam is projected over the target by means of a 10x microscope objective and the reflection of this is recombined by a second beam splitter. The reference beam is re-directed to the second beam splitter and then to the sensor of the camera. For this experiment the laser is set to a power of 5.5 Watts, the exposure time of the CMOS camera is set at 4000 frames per second and the shutter is all the time open.
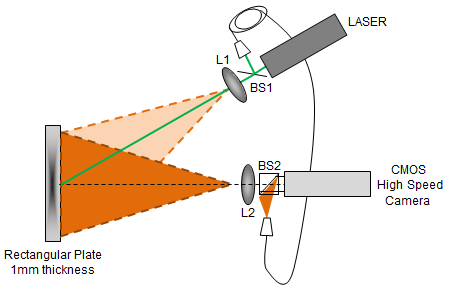 | Figure 1. Optical set up for a high-speed ESPI system. Beam splitter 1 is a 70/30, beam splitter 2 is a 50/50, microscope objectives are 10x. The object to study is a 140x190x1 mm rectangular aluminum plate |
 | (1) |
 must satisfy the border conditions
  for all
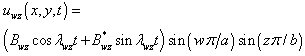
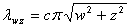
  , c depends on the mechanical properties of the material of the plate. Eq. (1) can be solving by applying the variables separation method as the product of two functions of the form:
 | (2) |
 can be written as:
 | (3) |
 | (4) |
 | (5) |
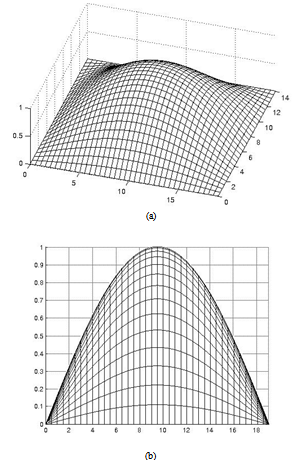 | Figure 2. (a) Numerical model for the first vibration modal of the rectangular plate, (b) profile of the dynamic deformation of the plate in a = 19 |
3. Theoretical Description
- In the high speed optical interferometry technique, the addition of the reference beam
 and the object beam
  is written as
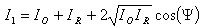 | (6) |
 is the subtraction of the phase of the wavefront of the object beam
  and the reference beam
  .Once the surface of the object is deformed, the phase of
  changes by
  , and thus the sum of two beams after deformation
  can be written as
 | (7) |
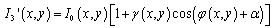
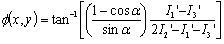
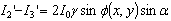
 can be given by
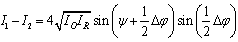 | (8) |
 can be expressed as
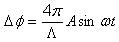 | (9) |
 is the wavelength of a laser,
  is the amplitude and
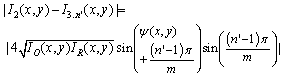
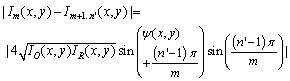
  is the natural frequency.Eq. (9) indicates that the vibration on the object’s surface will change cyclically from a minimum until a maximum amplitude A. It is considered that in a HS-ESPI system there are more than two intensities that can be stored by a sensor while the object is under def1ormation,
 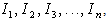 then, the phase of the intensity patterns of interference will change from
  until
until  . The number of intensity patterns of interference stored in a complete vibration cycle will depend on the natural frequency,
  , and on the exposure time of the CMOS camera,
  . In this case, the intensity patterns of interference stored by the camera can be written as
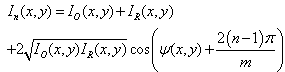 | (10) |
 and
and 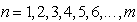 . The integer function int[ ] gives an integer number of intensity patterns of interference that fit in a complete cycle of vibration conserving always the same amount of phase shifts between them. The subtraction of intensities of the input images
 ,
,  , to
, to  can be given by
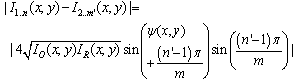 | (11) |
 | (11b) |
 | (11c) |
 | (11d) |
 | (12) |
 | (13) |
 | (14) |
 | (15) |
 | (16) |
 | (17) |
 is
is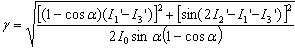 | (18) |
 | (19) |
 | (20) |
4. Simulating results
- Consider a full resonant vibration cycle at ω = 320Hz, with the CMOS camera working at an exposure time,
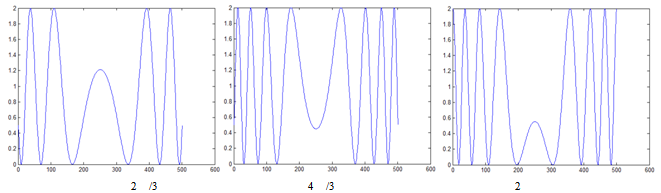
 = 4000 fps. The relation of intensity patterns of interference recorded by the camera gives a sample of m=12 fringe patterns along the whole vibration event. The intensity patterns are separated from each other by a constant time. To reach the 12 fringe pattern, we start from any intensity pattern of intensity at any time, called I1, and then the subsequence intensity is subtracted from it, then, the followed intensity pattern, I2 is selected and the subsequence intensity is subtracted from it, same procedure keeps doing until cover the full cycle of vibration according to eq. (11d). Then a selected fringe pattern is chosen for all the combinations and is used to be applied on the Wyant’s algorithm. The fringe patterns obtained by the subsequent subtraction of the intensity patterns are shown in figure 3. The figure represents a complete cycle of vibrating evolution where the maximum deformation of the plate is located in the center of it. In accordance to eq. (1) the deformation of the plate must follow a polynomial function of degrade 2 or 4.According to Wyant, a single fringe pattern is selected and then shifted by a certain amount of phase in order to recover the phase of deformation. For this simulation the fringe pattern selected is the one inside the rectangle in figure 3 (b), Figure 4 shows the profile of the fringe patterns to be used in Wyant’s algorithm.
 | Figure 3. Representation of a full vibration cycle. (a) Optical phase change along the cycle. The y axis measures the relative deformation amplitude and the x axis shows the interferograms at different phase and time positions. (b) Each fringe pattern represents an instant of the mechanical phase of deformation of the plate |
 | Figure 4. Shifted profiles of the selected fringe pattern |
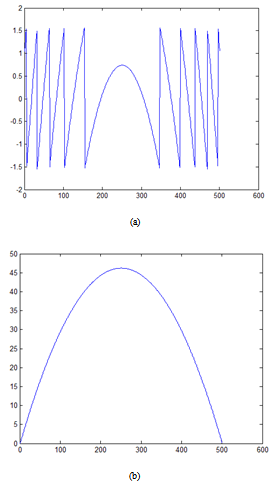 | Figure 5. (a) Recovered phase of the rectangular plate under deformation; (b) Simulation of the profile of the deformation of the vibrating plate that comes from the processing of 3 selected fringe patterns with an amount of phase α1=2π/3 between each other |
5. Experimental Result
- Figure 6 shows the intensity patterns of interference recorded by the HS ESPI.The experimental fringe patterns coming by the HS-ESPI are shown in figure 7. This group of fringe patterns shows how the plate changes in a time interval of 0 to 250s, 250s to 500s, 500s to 750s, 750s to 1ms, 1ms to 1.25ms until covering the 3.125ms needed for a complete cycle of vibration.It is observed that in each time interval, there is a set of fringe patterns with a visible change of the optical phase between them. Each time interval represents also a part of the mechanical phase evolution, in an instant of time and also along the time until 3.125ms that is the time needed to cover a full cycle of vibration.Taking advantage of using a high speed system, it is possible to choose the fringe pattern with the maximum information about the mechanical deformation of the plate due to the sinusoidal vibration. By simple observation (that can be also done by simple computational software to be more precise) it is possible to select the fringe pattern coming from the subtraction |I8-I9| as the fringe pattern with more information, from there, the selected fringe pattern to be used in Wyne’s algorithm is |I8-I9| and the respective fringe patterns containing more information coming from following cycles of vibration, as it is shown in figure 8. It is important to remember that the selected fringe pattern can be anyone along the cycle and also, within all the posible fringe patterns coming from the HS ESPI system.
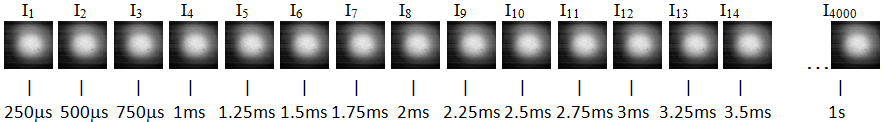 | Figure 6. Intensity patterns of interference coming from the HS ESPI. Each of these images is separated by the same amount of phase from each other |
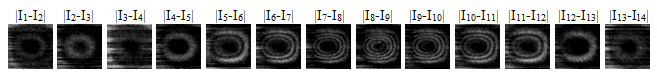 | Figure 7. Fringe patterns coming from the subtraction of the intensity patterns of interference recorded by the HS ESPI system |
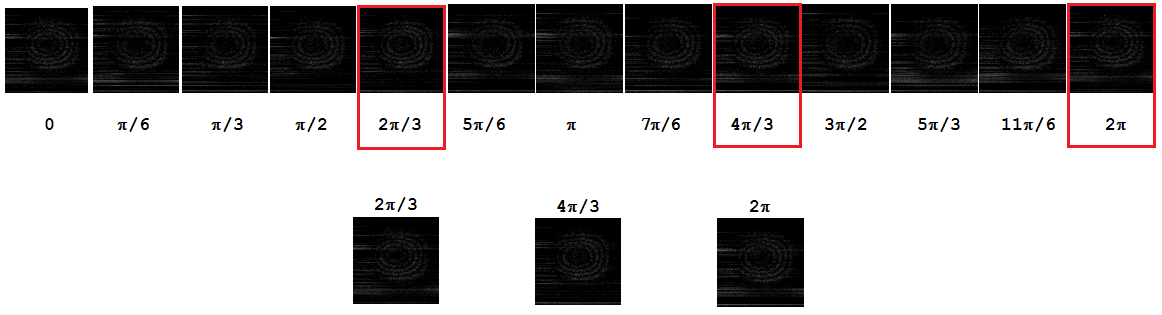 | Figure 8. The selected fringe patterns to recover the mechanical profile of vibration of the plate |
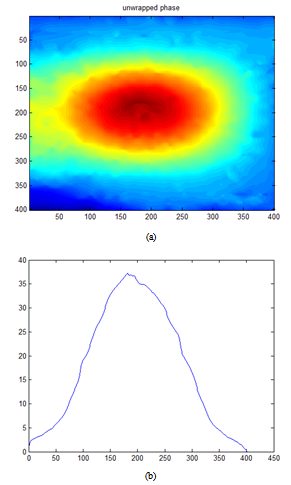 | Figure 9. (a) Recovered phase of the experimental work; (b) Experimental profile of the maximum deformation of the rectangular plate that comes from the processing of 3 selected fringe patterns with an amount of phase α=2π/3 between each other. The x and y axis represent pixels and radians respectively |
6. Conclusions
- A HS-ESPI system working with the Wyant’s technique of phase shifting is a very fast way to measure maximum mechanical displacement. The introduction of a high speed camera to an ESPI set up eliminates the need for tilted mirrors or piezoelectric devices for obtaining the phase and also eliminates the need of electronically synchronization. High speed cameras and continuous wave lasers give a very strong way for measuring real time vibrations; it can be a very interesting solution to be applied in industry. The system records a sequence of 4000 fps, which can be use for applying some of the phase shifting techniques proposed from many authors and can be useful to characterize the complete vibration evolution of a dynamic event. HS ESPI is a technique that allows a very fine exploration of mechanical displacements considering either static or dynamic events. The most important issue of the technique corresponds to a non contact and non invasive measurements.
ACKOWLEDGMENTS
- The authors would like to acknowledge partial financial support from Consejo Nacional de Ciencia y Tecnología, Grant 48177.