-
Paper Information
- Next Paper
- Previous Paper
- Paper Submission
-
Journal Information
- About This Journal
- Editorial Board
- Current Issue
- Archive
- Author Guidelines
- Contact Us
International Journal of Mechanics and Applications
p-ISSN: 2165-9281 e-ISSN: 2165-9303
2012; 2(5): 61-69
doi: 10.5923/j.mechanics.20120205.02
Experimental Investigation of Split and Recombination Micromixer in Confront with Basic T- and O- type Micromixers
 Abstract
 Reference
 Full-Text PDF
 Full-Text HTML
Mohammad Nimafar , Vladimir Viktorov , Matteo Martinelli
Department of Mechanical and Aerospace Engineering, Politecnico di Torino, Turin, 10129, Italy
Correspondence to: Mohammad Nimafar , Department of Mechanical and Aerospace Engineering, Politecnico di Torino, Turin, 10129, Italy.
| Email: |  |
Copyright © 2012 Scientific & Academic Publishing. All Rights Reserved.
The paper presents an experimental comparison of three types of static micromixer. Efficiencies of a split and recombination micromixer (SAR) based on plate symmetrical modules (PSM) and basic T-type and O-type mixers are examined. Experimental tests were carried out in the laminar flow regime with a low Reynolds number range, 0.083 ≤ Re ≤ 4.166 and image-based techniques were used to evaluate mixing efficiency. Experimental results illustrate that the micromixers with splitting and recombination have outstanding mixing efficiency than those of without SAR process. Indeed split and recombine (SAR) structures of the flow channels result in the reduction of the diffusion distance of two fluids and optimize the diffusion process and after a short distance from inlet high mixing efficiency can be achieved. Also, experimental data show that the SAR PSM mixer is up to 99% efficient, and that efficiency reaches 90% in a short distance, demonstrating this type of mixer’s high mixing performance and the effect of splitting and recombination on the degree of mixing and the efficiency of the micromixer.Both of the T- and O-type micromixers are designed and fabricated from plexiglas using a computer milling process.
Keywords: Gray Scale Value, Image-Based Technique, MEMS, Microfluidic, Passive Micromixer, SAR Process
Article Outline
1. Introduction
- Developing devices for microfluidic technology has been a major concern for industry in the past decade. Microfluidic devices offer many advantages over conventional techniques, including reduced reagent consumption, low energy requirements, faster analysis and low cost. Micromixers are key elements in microfluidic technology and have been addressed by a large body of research. In general, micromixers can be classified as either active and passive fluid mixers[1-4], depending on how they manipulate the fluids to be mixed. Active micromixers require external forces, such as acoustically induced vibrations, electrokinetic instabilities, periodical variation of pumping capacity, electrowetting-induced merging of droplets, magneto-hydrodynamic action, small impellers, piezoelectrically vibrating membranes or integrated micro valves and pumps[1-15]. By contrast with active mixers, a passive type requires no external energy and agitation, except that associated with producing the required pressure drop for flow. In a typical microfluidic device, the flow is laminar and characterized by low Reynolds numbers. The mixing process is slow and mainly due to molecular diffusion. The hydrostatic potential is used to restructure a flow in a way which results in faster mixing[1-3]. The mixing of microfluids in a passive device is based on several main principles: a) flow lamination, which is used in basic T-mixers and Y- mixers[16-21], in mixers with different geometries: zig-zag, square-wave, rhombic and the like[22- 23], and in serial multi-stage and multi-layer mixers[24-26]); b) chaotic mixing by eddy formation, stretching and folding[27-33]; c)split-and-recombine concepts (SAR)[34-39]. The mixing performance of passive mixers can be enhanced by extending the contact interface of fluids and by improving the transverse components of flow movement, thus decreasing the length and duration of mixing[37]. Previous investigations[34-39] have demonstrated that devices with a SAR mechanism increase the contact interface of fluids to generate rapid and homogeneous mixing that is suitable for slow laminar fluid flow. At the same time, some of the previous SAR mixers are complicated in terms of design and construction because of their three-dimensional micro structure[34],[35],[37]. The mixing mechanism of the mixer described in[38] is based on splitting and recombining (SAR) with chaotic advection and is best suited for mixing fluids with relatively high Reynolds numbers. The σ-type plane static mixer with splitting and inverse recombination[36] is simple in structure, but the branched channels of the σ-type plane module are not identical or symmetric. The channels vary in form and length, resulting in varied channel conductance. In this article we compare the efficiencies of split and recombination micromixer (SAR) based on plate symmetrical modules (PSM) and basic T-type and O-type mixers. Results are presented for experimental tests carried out in the laminar flow regime with a low Reynolds number range, 0.083 ≤ Re ≤ 4.166. Image-based techniques were used to evaluate mixing efficiency. Two colored water solutions (blue and yellow) are used for mixing.
2. Micromixer Design
- On the basis of the investigation presented in[39], a split and recombination micromixer consisting of plate symmetrical modules (SAR PSM micromixer) was designed and constructed with polycarbonate using a computerized milling process. SAR PSM micromixer design is shown in Figures 1 and 2.
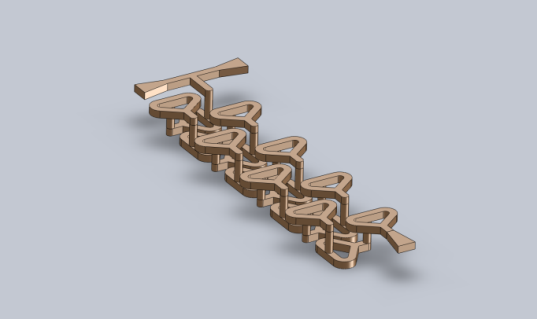 | Figure 1. Design of a SAR PSM micromixer |
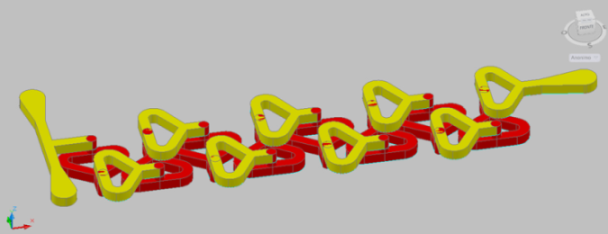 | Figure 2. SAR PSM micromixer |
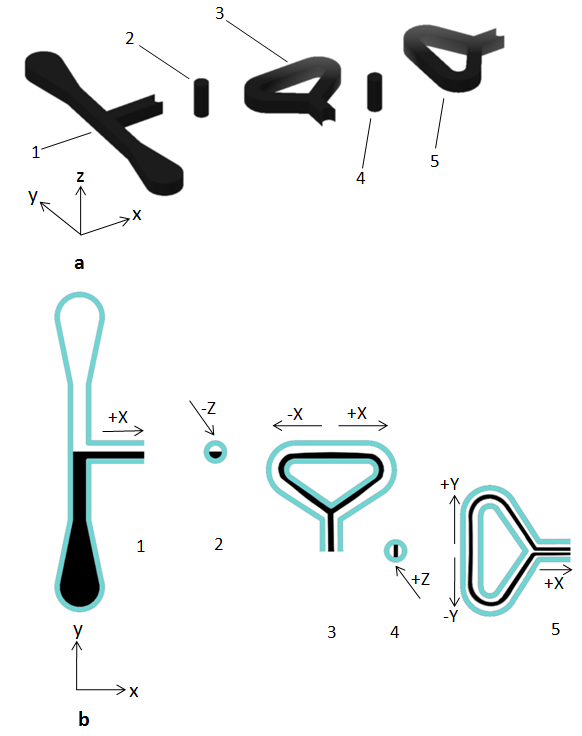 | Figure 3. SAR PSM micromixer structural details; a) PSM microchannel segments; b) Sequential lamination of layers |
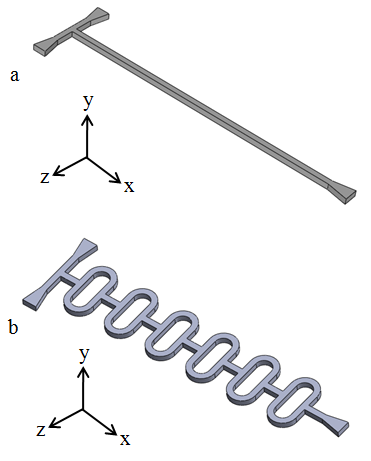 | Figure 4. (a) T-micromixer (b) O-micromixer |
3. Materials and Method
- The test bench layout used for this experimental investigation is shown in Figure 5.
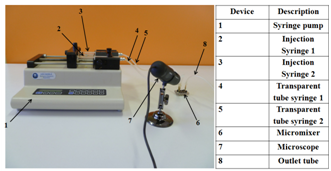 | Figure 5. Test bench layout |
4. Experimental Procedure
- Experimental tests were performed under the microscope (VMS-004D, Veho) with high speed image acquisition. As miscible fluids, colored water (blue and yellow) was used in all tests on the three micromixers. Colored water solutions for the tests were produced by blending 1 gram powder in 0.5 liter water. Species flow in the microchannel was controlled by means of a programmable syringe pump. Figure 6 depicts the mixing process through the microchannels in T, O and SAR PSM micromixers. After the mixing process was visualized as shown in the figure, mixing efficiencies for all micromixers were calculated and compared. As Figure 7 shows, two samples are concentrated into one stream while fluid flows.During the mixing process, several pictures were taken with the microscope from the inlet section to the end of the channel. This was repeated for all Reynolds numbers used in this study.
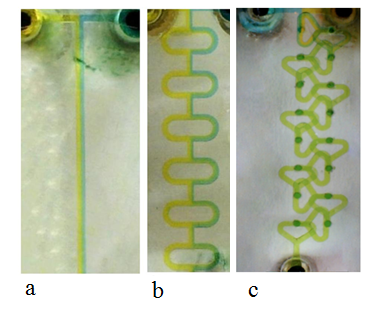 | Figure 6. Micromixers after filling: (a) T-micromixer (b) O-micromixer (c) SAR PSM micromixer |
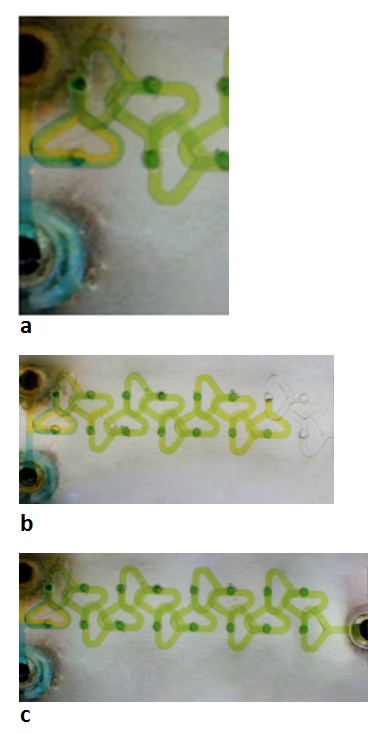 | Figure 7. SAR PSM micromixer after filling |
5. Post Processing
- To evaluate the standard deviation of concentration, mixing index and efficiency of the prototypes, three kinds of Matlab program code are written (PDF1, PDF2 and Efficiency). Data was analyzed using the following procedure:
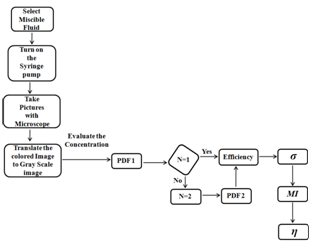 | Figure 8. Flow chart for experimental analyzing |
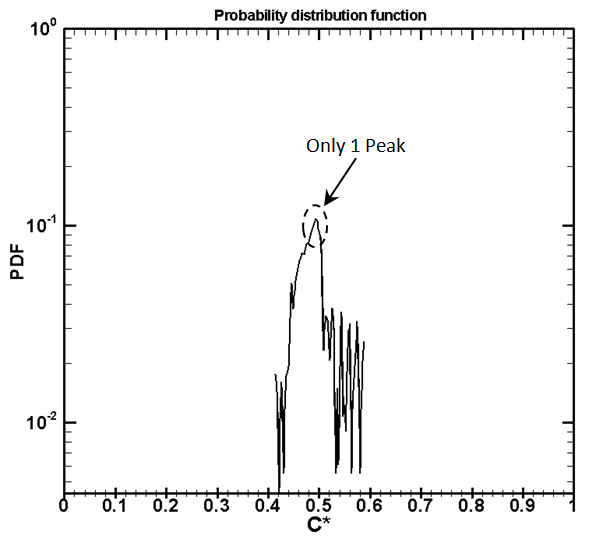
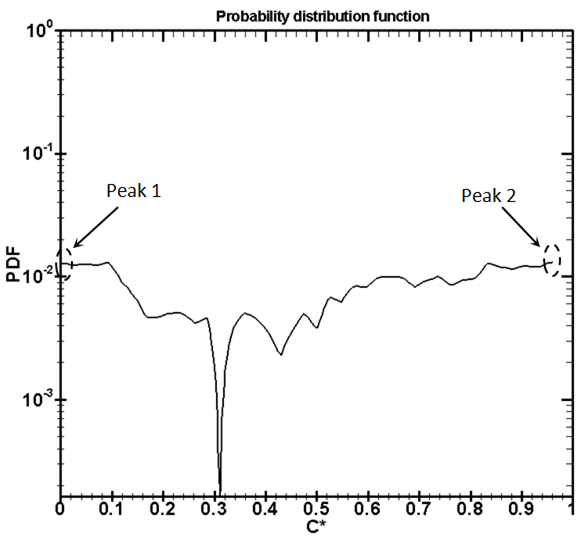 | Figure 9. PDF in SAR PSM micromixer, Re=1.666, entrance region |
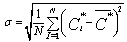 | (1) |
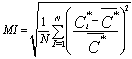 | (2) |
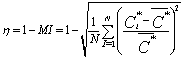 | (3) |
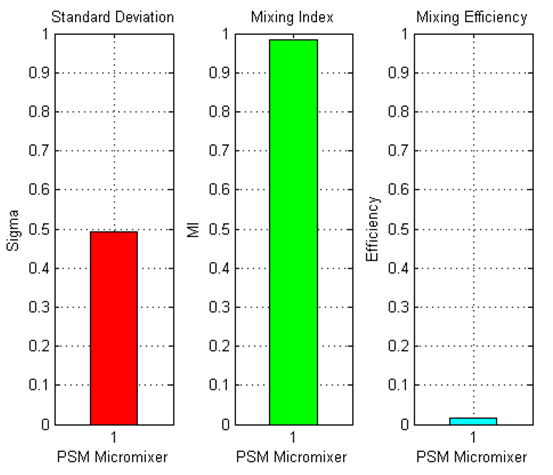 | Figure 10. σ, MI and η in SAR PSM micromixer, Re = 1.666, inlet section |
 | Figure 11. PDF in SAR PSM micromixer, Re = 1.666, after 20 mm |
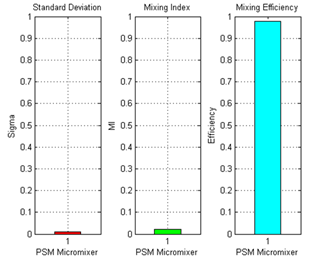 | Figure 12. σ, MI and η in SAR PSM micromixer, Re = 1.666, after 20 mm |
6. Result and Discussion
- At low Reynolds numbers, mixing takes place through molecular diffusion alone. Results obtained for the PSM micromixer are compared with those for the T- and O-mixers at the same Reynolds number in Figure 13.
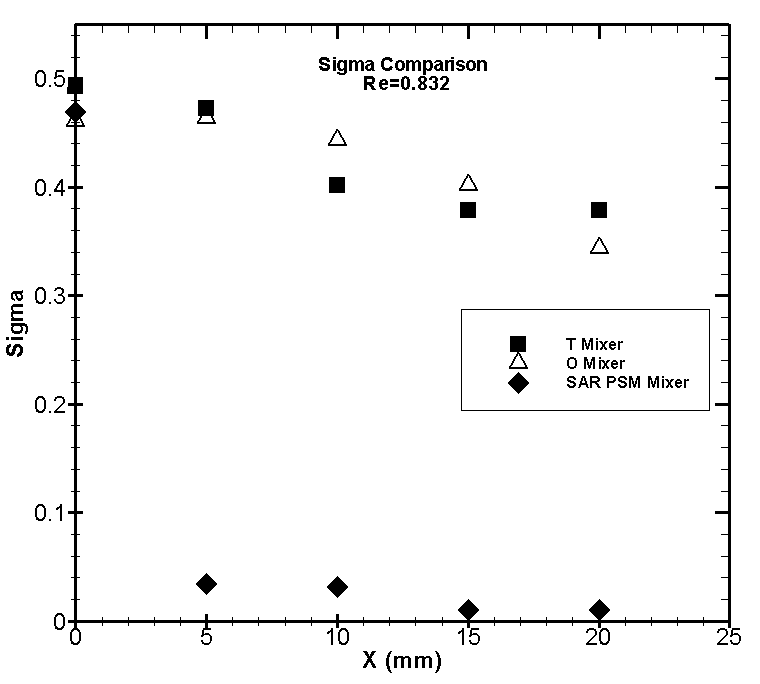 | Figure 13. Comparison of σ for T, O and SAR PSM mixers at Re = 0.832 |
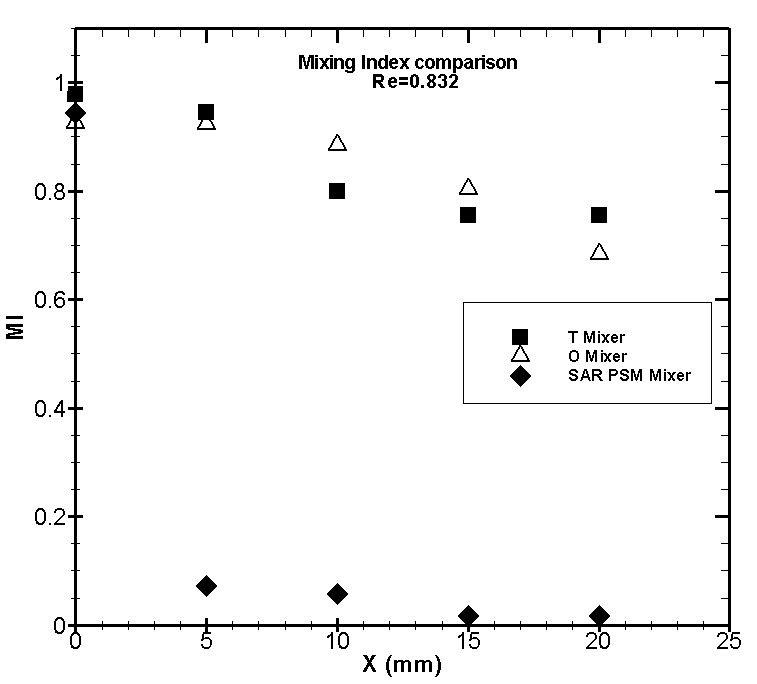 | Figure 14. Comparison of MI at Re = 0.832 |
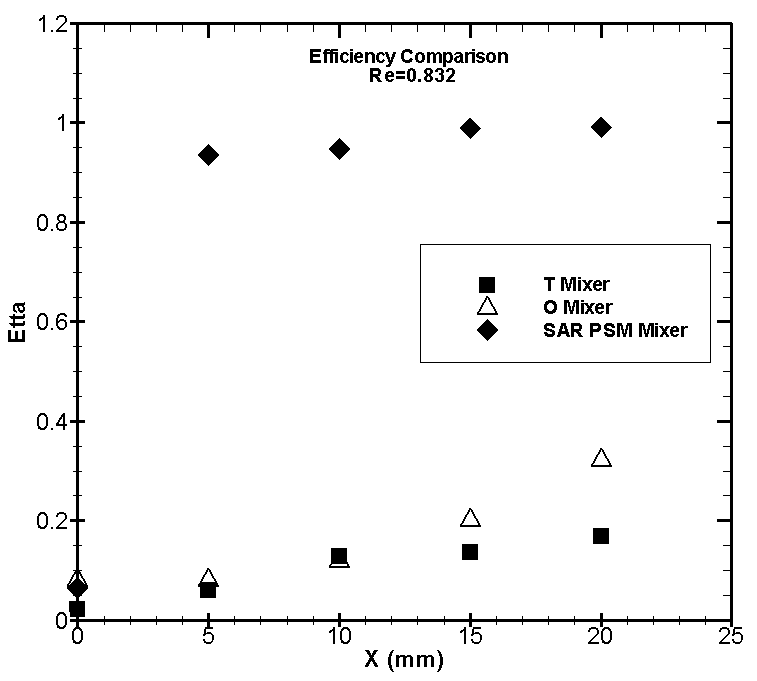 | Figure 15. Comparison of η at Re = 0.832 |
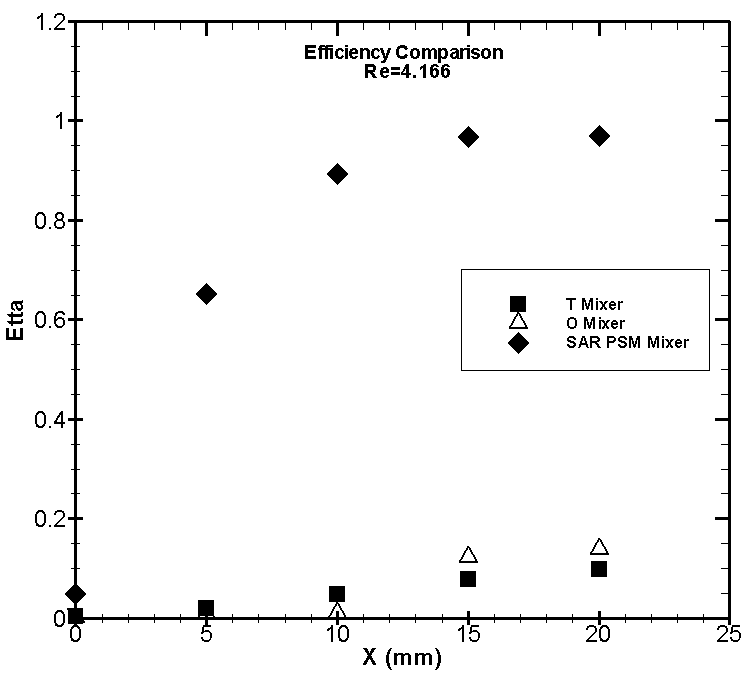 | Figure 16. Comparison of η at Re = 4.166 |
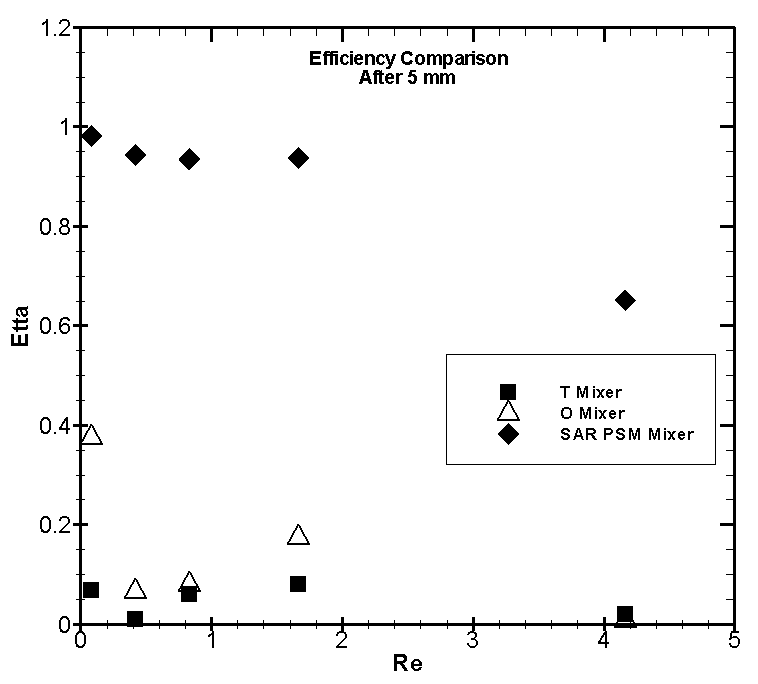 | Figure 17. Comparison of η in terms of Re, after 5 mm |
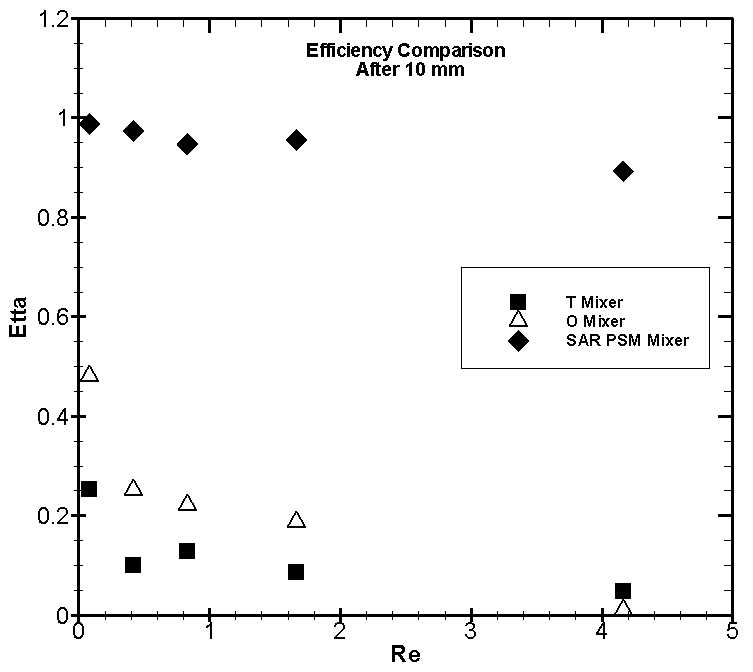 | Figure 18. Comparison of η in terms of Re, after 10 mm |
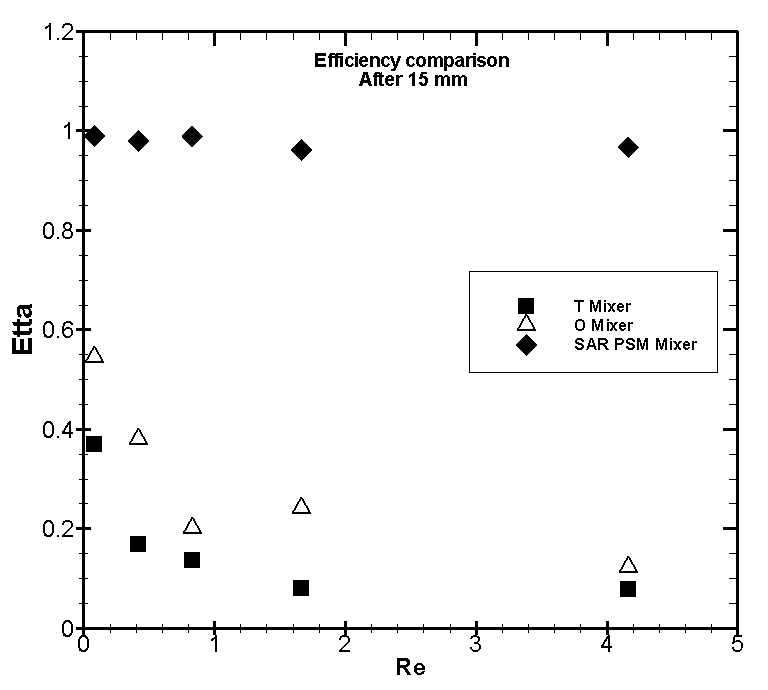 | Figure 19. Comparison of η in terms of Re, after 15 mm |
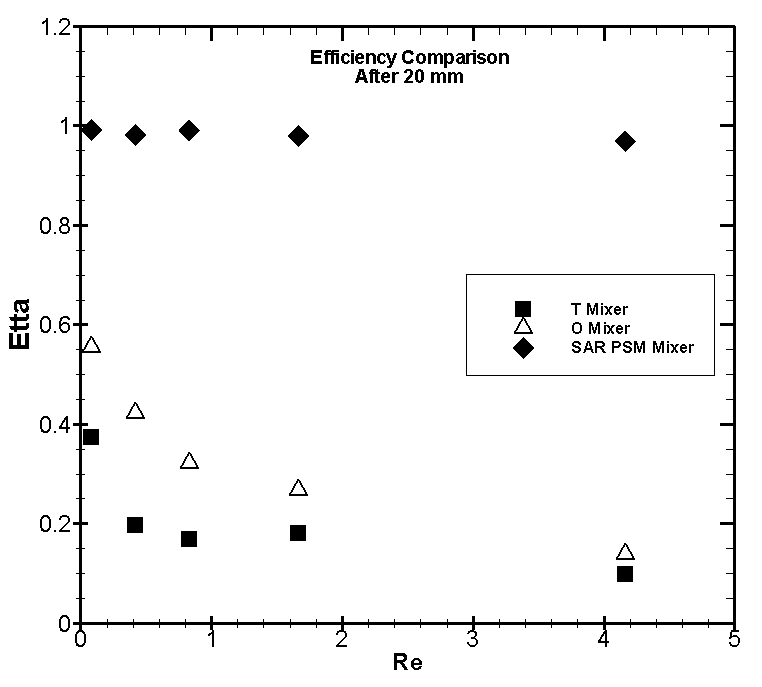 | Figure 20. Comparison of η in terms of Re, after 20 mm |
7. Conclusions
- This paper explained a 3D splitting and recombination passive micromixer called ‘’SAR PSM micromixer’’ which was designed and constructed with polycarbonate using a computerized milling process. Mixing characteristics of two species are analyzed via experimental investigation with various inlet flow rates (velocities) and results compared with the previous T-type and O-type well-known geometries mixers which were designed and fabricated from plexiglas using a computer milling process.In micromixers, viscosity dominates flow and mixing is limited to molecular diffusion due to the laminar nature of microflows such as T- and O-type micromixers and because of low mixing performance in these kind of microchannels, they are not applicable in industries.Since effective mixing is a crucial process in microfluidic systems, hence focus on this field of research is to propose a device itself and optimization of the geometry to help diffusion process to enhance fluid mixing within the microchannel to reach the desired degree of mixing.Comparison between SAR PSM and other mixers demonstrated that the SAR PSM micromixer is more efficient for mixing processes at low Reynolds numbers ( Re < 5), which generate complete mixing.Experimental data show that the standard deviation of the concentration at the outlet of the SAR PSM micromixer is below 0.1, which is less than that of the T- and O-mixers in the 0.083 ≤ Re ≤ 4.166 range.The mixing index changes at a more rapid rate in the SAR PSM mixer than in the T- and O-mixers at all flow rates. It can be concluded that mixing is accomplished more quickly in the SAR PSM micromixer than in the other prototypes. As mentioned before, After short distance, SAR PSM mixer’s efficiencies are acceptable while in other prototypes the degree of mixing is low demonstrating the effect of splitting and recombination on micromixer’s efficiency. Also, when the flow rate increases, standard deviation of concentration and mixing index rise and efficiency drops. However, the rate of change in the SAR PSM mixer is very slow, and it was found that flow rate can be increased to rapidly achieve complete mixing in the passive micromixer.
References
| [1] | V. Hessel, H. Löwe, F. Schönfeld , "Micromixers—a review on passive and active mixing principles", Chemical Engineering Science, 60 (2005) 2479 – 2501. |
| [2] | E. A. Mansur, Y. Mingxing, W. Yundong, D.Youyuan, "A State-of-the-Art Review of Mixing in Microfluidic Mixers", Chinese Journal of Chemical Engineering, 16(4) (2008) 503-516. |
| [3] | N.T. Nguyen , Z. Wu, "Micromixers—a review", J. Micromech. Microeng., 15 (2005) R1–R16. |
| [4] | H. Bockhorn, D. Mewes, W. Peukert, H.-J.Warnecke, "Micro and Macro Mixing: Analysis, Simulation and Numerical Calculation (Heat and Mass Transfer)", Springer (2010) ISBN: 3642045480, 348 pages. |
| [5] | Z. Yang et al., "Ultrasonic micromixer for microfluidic systems", Sensors and Actuators A 93 (2001) 266–272. |
| [6] | R.H. Liu et al., "Hybridization enhancement using cavitation microstreaming", Analytical Chemistry, 75 (8) (2003) 1911–1917. |
| [7] | M.H. Oddy, J.G. Santiago, J.C. Mikkelsen, "Electrokinetic instability micromixing", Analytical Chemistry 73 (24) (2001) 5822–5832. |
| [8] | I Glasgow, N. Aubry, "Enhancement of microfluidic mixing using time pulsing", Lab on a Chip 3 (2003) 114–120. |
| [9] | X. Niu, Y.-K. Lee, "Efficient spatial-temporal chaotic mixing in micro-channels" Journal of Micromechanics and Microengineering 13 (2003) 454–462. |
| [10] | S. Qian, H.H. Bau, "A chaotic electroosmotic stirrer", Analytical Chemistry 74 (15) (2002) 3616–3625. |
| [11] | A. Neilda, T. W. Nga, G. J. Sheardb, et al., "Swirl mixing at microfluidic junctions due to low frequency side channel fluidic perturbation", Sensors and Actuators B 150 (2010) 811–818. |
| [12] | P. Woias, K. Hauser, E. Yacoub-George (Eds.), "An active silicon micromixer for µ-TAS applications" In: van den Berg, A., Olthuis, W., Bergveld, P. (Eds.) Micro Total Analysis Systems Kluwer Academic Publishers, Dordrecht (2000) pp. 277–282. |
| [13] | J. Voldman, M.L. Gray, M.A. Schmidt, "Liquid mixing studies with an integrated mixer/valve" In: Harrison, J., van den Berg, A. (Eds.) Micro Total Analysis Systems, Kluwer Academic Publishers, Dordrecht (1998) pp. 181–184. |
| [14] | L.S. Jang, S.H. Chao, M. R. Holl, D. R. Meldrum, "Resonant mode-hopping micromixing", Sensors and Actuators A, 138 (2007), 179–186. |
| [15] | Y. Ma, C.P. Sun, M. Fields, Yang Li, et al, "An unsteady microfluidic T-form mixer perturbed by hydrodynamic pressure", J. Micromech. Microeng. 18 (2008) 045015 (14pp). |
| [16] | A.E. Kamholz et al., "Quantitative analysis of molecular interactive in microfluidic channel: the T-sensor", Anal. Chem. 71 (1999) 5340–7. |
| [17] | A.E. Kamholz and P. Yager, "Molecular diffusive scaling laws in pressure-driven microfluidic channels: deviation from one-dimensional Einstein approximations", Sensors and Actuators B 82 (2002) 117–121. |
| [18] | R.F. Ismagilov et al., "Experimental and theoretical scaling laws for transverse diffusive broadening in two-phase laminar flows in microchannel", Appl. Phys. Lett., 76 (2000) 2376–2378. |
| [19] | S. H. Wong, M.C.L. Ward, C.W. Wharton, "Micro T-mixer as a rapid mixing micromixer", Sensors and Actuators B 100 (2004) 359–379. |
| [20] | S.P. Sullivan, B.S. Akpa et al., "Simulation of miscible diffusive mixing in microchannels", Sensors and Actuators B 123 (2007) 1142–1152. |
| [21] | M.J. Swickratha, S.D. Burnsa, G.E. Wnekb, "Modulating passive micromixing in 2-D microfluidic devices via discontinuities in surface energy", Sensors and Actuators B 140 (2009) 656–662. |
| [22] | S. Hossain, M.A. Ansari, K.Y. Kim, "Evaluation of the mixing performance of three passive micromixers", Chemical Engineering Journal 150 (2009) 492–501. |
| [23] | C. K. Chung, T. R. Shih, "Effect of geometry on fluid mixing of the rhombic micromixers", Microfluidics and Nanofluidics (2008) Volume 4, Number 5, 419-425. |
| [24] | J. Branebjerg, P. Gravesen, J.P. Krog, C.R. Nielsen, "Fast mixing by lamination", Proc. MEMS 96, 9th IEEE Int. Workshop MicroElectromechanical System (San Diego, CA) (1996) pp 441–446. |
| [25] | M. S. Munson, P. Yager, "Simple quantitative optical method for monitoring the extent of mixing applied to a novel microfluidic mixer", Anal. Chim. Acta (2004) 507, 63–71. |
| [26] | T. Tofteberg, M. Skolimowski, E. Andreassen, O. Geschke, "A novel passive micromixer: lamination in a planar channel system", Microfluidics and Nanofluidics (2010) Volume 8, Number 2, 209-215. |
| [27] | T.N.T. Nguyen, M.C. Kimb, J.S Park, N.E. Lee, "An effective passive microfluidic mixer utilizing chaotic advection", Sensors and Actuators B, 132 (2008) 172–181. |
| [28] | S. H. Wong, P. Bryant, M. Ward, C. Wharton, "Investigation of mixing in a cross-shaped micromixer with static mixing elements for reaction kinetics studies", Sensors and Actuators B 95 (2003) 414–424. |
| [29] | Z. Xua, C. Li, D. Vadilloc, X. Ruanb, X. Fub, "Numerical simulation on fluid mixing by effects of geometry in staggered oriented ridges micromixers", Sensors and Actuators B 153 (2011) 284–292. |
| [30] | X. Fu, S. Liu , X. Ruan, H. Yang, "Research on staggered oriented ridges static micromixers", Sensors and Actuators B 114 (2006) 618–624. |
| [31] | K. Malechaa, L.J. Golonkaa, J. Bałdygab et al., "Serpentine microfluidic mixer made in LTCC", Sensors and Actuators B 143 (2009) 400–413. |
| [32] | Y. Du, Z. Zhang, C. Yim, M. Lin, X. Cao, "Evaluation of Floor-grooved Micromixers Using Concentration-channel Length Profiles", Micromachines (2010), 1, 19-33. |
| [33] | T. R. Shih, C.K. Chung, "A high-efficiency planar micromixer with convection and diffusion mixing over a wide Reynolds number range", Microfluidic Nanofluidic (2008) 5:175–183. |
| [34] | S.W. Lee, D.S. Kim, S.S. Lee, T.H. Kwon, "Split and recombination micromixer based on PDMS three-dimensional micro structure", The 13th International Conference on Solid-state Sensors, Actuators and Microsystems, Seoul, Korea, June 5-9 (2005) 1533-1536. |
| [35] | S.W. Lee, D.S. Kim, S.S. Lee, T.H. Kwon, "A split and recombination micromixer fabricated in a PDMS three-dimensional structure", J. Micromech. Microeng. 16 (2006) 1067–1072. |
| [36] | K. Ohkawa, T. Nakamotob, Y. Izukab, et al., "Flow and mixing characteristics of σ-type plate static mixer with splitting and inverse recombination", Chemical Engineering Research and Design 86 (2008) 1447–1453. |
| [37] | S.W. Lee, S. S. Lee, "Rotation effect in split and recombination micromixing", Sensors and Actuators B 129 (2008) 364–371. |
| [38] | W.F. Fanga, J.T. Yangb, "A novel microreactor with 3D rotating flow to boost fluid reaction and mixing of viscous fluids", Sensors and Actuators B 140 (2009) 629–642. |
| [39] | Z. Chen, M.R. Bown, B. O. Sullivan, J. M. MacInnes, R.W. K. Allen, M. Mulder, M. Blom, R. van’t Oever, "Performance analysis of a folding flow micromixer", Microfluid Nanofluid (2009) 6:763–774. |
| [40] | P. Garstecki, M.J. Fuerstman, M.A. Fischbach, S.K. Sia, G.M. Whitesides, "Mixing with bubbles: a practical technology for use with portable microfluidic devices", Lab on a Chip 6 (2006) 207-212, doi :10.1039/b510843h. |
| [41] | N.T. Nguyen, "Micromixers: Fundamentals, Design and Fabrication", William Andrew, Norwich, NY, USA (2008). |