Jabbar-Ali Zakeri , Masoud Fathali, Nima Boloukian R
School of Railway Engineering, Iran University of Science and Technology
Correspondence to: Jabbar-Ali Zakeri , School of Railway Engineering, Iran University of Science and Technology.
| Email: |  |
Copyright © 2012 Scientific & Academic Publishing. All Rights Reserved.
Abstract
Rail cant parameter, applied in order to attain suitable movement of wheel on rail, directly influences in dynamic interaction of track-vehicle. In this paper, the effect of geometrical parameters on the behaviour of dynamic interaction of wheel-rail is being investigated through a parametric study. A complex dynamic analyses using ADAMS/RAIL are being applied for one section of actual executed line and the records of geometrical parameters have been registered for this purpose. The necessary measurements have been recorded by KRAB measuring machine, safety levels and serviceability have been controlled based on these data. The results of the analysis show that non-conformity of the rail seat slope relative to its desired value, strictly influences on the coefficient of derailment (about 18 percent), horizontal dynamic forces (about 17 percent), and results in severe rail wear (about 18 percent). However, vertical dynamic forces and safety index are not of any concern form the derailment point of view, since it is within the acceptable range of the standards. The comparison of analyses' results in various operational speeds shows a remarkable impact on the vertical dynamic forces (up to 13 percent) and derailment index (up to 8 percent).
Keywords:
Railway Track Dynamics, Wheel-Rail interaction, Safety, Derailment Coefficient
Cite this paper:
Jabbar-Ali Zakeri , Masoud Fathali, Nima Boloukian R , "Effects of Rail Cant on Wheel-Rail Contact Forces in Slab Tracks", International Journal of Mechanics and Applications, Vol. 1 No. 1, 2011, pp. 12-21. doi: 10.5923/j.mechanics.20110101.02.
1. Introduction
The condition of the track and rolling stock has a considerable effect on the dynamic behaviour of the railway track. The damages on each of them will increase the wear of the wheel and rail, operation and maintenance costs and will reduce the safety and travel comfort indices. Improvement of the geometry irregularities in slab tracks is not simple and cause lots of problems. Thus, accurate investigation and control of track before operation is so effective in improvement of the operation and infrastructure reliability parameters. In this subject the most important and inevitable part is gathering adequate data on track geometric specifications, predicting its current conditions and making essential adjustments in order to keep it in a desirable condition. The irregularities in geometric specifications increase the vertical and horizontal accelerations that the passengers are exposed to and also wheel-rail contact forces. Lateral and horizontal accelerations disturb the passenger comfort and the contact forces increment result in severe rail wear, train movements complication and much risk in track derailment. Moreover some irregularities in track geometric specifications directly increase the track derailment risk, so investigating and eliminating these faults has priority to the actions. actions. According to allowable tolerances of standards the geometric irregularities should be limited to control the accelerations and contact forces. "Track Geometry" defines the position of two rails with the use of different parameters regarding to each other and route axis. These parameters are: right and left rail longitudinal level, right and left rail horizontal cross level, gauge, track twist and rail cant (zakeri, 2006). The rail cant is the result of rail rotation around its longitudinal axis towards to the inner direction of the rail and is expressed by related angle. The wheels profile cone angle is selected proportional to this cant. This cant is 1:20 in Iranian railways. In order to optimize the amount of wear, some countries have decreased this cant to 1:40. This reduction diminishes the wheel-rail wear. In last decades, AREMA suggested to use plates with cant of 1:40 under the rails. However the North American railways didn't follow this rule totally, so that the Union Pacific railway cant is 1:30 and the Canadian railway's is 1:20. There is a similar circumstance in the Europe. So that the utilized cant in most of European countries and the former USSR countries is 1:20 and in German railway is 1:40 (Kerr, 2003). If this cant changes in track ties continuously, these alterations will appear as track lateral and longitudinal unevenness and will excite the track-vehicle dynamic system. Thus by taking into consideration the train-track interaction, dynamic analysing is so essential. Many researchers [(Janusz and Henryk, 2010), (Zakeri and Xia, 2008)] have investigated the train-track dynamic behaviour by changing each of the geometric parameters. However there are no more investigations on rail cant and its effects on dynamic behaviour of train-track interaction. Also in order to measure wheel-rail (Esveld, 2001) and rail-tie forces, several case studies (Xin and Gao, 2010) has been done and their results show the relation between subgrade condition (packed or not, stabilized or not and etc) and track unevenness. In this paper according to the importance of the subject, rail cant changes in the slab track of Mashhad LRT line is investigated. By considering the difficulties of track geometry improvement in slab track in comparison with ballasted track, in order to reduce the track geometry improvement costs, as-built track even with differences in rail cants will be beneficial (Sonmez and Ontepeli, 2009).
2. Track Dynamic Analysis
Although quality index determination is necessary particularly after track construction, but in some situations by considering the train-track interaction, the dynamic analysis necessity is justifiable. The dynamic analysis is the only way to know the railway systems behaviour accurately, because the nature of the railway system is dynamic and so complicated. Here are the reasons which confirm this fact:1. random and repetitive nature of the applied load2. composite and looseness nature of the track structure3. Complicated manner of train-track interaction and also vehicle movement on the track Usually the dynamic behaviour of track is done to achieve track derailment risk, vertical and longitudinal forces on the track, wheel-rail wear, vehicle stability, and travel comfort evaluation. In these analyses the track geometry is investigated and compared in two ways, using assumed data and real ones. If the dynamic analysis is based on the measured geometric parameters of existing track with considering the wheel movement on the rail, real track simulation and investigating the vehicle behaviour in different conditions and especially in critical points will be possible. Technical results from these analyses will lead to safer and better track utilization. Using the dynamic analysis and measured track geometric parameters, it's possible to model the vehicle-track interaction almost in existing condition. So, in addition to reliable track condition, we will have accurate information about safe movement of the train especially in critical points like curves. But the most important factor to justify the dynamic analysis is that in some cases the current track quality indices are not able to answer all the questions about track quality. Because all the parameters which may cause a problem in train movement especially under dynamic loads, is not considered in track quality index analysis. What is so important is that, maybe according to these indices the track condition is great and is exactly in accordance with the standards while the hidden failures in the track may cause critical situations. In the following case studies it's shown that how some parameters like rail cant which is not considered in track quality index may affect track behaviour and make large differences with initial predicted consequences.
3. Case Study
3.1. The Problem Definition
In this section, the dynamic analysis of light rail transit system is investigated. In this case out of tolerance construction of twin-block ties in rail cant had caused problems in some parts of the track execution and had made concerned about its operation. However the other part of the track was constructed with no consideration to this parameter. Having accurate knowledge on current conditions of the track was a useful help in making decision on the method of execution in the other parts of the track. So the rule of accurate dynamic analysis with considering the wheel-rail interaction, using real simulation in order to know the real behaviour of the system especially before its operation, is undeniable. To investigate the track current conditions and also to get the input date of the dynamic analysis, the cant of the stored sleepers in site was measured. Furthermore in the as-built track the rail cant was measured in every 20 m by the workers. So these are the fundamental problems which are mentioned below: 1- What is the level of track safety with a view to track derailment? 2- What is the level of reliability in track maintenance condition especially in wheel-rail wear? 3- By considering the rail cant in grade path, what are the requirements of continuing the remained track with a view to rail cant?
3.2. The Methodology of Analysis
The first step to start the dynamic analysis was gathering the accurate information related to track geometric condition such as geometric information of curves and track geometry data obtained from track measurement machine and in the other hands the information of rail and wheel profile. In the second step, the principles of the track derailment which is the most important parameter in track safety and stability, was studied. In the third step according to these principles and the obtained information, the dynamic simulation of vehicle movement was done accurately. This simulation is done using ADAMS/RAIL software. In the last step with the use of this model, the train-track interaction numerical analysis is performed. This analysis resulted in different indices such as track derailment probability, lateral and vertical forces and wear number. All of these results are mentioned in conclusion.
3.3. Dynamic Analysis Assumptions and Basics
The non uniform rail cant has made the dynamic analysis so complicated. So, the modelling, simulating and out come process is completed with high accuracy. In this section the basics of the dynamic analysis is presented. The simulating and numerical modelling assumptions are: 1- According to light rail transit system design, the design speed and operation speed are 80 km/h and 50 km/h. Because of these complicated conditions as mentioned before, all the dynamic analyses were based on the operation speed. At last, the comparison of results for operation and design speeds is presented. 2- The axle load which is used for analysis is based on passenger car. The selected one is 10t averagely and is considered as light rail transit systems axle load. 3- The modelling is done in the most critical points of the track, i.e. an arc of S shape with radius of 1000m and an ordinary arc with radius of 540m.4- The analysis is done in two manners: with exerting the geometric irregularity and without that. This irregularity is measured by a kind of track measurement machine which is called "KRAB" (Boloukian and Fathali, 2008). This machine is shown in figure (1). 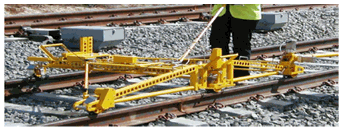 | Figure 1. KRAB track measurement machine. |
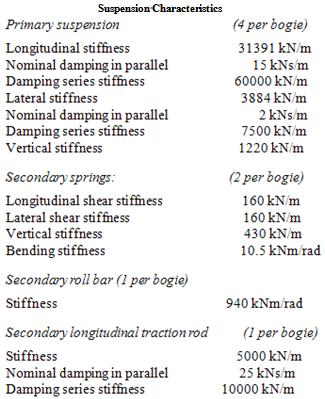
5- For this analysis the Manchester Benchmark passenger car is selected because the vehicle type was not specified. This car is an international standard in dynamic simulation. In analysis, the vehicle is a general passenger coach with two bogies and a simple primary suspension. This model is as simple as practically possible and further simplifications during the simulation may be carried out by the package operator if desired. All bodies should be considered rigid.The vehicle specification is presented in appendix A. (adopted from (Iwnicki, 1998).6- The fundamentals of derailment are based on the Nadal formula which is an international formula. The equation of this theory is (Iwnicki, 1998 and Zhu et al, 2010):  | (1) |
Where L is horizontal force, V is vertical force,is friction factor between wheel and rail andis wheel flange angle. The left part of the equation (1) shows the derailment forces and the right hand shows the stability forces (Kalker, 1990). L/V is called derailment coefficient. In most of wheel profiles (new wheel/rail profiles) the wheel flange angle is θ=68. But according to variations of wheel and rail profiles the angle changes and should be recalculated for worn profiles (Kerr, 2003). The value of μ depends on geometry, location and roughness of contact patch which vary in different conditions. 7- In this process the most important parameter is rail cant. So regarding to parametric study, several models has been simulated. In this parametric study first the constant cants and then variable cant are utilized. The constant cants are: 1:25, 1:28, 1:30 and 1:35 and variable cant is defined by basis probability function and considering all the mentioned constant cants. According to appropriate distribution, this variable cant is exerted in the simulation. This probability distribution is based on the track measurements and each cant portion in constructed ties. Finally based on the obtained data from track, the existing model is completed for an S shape Curve. These data are existing cants gathered with distance of 20m by using rail cant gathering apparatus which was constructed in the site. It is worthy of mention that the criterion cant in this analysis is 1:40 and the standard rail cant for light rail transit system is in accordance with design standard. 8- ADAMS/RAIL software is the used for modelling. This software is utilized for simulation and dynamic analysis of railway vehicles. Its workspace is a virtual unit that makes it possible to simulate the vehicle interaction accurately. The requirements of this software for interaction analysis include: vehicle specifications such as; mass and inertia, stiffness and damping factor, tracks such as rail profile, geometric irregularities and also subgrades. Its output is dynamic behaviour of vehicle that includes forces, displacements and accelerations. Also it presents the prediction of some criteria such as track derailment, wear, noise and passenger comfort.
3.4. Dynamic analysis results
The output of analysis is shown for the most critical part which is called the wheel of front and rear bogie. In the results of analysis, T indicates the curve. Its first index shows the curve number and the second one indicates the rail cant. T25 shows the variable cant in the analysis. The existing cants related diagrams are represented too. Furthermore, statistic mode of the results is evaluated using three parameters. These parameters include minimum, maximum and RMS (root mean square) which depends on the type of result and related parameter. RMS is an important geometric parameter, particularly in expressing the average of vertical and lateral forces and wear number.
3.4.1. Derailment Coefficient
This coefficient expresses the probability of derailment (according to eq. (1)). The related diagrams are shown in figures (2) and (3). In figure (4) the existing derailment coefficient is compared with the results of 1:35 cant that has the best outputs in comparison with the other results. For the first curve, the comparison of outputs is given in table (1). As you see, regarding to desired conditions of the track, derailment coefficient in reality is not critical. The maximum probability of derailment is 30% which has no considerable variation in comparison with the cant of . Although the sleepers cant is out of standard limitations, but noncritical probabilities show that this cant doesn't have considerable effect on disturbing the vehicle stability. The results of a case study using S49 rail and S1002 wheel profile by (Esveld, 2001) confirm this consequence. So according to the analysis of this paper, we can express that the derailment coefficient doesn't have any significant rule in safety of movement and train stability. It's mentionable that these results are based on desired geometric layout and track standard.| Table 1. The results of derailment probability dynamic analysis for the first curve. |
| | Maximum probability of derailment | Manner | 1:25 | 1:28 | 1:30 | 1:35 | variable | Existing | | Front bogie | 0.2486 | 0.2520 | 0.2381 | 0.2202 | 0.2409 | 0.2590 | | Rear bogie | 0.2378 | 0.2486 | 0.2316 | 0.2164 | 0.2351 | 0.2510 |
|
|
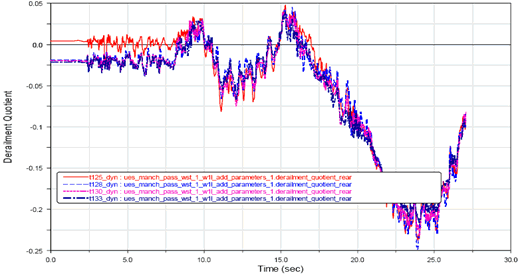 | Figure 2. Derailment coefficient of rear wheel in the first curve for the constant cants (with track geometric irregularities). |
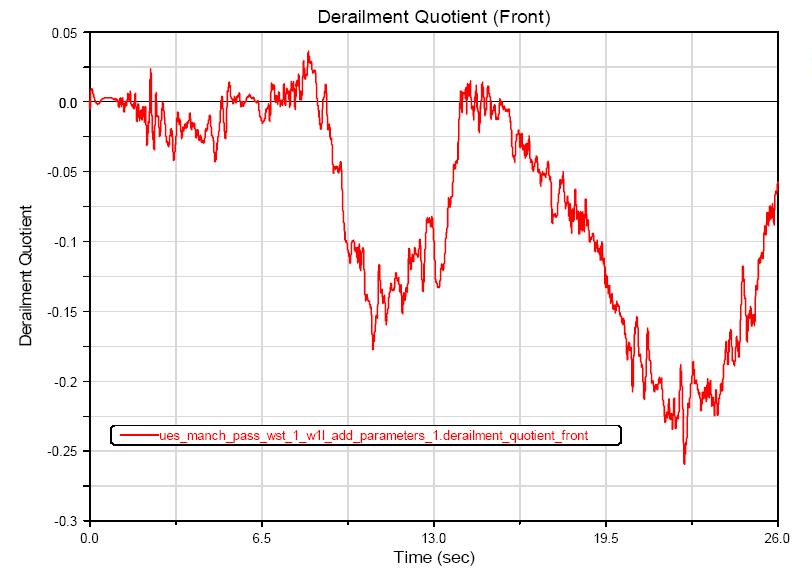 | Figure 3. Derailment coefficient of the first curve for existing cants. |
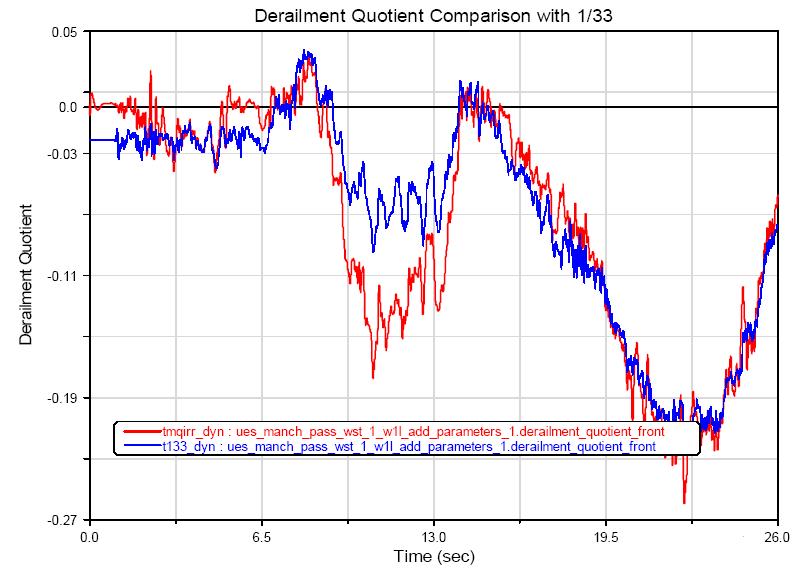 | Figure 4. derailment coefficient of the first curve for existing cants in comparison with 1:35cant. |
3.4.2. Vertical forces
These forces express the dynamic vertical forces under geometrical condition of the rail and its interaction with wheel. The diagrams of these forces in different modes are shown in figures (5) and (6). In figure (7) the vertical forces of existing mode are compared with the results of 1:35 cant which has the best outputs in comparison with the other results. Also, the comparison of outputs for the first curve is given in table (2). According to these results, the average of dynamic vertical forces is about 56.3 kN and even in some cases is more than 63 kN. This shows that in this mode the augmentation of dynamic forces are more than ideal condition, about 20%. Although in track superstructure design the dynamic coefficient is considered (zakeri and Sadeghi, 2007), but its influence on exerted lateral forces, wear number and finally the track life time is considerable.| Table 2. The results of vertical forces dynamic analysis for the first curve. |
| | Maximumdynamic verticalforces (N) | Manner | 1:25 | 1:28 | 1:30 | 1:35 | Variable | Existing | | Front bogie | 63500.1 | 63599.4 | 63504.9 | 63657.4 | 63562.6 | 63896.2 | | Rear bogie | 60403.2 | 60641.7 | 60393.5 | 60201.2 | 60516.2 | 60580.5 |
|
|
 | Figure 5. The dynamic vertical force of first curve for constant cants (with track geometric irregularities). |
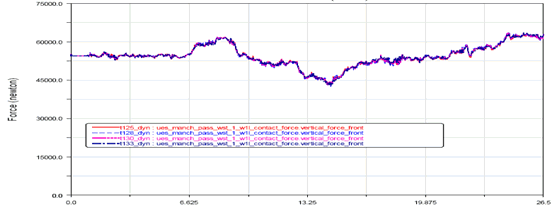
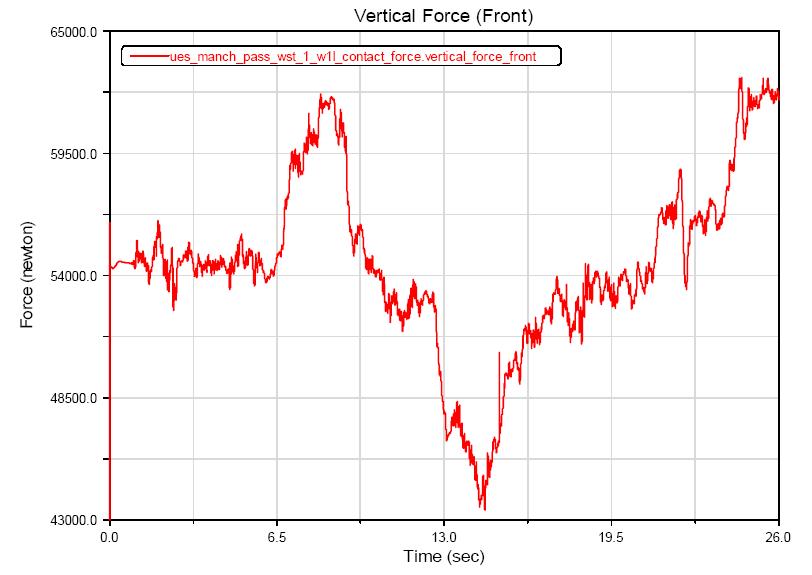 | Figure 6. Dynamic vertical force of the first curve in existing cants. |
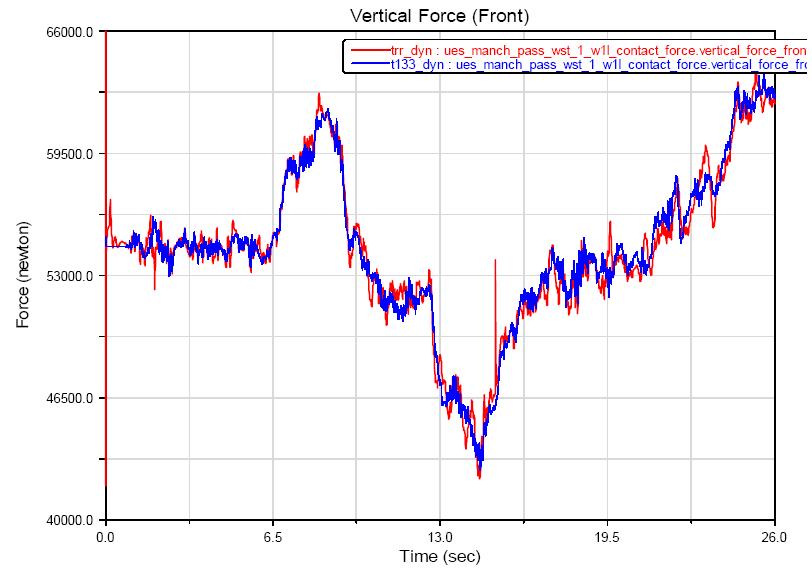 | Figure 7. dynamic vertical force of the first curve for existing cants in comparison with 1:35cant. |
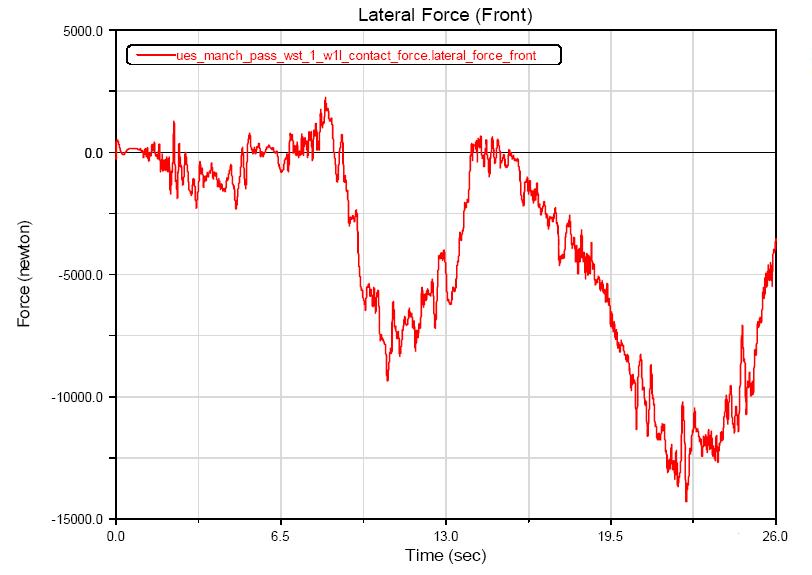
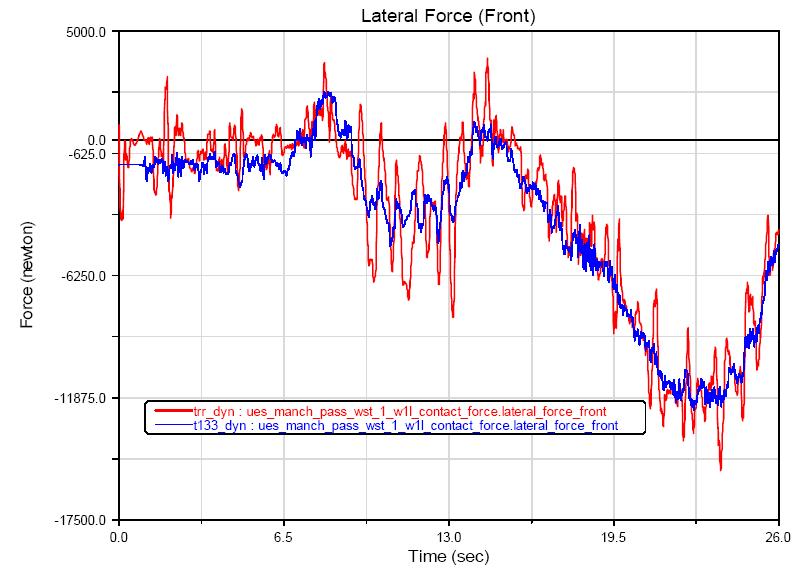
3.4.3. Lateral Forces
This parameter expresses the dynamic lateral forces under geometrical condition of the rail and its interaction with wheel. The diagrams of these forces in different modes are shown in figures (8) and (9). In figure (10) the lateral forces of existing mode are compared with the results of 1:35cant which has the best outputs in comparison with the other results. Also, the comparison of outputs for the first curve is given in table (3). According to these results, even in some cases the dynamic lateral forces are more than 14.3 kN. This shows that in this mode the augmentation of dynamic forces are more than ideal condition. So that according to design criteria in a straight track with an axle load of 10t in ideal track conditions, this force is about 10 kN on curves (AREMA, 2006).| Table 3. The results of lateral forces dynamic analysis for the first curve. |
| | Maximum dynamic lateral forces (N) | Manner | 1:25 | 1:28 | 1:30 | 1:35 | variable | Existing | | Front bogie | 13940.0 | 14205.4 | 13572.0 | 12430.8 | 13675.1 | 14305.6 | | Rear bogie | 13555.8 | 14356.6 | 13225.1 | 12320.9 | 13673.7 | 14154.3 |
|
|
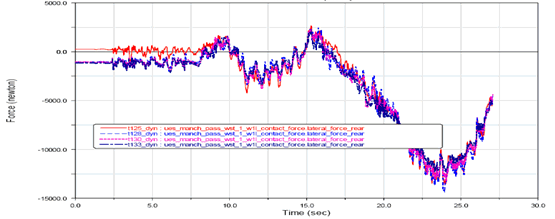 | Figure 8. dynamic lateral forces of the first curve for constant cants (with track geometric irregularities). |
 | Figure 9. dynamic lateral force of the first curve for existing cants. |
 | Figure 10. dynamic lateral force of the first curve for the existing cants in comparison with 1:35cant. |
3.4.4. Wear Number
In this context, the energy dissipation is defined as the energy loss per meter of travelled distance. (Ansari et al, 2208) and (Orvnas et al, 2007) Somewhat; simplified, neglecting the rotational spin creep and its resulting spin moment, the energy dissipation is equal to the product of creep force vector and creep vector in the contact patch:E = F · υ (Nm/m)Sometimes the simplified energy dissipation according to Equation (1) is called wear number. This parameter expresses the degree of wheel-rail wear under vertical and lateral dynamic forces. If the resulted number is high, shows that the rail wear is high. Also this number explains the future state of the track maintenance. Here is the calculation of wear number based on the United Kingdom railway standards: 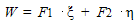 | (2) |
WhereF1: longitudinal creep force ξ: Longitudinal creep F2: lateral creep force η: lateral creep The diagrams of wear number in different modes are shown in figures (11) and (12). In figure (13) the wear number of existing mode is compared with the results of 1:35cant which has the best outputs in comparison with the other results. Also, the comparison of outputs for the first curve is given in table (4). The resulted wear number of this dynamic analysis is very high. In the case study the number designated values are high especially in the second curve which its radius is less than the first one's (first one is 1000m and the second one is about 500m). According to these results, the percentage of the index is higher in comparison with the ideal condition of 1:35cant, about 45%. Due to very high lateral forces as compared with ideal state, this large difference is predictable. The considerable point is that, the large forces will have a main effect on the wear in low wear mode. The wear of wheel and rail is so effective in passenger comfort, reduction of wheel-rail life time and in critical conditions in train movement safety. So because of these reasons paying attention to wear is so essential. 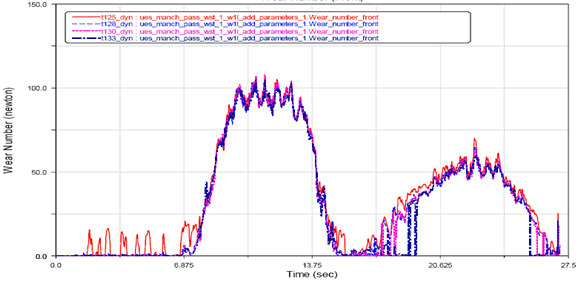 | Figure 11. The first curve wear number for constant cants (with track geometry irregularities). |
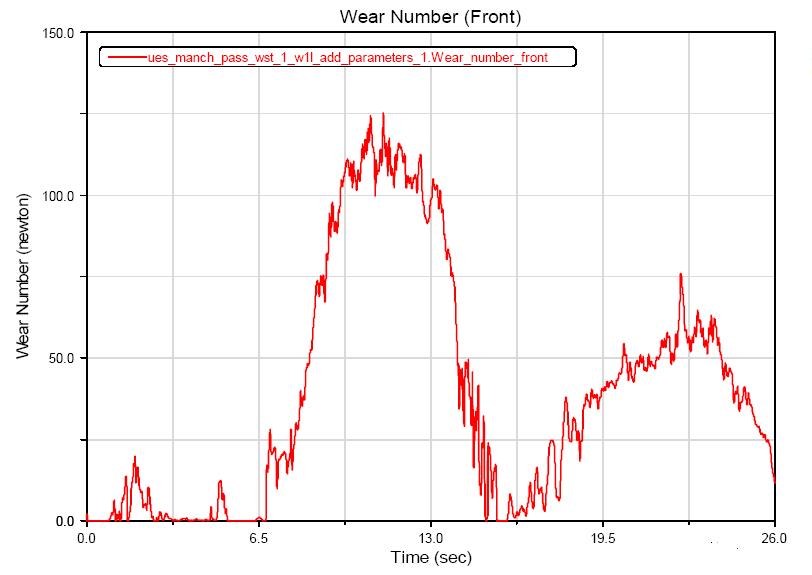 | Figure 12. the first curve wear number for existing cants. |
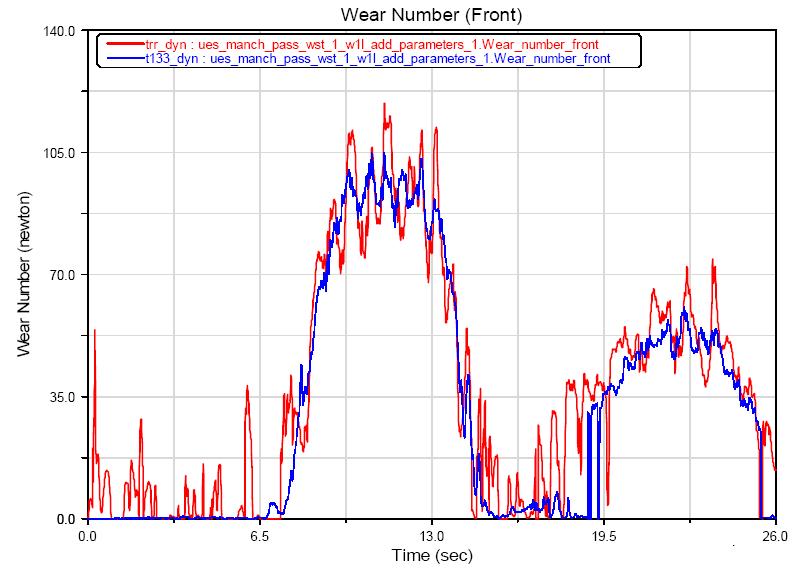 | Figure 13. The first curves wear number for existing cants in comparison with 1:35cant. |
| Table 4. the results of dynamic analysis for the first curve. |
| | Wear number | Manner | Manner | 1:25 | 1:28 | 1:30 | 1:35 | variable | Existing | | Front bogie | RMS | 47.84 | 45.97 | 46.49 | 45.57 | 47.45 | 53.67 | | maximum | 105.66 | 103.79 | 107.73 | 104.75 | 109.93 | 125.32 | | Rear bogie | RMS | 44.56 | 42.24 | 42.45 | 41.57 | 42.94 | 48.41 | | maximum | 99.68 | 97.10 | 99.03 | 97.38 | 101.94 | 113.41 |
|
|
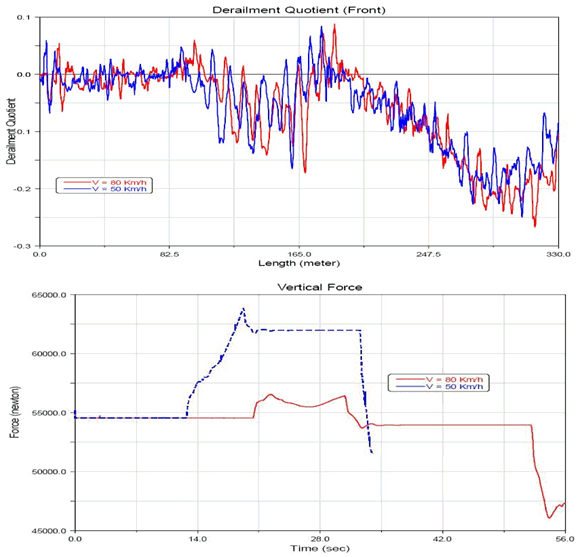 | Figure 14. Comparison of derailment coefficient and dynamic vertical forces in the velocity of 50 and 80 km/h. |
Finally, derailment coefficient and dynamic forces resulted of two different speeds (50 and 80 km/h) is compared (figure 14) to indicate the unfavourable conditions in high speed. According to these results, the train speed is so important in track forces augmentation. So this shows the necessity of stability analysis in which the safe speed of system and/or some probable critical points speed is specified.
4. Conclusions
In this paper, the analytical methods for track geometric controlling are investigated. As mentioned in the text, the geometrical quality indexes limitations in expressing the real conditions of the track particularly in specific conditions such as supervising the construction process incorrectly or utilizing damaged elements and out of permissible tolerances, is studied. One of these specific limitations in current methods of track quality index analysis is disregarding the rail seat cant which clarifies the improvement of the index. This matter indicated the necessity of more accurate dynamic analysis using real simulation of wheel-rail interaction, more than ever. In the next step, a case study is presented. In Mashhad Light Rail Transit system, this case is accomplished. The dynamical view of this study is to achieve an accurate condition of track, regarding to utilized sleepers with out of tolerance cants. In order to answer all the possible questions during execution such as track safety and supporting the decisions in track execution continuation, with ADAMS/RAIL software the wheel-rail interaction is modelled and train-track dynamic interaction is simulated. This analysis displayed that, although the effect of derailment factor on track safety is not critical but the track structure is under incremented dynamic loads which lead to sever wear and rapid deterioration of track. So that augmentation of vertical and lateral forces was about 20% and 45%, respectively. Also the wear number of existing conditions had the increase of 45% in regard to ideal conditions. This shows the great importance of rail seat cant and its accurate execution. Thus using specific method in track maintenance is necessary to increase the track life time and control the wear.
ACKNOWLEDGMENTS
The contributions of Mr.Taheri, site supervisor of Mashhad rapid transit system (Line 1), and of Mr.Alli Atabak, General Manager of Rah pouyan Consulting Engineers, are gratefully acknowledged.
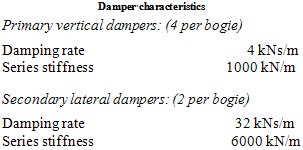
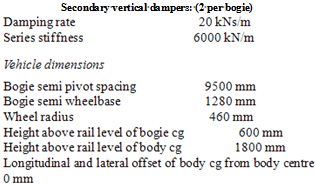
Appendix –A: VEHICLE SPECIFICATION - Benchmark Vehicle 1
This is based on the ERRI B176 benchmark vehicle, without yaw dampers, and with the following major simplifications:Simple primary suspensionSymmetric vehicleNon-inclined dampers with simple damping ratesThe model of this vehicle should be run with track cases 1,2, and 3.
References
| [1] | Ansari, M.; Hazrati, I. A.; Esmailzadeh, E.and Azadi, S. 2008. Wear rate estimation of train wheels using dynamic simulations and field measurements. Vehicle System Dynamics, 46 (8): 739~759. |
| [2] | AREMA: Manual for Railway Engineering, American Railway Engineering and Maintenance-of-Way Association, Vol. 1, Chs: 1, 4, 5, 30, Vol. 4, Ch2. 2006. |
| [3] | Boloukian, N.; Fathali, M. 2008. Dynamic Analysis of Rail-Wheel Interaction for Mashhad LRT Line. Rahpuyan Consulting Co. |
| [4] | Esveld, C. 2001. Modern Railway Track. 2nd ed. Delft University of Technology Pub Service. |
| [5] | Iwnicki, S. 1998. The Manchester Benchmarks for rail vehicle simulation, Manchester Metropolitan University, Department of Mechanical Engineering, Rail Technology unit. |
| [6] | Janusz, K.; Henryk, C. 2010. A Vehicle-Track-Soil Dynamic Interaction Problem in sequential and parallel formulation, International Journal of Applied Mathematics and computing sciences, 20(2): 295–303. |
| [7] | Kalker J.J. 1990. Three-Dimensional Elastic Bodies in Rolling Contact, Kluawer Academic Publishers, Dordrecht. |
| [8] | Kerr, Arnold D. 2003. Fundamentals of Railway Track Engineering, First Edition, Simmons-Boardman Books, Inc. |
| [9] | Orvnäs, A.; Andersson, E. and Persson, R. 2007. Development of Track-Friendly Bogies for High Speed – A Simulation Study, KTH Railway Group, Stockholm. |
| [10] | Sonmez, R. and Ontepeli, B. 2009. Predesign cost estimation of urban railway projects with parametric modeling, Journal of civil engineering and management, 15(4): 405-409. |
| [11] | Xin, T.and Gao, L. 2010. Reducing slab track vibration into bridge using elastic materials in high speed railway, Journal of Sound and Vibration, doi:10.1016/j.jsv.2010.11.023. |
| [12] | Zakeri, J. A. 2006. Methods of railway track maintenance. 1st ed. Iran University of Science and Technology Pub Service. |
| [13] | Zakeri, J. A., Sadeghi, J. 2007. Field Investigation on Load Distribution and Deflections of Railway Track Sleepers. Journal of Mechanical science & Technology 21(12): 1967-1976. |
| [14] | Zakeri, J. A. and Xia, H. 2008. Sensitivity Analysis of Track Parameters on Train- Track Dynamic Interaction. Journal of Mechanical science & Technology, 22 (7): 1299-1304. |
| [15] | Zhu, J. J.; Ahmed, A. K. W.; Rakheja, S. and Khajepour, A. 2010. Development of a vehicle-track model assembly and numerical method for simulation of wheel-rail dynamic interaction due to unsupported sleepers, Vehicle System Dynamics, 48(12): 1535 — 1552 |
 Abstract
 Reference
 Full-Text PDF
 Full-Text HTML